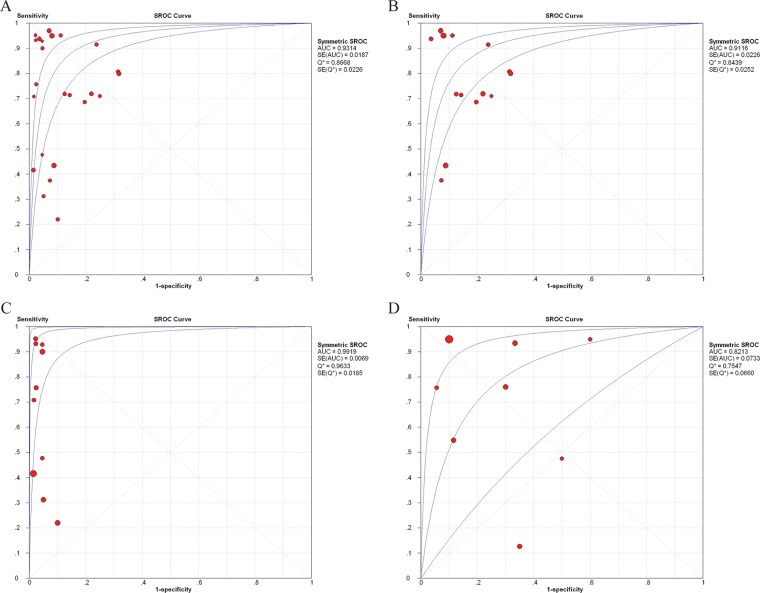
Figure 3. SROC curves for cell-free DNA assays in diagnosis of breast cancer.
SROC curves for cell-free DNA assays in diagnosis of breast cancer. SROC curves for cell-free DNA assays in diagnosis between healthy individuals and breast cancer patients (A), and between benign breast disease and breast cancer patients (D). SROC curves for methodological groups using quantitative (B) and qualitative (C) analysis of cell-free DNA in the diagnosis of breast cancer.  = each study in the meta-analysis (the size of each study is indicated by the size of the solid circle); red line = weighted regression; and blue line = unweighted regression. SROC curves summarize the overall diagnostic accuracy. The confidence ellipse indicates that the mean values for sensitivity and specificity were more likely to be in this region. The prediction ellipse (increased uncertainty) indicates that individual values for sensitivity and specificity were more likely to be in this region.

