Abstract
Shear wave measurements for the determination of tissue elastic properties have been used in clinical diagnosis and soft tissue assessment. A shear wave propagates as a transverse wave where vibration is perpendicular to the wave propagation direction. Previous transverse shear wave measurements could detect the shear modulus in the lateral region of the force; however, they could not provide the elastic information in the axial region of the force. In this study, we report the imaging and quantification of longitudinal shear wave propagation using optical coherence tomography to measure the elastic properties along the force direction. The experimental validation and finite element simulations show that the longitudinal shear wave propagates along the vibration direction as a plane wave in the near field of a planar source. The wave velocity measurement can quantify the shear moduli in a homogeneous phantom and a side-by-side phantom. Combining the transverse shear wave and longitudinal shear wave measurements, this system has great potential to detect the directionally dependent elastic properties in tissues without a change in the force direction.
Elastic properties of biological tissues are important indicators for the assessment of tissue function and clinical diagnosis. Palpation has been commonly used in clinical settings to detect the change in tissue elasticity. However, it only provides a qualitative estimation of tissue stiffness. Elastography has provided a non-invasive imaging modality to assess the state of tissues and diseases by elastic properties of soft tissues since the mid-1990s.1–4
The shear wave measurement is a quantitative method for the determination of elastic properties. For the shear wave measurement in elastography, a force source excites the tissue to induce a shear wave. The shear wave moves through the body of the tissue as a transverse wave where the vibration direction is perpendicular to the wave travel direction. An imaging system detects the vibration in the body to visualize the shear wave propagation. The shear modulus can be quantitatively calculated from the shear wave velocity by the following equation:
| (1) |
where is the tissue density.5
Ultrasound imaging and magnetic resonance imaging have been used to image shear wave propagation in tissues.6,7 However, the spatial resolutions of elastic maps are limited by the imaging technologies. Benefiting from the micrometer spatial resolution and millimeter penetration of optical coherence tomography (OCT), optical coherence elastography (OCE) based on the shear wave measurement has shown promising results in biomedical studies, including blood coagulation assessment,8 ocular elasticity assessment,4,9 and cardiac muscle measurement.10 In an OCE application, an excitation from a force source, such as an ultrasonic transducer,11–15 an air-puff device,9 and a piezo-transducer (PZT),16 is commonly applied to induce vibration, and OCT is used to detect the displacement and visualize the shear wave. Using shear wave elastography, the shear modulus is quantified by tracking the shear wave propagation. In previous measurements, the transverse shear wave propagates perpendicular to the force direction, so the shear modulus in the lateral region of the force can be quantified;11–13 however, the shear modulus in the axial region of the force cannot be measured.
In this study, a longitudinal shear wave is induced by a PZT and visualized using OCT for the quantified mapping of shear moduli. Because of diffraction effects, the shear wave presents as a longitudinal wave in the near field where the shear wave propagates in the same direction as the force direction and the vibration direction. In a homogeneous phantom and a heterogeneous side-by-side phantom, the longitudinal shear waves traveling as plane waves are visualized, and the shear moduli are mapped based on wave velocity measurements. The finite element simulations also validate the presence of a longitudinal shear wave in our system. Combination of the detection of the transverse shear wave and the longitudinal shear wave provides opportunities for measurements of elastic properties in anisotropic tissues.
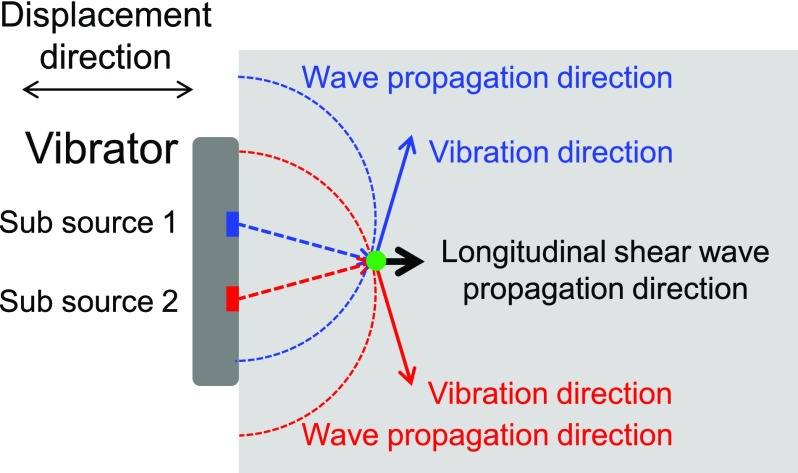
When a planar vibrator induces displacement onto a soft tissue, two main types of elastic body waves will travel through the sample, including a compressional wave propagating along the displacement direction and a shear wave propagating perpendicular to the displacement direction. The compressional wave is a longitudinal wave and the shear wave is a transverse wave. However, in the near field of the planar vibration source, a third wave, which is a longitudinal shear wave, will propagate along the displacement direction with a velocity much lower than the compressional wave.17 When the planar vibrator is regarded as multiple sub-sources, each sub-source will induce a transverse shear wave in the near field due to diffraction effects,18 which is illustrated in Fig. 1. The blue dashed arrow and the blue solid-line arrow indicate the shear wave propagation direction and vibration direction from sub-source 1. The red dashed arrow and the red solid-line arrow indicate the shear wave propagation direction and vibration direction from sub-source 2. At the position where two waves meet (green point), the sum contributions of two transverse shear waves generate a longitudinal shear wave propagating along the displacement direction of the vibrator, which is indicated by the black solid-line arrow. The longitudinal shear wave is present due to contributions of transverse shear waves in the near field of a planar vibration source; however, its propagation direction is the same as its vibration direction. After the measurement of shear wave velocity, the shear moduli of samples can be mapped quantitatively.
FIG. 1.
Longitudinal shear wave induced by a planar vibrator source. Sub-source 1 (blue) and sub-source 2 (red) induce two transverse shear waves. At the green point, the shear wave from sub-source 1 travels along the blue dashed arrow and its vibration direction is along the blue solid-line arrow, and the shear wave from sub-source 2 travels along the red dashed arrow and its vibration direction is along the red solid-line arrow. Globally, the sum contribution of two vibrations is along the black solid-line arrow, and the shear wave propagates along the black solid-line arrow.
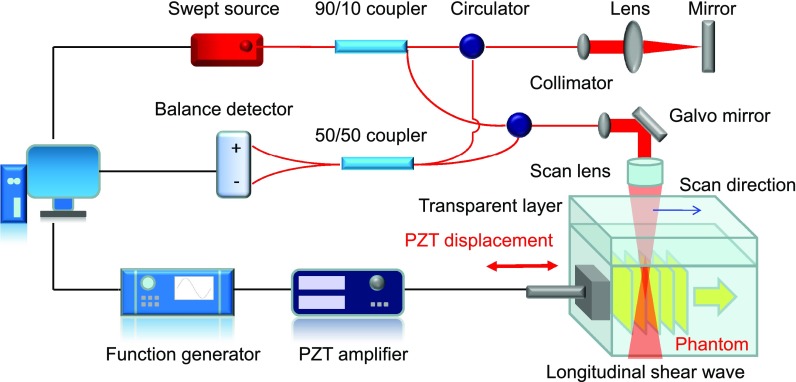
In order to visualize longitudinal shear waves, an OCE system is set up, which consists of a PZT excitation unit for induction of shear waves and an OCT unit for detection of vibration. The schematic of the OCE system is shown in Fig. 2. The OCT unit, which is similar to the one described in a previous study,11 is based on a swept source with a central wavelength of 1310 nm, an A-line rate of 50 kHz, and a wavelength tuning range of 141 nm. The axial and lateral resolutions of the OCT unit are 7.6 μm and 17.7 μm, respectively. In the PZT excitation unit, a function generator controlled by a computer outputs a cycle of a sine wave with a frequency of 1 kHz. The closed loop PZT is driven by a voltage of ± 30 V with a bias of 30 V (after amplification) and the position sensor of the PZT shows a travel range of ± 10 μm. One side of a 22 × 22 mm cover glass adheres to the PZT and the other side closely touches a phantom. We apply a preload to ensure complete contact between the phantom and the cover glass throughout the PZT excitation. Thus, the actual displacement amplitude close to the excitation source is about 10 μm. For the data capture, an M-B scan protocol is used, where each M-scan contains 1000 A-lines and each B-scan contains 3000 M-scans. PZT excitation begins at the 100th A-line of each M-scan and the PZT excitation is applied between 2.0 ms and 3.0 ms.
FIG. 2.
Schematic of an OCE system for visualization of longitudinal shear waves. This OCE system includes a swept source OCT unit and a PZT excitation unit. The PZT unit induces displacement from the surface of a sample. The OCT unit detects the displacement and visualizes the wave propagation.
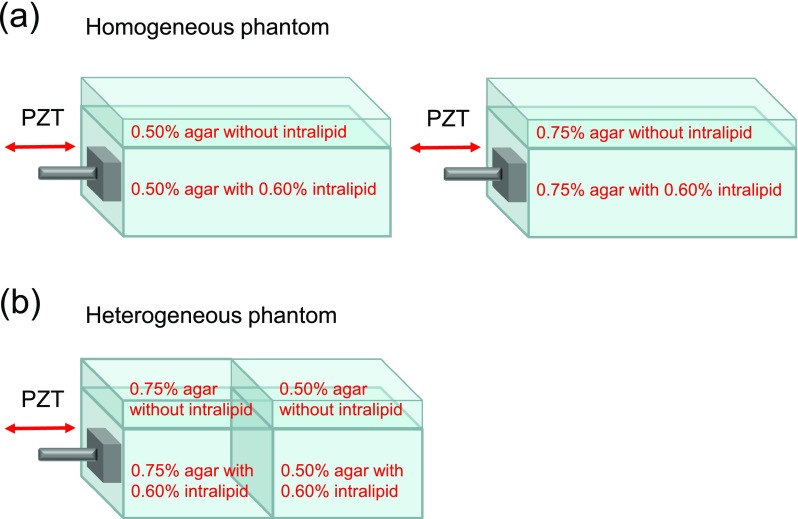
Two homogeneous agar phantoms and one heterogeneous side-by-side agar phantom are detected, as shown in Fig. 3. The homogeneous phantoms are made of agar with concentrations of 0.50% and 0.75% w/v to represent different stiffnesses. The heterogeneous side-by-side phantom contains 0.75% agar on the left and 0.50% agar on the right. On the bottom layer of each phantom, a 0.60% v/v intralipid solution is mixed with the agar solution to increase light scattering for OCT imaging. Without intralipid, the top layer with a thickness of ∼4 mm is almost transparent for OCT imaging. The height of the phantom is ∼50 mm. The thickness of the transparent layer is much higher than the wavelength of the shear wave. When the wave propagates under the transparent layer, distortion from the surface wave is not obvious19 and the boundary conditions can be ignored.
FIG. 3.
The structures of two homogeneous phantoms and one heterogeneous phantom imaged using OCE. The thickness of the top transparent layers without intralipid is about 4 mm. (a) The structures of two homogeneous phantoms with agar concentrations of 0.50% and 0.75%, respectively. (b) The structures of one heterogeneous phantom with 0.75% agar on the left side and 0.50% agar on the right side.
Since the direction of an induced vibration inside a phantom is perpendicular to the OCT beam, we use a Doppler variance method to visualize the vibration.11,20 The Doppler variance is only sensitive to motion perpendicular to the OCT beam and can be used to detect the transverse displacement.21–24 After the OCT beam scans to a new position along the PZT displacement direction, a new M-scan is recorded with another PZT excitation, and Doppler variances are calculated. For the visualization of the longitudinal shear wave, a time interval of 0.2 ms is applied to increase the sensitivity of the detection. Finally, a series of B-scan Doppler variance images over time can be reconstructed.
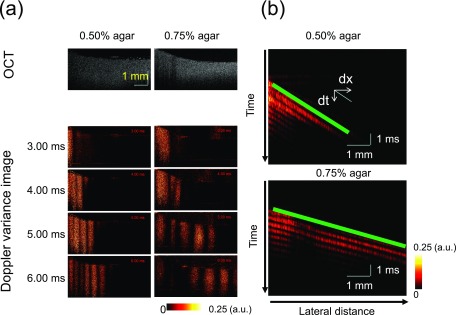
The B-scan Doppler variance images during the wave propagation in homogeneous phantoms are shown in Fig. 4. After PZT excitation from the left side of the phantom, a shear wave propagates from the excitation plane. The shear wave propagates faster in the 0.75% agar phantom than in the 0.50% agar phantom, which indicates that the 0.75% agar phantom is stiffer than the 0.50% agar phantom. As the detected waves travel through the interiors of the phantoms far away from the surfaces, no surface waves distort the shear wave. The size of the glass cover touching the phantoms is much larger than that of the OCT imaging area so that the induced shear waves propagate as plane waves, which are shown in Fig. 4(a). After the visualization of shear wave propagation, the wave velocities can be calculated from spatio–temporal images at a given depth, which are shown in Fig. 4(b). From the ratio of the travel distance to the travel time, the shear wave velocity can be quantified. The shear wave velocity is 0.83 m/s for the 0.50% agar phantom and 1.76 m/s for the 0.75% agar phantom. Based on the relationship between the shear wave velocity and the shear modulus, which is shown in Eq. (1), the shear modulus can be calculated. The density ρ of the phantom is 1000 kg/m3, so the shear modulus is 0.7 kPa for the 0.50% agar phantom and 3.1 kPa for the 0.75% agar phantom. Mechanical tests by MTS Synergie 100 show that the shear modulus is 0.8 kPa for the 0.50% agar phantom and 3.5 kPa for the 0.75% agar phantom, which are close to the values calculated from the shear wave velocities.
FIG. 4.
Longitudinal shear wave propagation in homogeneous agar phantoms. (a) B-scan OCT images and B-scan Doppler variance images during the shear wave propagation in homogeneous agar phantoms. The shear wave propagates faster in the 0.75% agar phantom than in the 0.50% agar phantom. (b) Spatio–temporal Doppler variance images at a given depth. The ratio of the travel distance dx to the travel time dt yields the shear wave propagation velocity c = dx/dt. Green lines indicate the wave propagation traces.
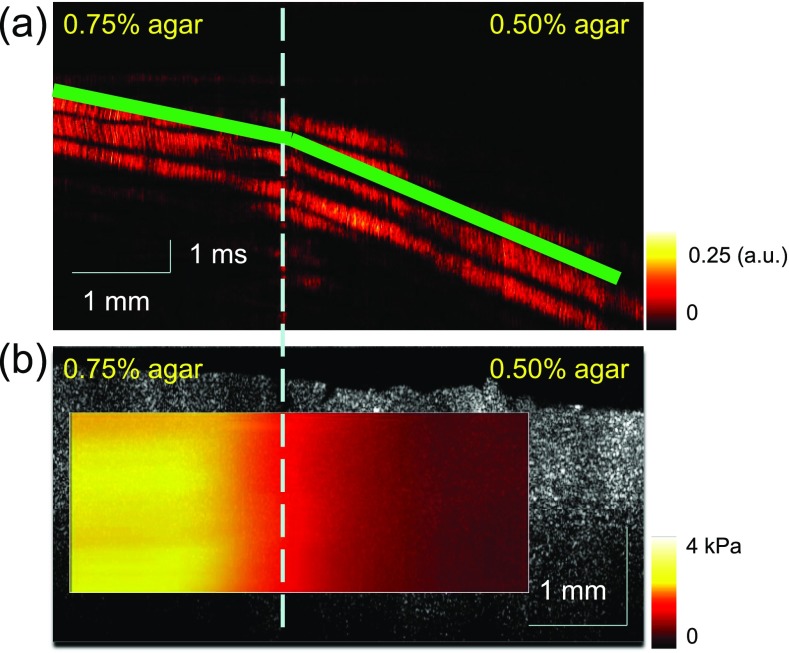
After measurements of homogeneous phantoms, the longitudinal shear wave is detected in a heterogeneous side-by-side phantom for elastic mapping. In the heterogeneous phantom, the agar concentration is 0.75% on the left side and 0.50% on the right side. So the left side is stiffer than the right side. The structure of the heterogeneous phantom is shown in Fig. 3(b). The spatio–temporal Doppler variance image at a given depth shows that the shear wave velocity slows down immediately after the shear wave travels through the boundary of the side-by-side phantom from Fig. 5(a). From the gradient of the slopes at each depth of the phantom, the shear wave velocity can be calculated. A higher shear wave velocity indicates higher stiffness for the sample. The shear wave velocity is 1.71 ± 0.31 m/s in the 0.75% agar side and 0.75 ± 0.11 m/s in the 0.50% agar side. So the shear modulus is 2.9 kPa for the 0.75% agar side and 0.6 kPa for the 0.50% agar side. The shear modulus map in the heterogeneous phantom is shown in Fig. 5(b). The measurement of the longitudinal shear wave can be used for the quantitative determination of elastic properties in the axial region of the force.
FIG. 5.
Mapping of shear moduli in a heterogeneous side-by-side phantom. (a) Spatio–temporal Doppler variance images at a given depth: shear wave velocity changes immediately after the wave travels through the boundary. (b) Shear modulus map in the heterogeneous phantom: shear moduli can be easily distinguished between the two sides with different agar concentrations.
The waves traveling in the phantoms are detected when the propagation is parallel to the vibration. The detected wave is traveling through the interior of the phantom and far away from the surface so the distortion of the surface wave can be ignored. Theoretically, there are two kinds of waves propagating through the interior of a sample, including a shear wave and a compressional wave. For a compressional wave, the propagation direction is also the same as the vibration. The compressional wave velocity can be calculated from the following equation:
| (2) |
where is the bulk modulus, is the shear modulus, and is the density of the sample.5 For the agar phantom used in this study, the theoretical velocity of the compressional wave is 1483 m/s when is 2.2 GPa, is 1 kPa, and is 1000 kg/m3. The compressional wave at such a high speed cannot be detected with the A-line rate of 50 kHz in the OCT unit because the wave will travel about 30 mm between adjacent frames. Therefore, the distortion of the compressional wave can be ignored, and the detected wave can be considered as a pure shear wave.
Using finite element analysis, the vibrations are analyzed at 5.0 ms when the 0.5% agar phantom is excited by a point source, two adjacent point sources, and a planar source, respectively (see supplementary material). The particle vibrations induced by a point source are mostly perpendicular to the wave propagation with the character of a classical transverse shear wave. The vibrations induced by two adjacent point sources generate an interference pattern and present higher motion velocities than the vibrations from the single point source. The particle vibrations from the planar source are mostly in the axial direction of the force and parallel to the wave propagation, so the wave is a longitudinal shear wave.
The detection of a longitudinal shear wave can be conveniently used to measure the elastic modulus based on the theory of the classical shear wave. The shear modulus is quantified by tracking the shear wave propagation. In previous measurements of transverse shear waves, the shear wave propagates perpendicular to the force directions, so the shear modulus in the lateral region of the force can be quantified. The longitudinal shear wave propagates along the force direction, so the shear modulus in the axial region of the force can be quantified. Furthermore, combination of the detection of the transverse shear wave and the longitudinal shear wave provides opportunities for measurements of directionally dependent elastic properties in tissues.
In conclusion, we visualize longitudinal shear waves for elastic mapping using high-resolution OCE. The longitudinal shear wave travels through the interior of the sample where the propagation direction is parallel to the direction of force due to the sum contribution of vibrations. The visualization of waves propagating in two homogeneous phantoms and one heterogeneous side-by-side phantom shows that the longitudinal shear wave is present as a plane wave in the near field of a planar excitation source and can be used for the quantitative mapping of shear moduli. The finite element simulations validate the presence of a longitudinal shear wave. Complementary to previous elastic measurements in the direction perpendicular to the force direction using transverse shear wave detection, this system provides a method for the assessment of elastic properties along the force direction. Combining the transverse shear wave measurement and longitudinal shear wave measurement, the OCE system has great potential for the elastic assessment of an anisotropic sample.
See supplementary material for the simulation of the vibration during shear wave propagation inside the 0.5% agar phantom using finite element analysis.
Acknowledgments
This work was supported by grants from the National Institutes of Health (R01HL-125084, R01HL-127271, R01EY-026091, R01EY-021529, and P41EB-015890). Dr. Zhongping Chen has financial interest in OCT Medical Imaging, Inc., which, however, did not support this work.
References
- 1. Sarvazyan A. P., Rudenko O. V., Swanson S. D., Fowlkes J. B., and Emelianov S. Y., Ultrasound Med. Biol. 24, 1419 (1998). 10.1016/S0301-5629(98)00110-0 [DOI] [PubMed] [Google Scholar]
- 2. Friedrich-Rust M., Poynard T., and Castera L., Nat. Rev. Gastroenterol. Hepatol. 13, 402 (2016). 10.1038/nrgastro.2016.86 [DOI] [PubMed] [Google Scholar]
- 3. Evans A., Whelehan P., Thomson K., McLean D., Brauer K., Purdie C., Jordan L., Baker L., and Thompson A., Breast Cancer Res. 12, R104 (2010). 10.1186/bcr2787 [DOI] [PMC free article] [PubMed] [Google Scholar]
- 4. Qu Y., Ma T., He Y., Zhu J., Dai C., Yu M., Huang S., Lu F., Shung K. K., Zhou Q., and Chen Z., IEEE J. Sel. Top Quantum Electron. 22, 6803507 (2016). 10.1109/JSTQE.2016.2524618 [DOI] [PMC free article] [PubMed] [Google Scholar]
- 5. Carstensen E. L., Parker K. J., and Lerner R. M., Ultrasound Med. Biol. 34, 1535 (2008). 10.1016/j.ultrasmedbio.2008.03.002 [DOI] [PubMed] [Google Scholar]
- 6. Arda K., Ciledag N., Aktas E., Aribas B. K., and Köse K., Am. J. Roentgenol. 197, 532 (2011). 10.2214/AJR.10.5449 [DOI] [PubMed] [Google Scholar]
- 7. Bishop J., Poole G., Leitch M., and Plewes D. B., J. Magn. Reson. Imaging 8, 1257 (1998). 10.1002/jmri.1880080613 [DOI] [PubMed] [Google Scholar]
- 8. Xu X., Zhu J., and Chen Z., Sci. Rep. 6, 24294 (2016). 10.1038/srep24294 [DOI] [PMC free article] [PubMed] [Google Scholar]
- 9. Wang S. and Larin K. V., Opt. Lett. 39, 41 (2014). 10.1364/OL.39.000041 [DOI] [PMC free article] [PubMed] [Google Scholar]
- 10. Wang S., Lopez A. L., Morikawa Y., Tao G., Li J., Larina I. V., Martin J. F., and Larin K. V., Biomed. Opt. Express 5, 1980 (2014). 10.1364/BOE.5.001980 [DOI] [PMC free article] [PubMed] [Google Scholar]
- 11. Zhu J., Qu Y., Ma T., Li R., Du Y., Huang S., Shung K. K., Zhou Q., and Chen Z., Opt. Lett. 40, 2099 (2015). 10.1364/OL.40.002099 [DOI] [PMC free article] [PubMed] [Google Scholar]
- 12. Nguyen T. M., Song S., Arnal B., Huang Z., O'Donnell M., and Wang R. K., Opt. Lett. 39, 838 (2014). 10.1364/OL.39.000838 [DOI] [PMC free article] [PubMed] [Google Scholar]
- 13. Zhu J., Qi L., Miao Y., Ma T., Dai C., Qu Y., He Y., Gao Y., Zhou Q., and Chen Z., Sci. Rep. 6, 35499 (2016). 10.1038/srep35499 [DOI] [PMC free article] [PubMed] [Google Scholar]
- 14. Qi W., Li R., Ma T., Li J., Shung K. K., Zhou Q., and Chen Z., Appl. Phys. Lett. 103, 103704 (2013). 10.1063/1.4820252 [DOI] [PMC free article] [PubMed] [Google Scholar]
- 15. Qi W., Li R., Ma T., Kirk Shung K., Zhou Q., and Chen Z., Appl. Phys. Lett. 104, 123702 (2014). 10.1063/1.4869562 [DOI] [PMC free article] [PubMed] [Google Scholar]
- 16. Song S., Huang Z., Nguyen T. M., Wong E. Y., Arnal B., O'Donnell M., and Wang R. K., J. Biomed. Opt. 18, 121509 (2013). 10.1117/1.JBO.18.12.121509 [DOI] [PMC free article] [PubMed] [Google Scholar]
- 17. Yin M., Rouvière O., Glaser K. J., and Ehman R. L., Magn. Reson. Imaging 26, 770 (2008). 10.1016/j.mri.2008.01.019 [DOI] [PMC free article] [PubMed] [Google Scholar]
- 18. Catheline S., Thomas J. L., Wu F., and Fink M. A., IEEE Trans. Ultrason. Ferroelectr. Freq. Control 46, 1013 (1999). 10.1109/58.775668 [DOI] [PubMed] [Google Scholar]
- 19. Song S., Huang Z., and Wang R. K., J Biomed. Opt. 18, 121505 (2013). 10.1117/1.JBO.18.12.121505 [DOI] [PubMed] [Google Scholar]
- 20. Liu G., Chou L., Jia W., Qi W., Choi B., and Chen Z., Opt. Express 19, 11429 (2011). 10.1364/OE.19.011429 [DOI] [PMC free article] [PubMed] [Google Scholar]
- 21. Huang S., Piao Z., Zhu J., Lu F., and Chen Z., J. Biomed. Opt. 20, 76003 (2015). 10.1117/1.JBO.20.7.076003 [DOI] [PMC free article] [PubMed] [Google Scholar]
- 22. Cho Y., Zheng G., Augustine G., Hochbaum D., Cohen A., Knopfel T., Pisanello F., Pavone F., Vellekoop I., Booth M., Hu S., Zhu J., Chen Z., and Hoshi Y., J. Opt. 18, 093007 (2016). 10.1088/2040-8978/18/9/093007 [DOI] [PMC free article] [PubMed] [Google Scholar]
- 23. Qi L., Zhu J., Hancock A. M., Dai C., Zhang X., Frostig R. D., and Chen Z., Biomed. Opt. Express 7, 601 (2016). 10.1364/BOE.7.000601 [DOI] [PMC free article] [PubMed] [Google Scholar]
- 24. Liu G., Lin A. J., Tromberg B. J., and Chen Z., Biomed. Opt. Express 3, 2669 (2012). 10.1364/BOE.3.002669 [DOI] [PMC free article] [PubMed] [Google Scholar]
Associated Data
This section collects any data citations, data availability statements, or supplementary materials included in this article.
Supplementary Materials
See supplementary material for the simulation of the vibration during shear wave propagation inside the 0.5% agar phantom using finite element analysis.


