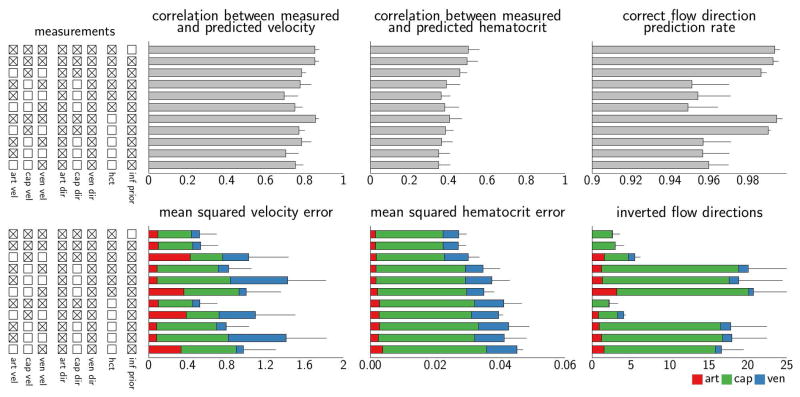
Figure 4.
Quantitative evaluation of the predictive performance in a series of calibration setups for the mesentery data set. Tick boxes (left column) indicate data available for model calibration. Metrics reported in the bottom row are decomposed into contributions from arterioles, capillaries, and venules. Error bars correspond to the standard deviation of the mean computed across the three networks. Note different scales in the plots.

