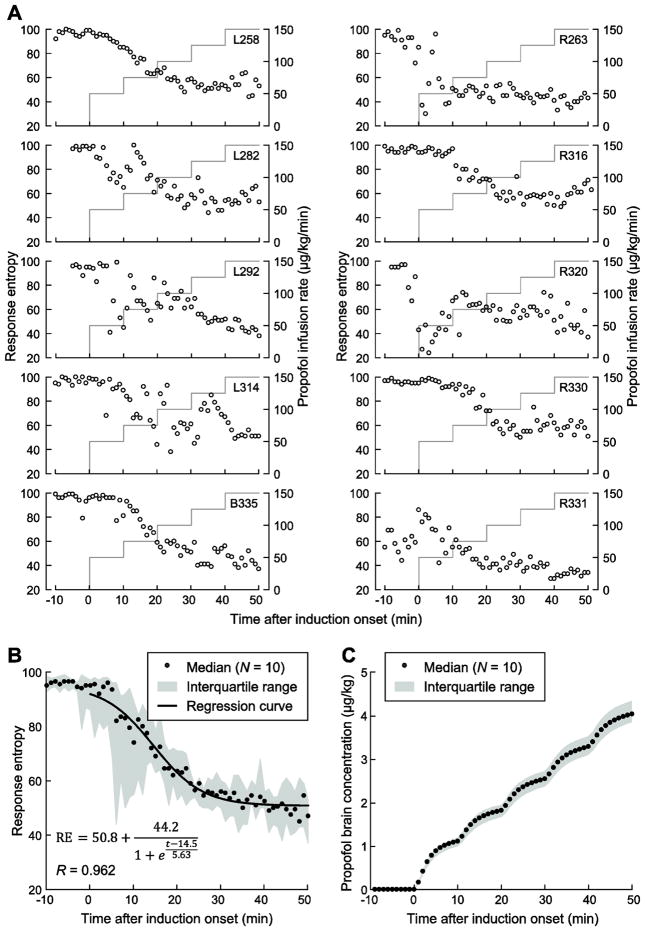
Figure 1.
Time course of propofol induction. A: Data from individual subjects. Propofol infusion rate (gray lines) and response entropy (RE; open circles) are plotted as functions of time after induction onset. B: Average time course of induction across all subjects. RE plotted as a function of time after induction onset. Median values are depicted as circles. Solid line represents sigmoidal regression curve fitted to the across-subject median RE values. C: Estimated propofol brain concentrations over the course of the experiment.

