

Abstract
Background
Massive transfusion protocols (MTPs) have become standard of care in the management of bleeding injured patients, yet strategies to guide them vary widely. We conducted a pragmatic, randomized clinical trial (RCT) to test the hypothesis that an MTP goal directed by the viscoelastic assay thrombelastography (TEG) improves survival compared with an MTP guided by conventional coagulation assays (CCA).
Methods
This RCT enrolled injured patients from an academic level-1 trauma center meeting criteria for MTP activation. Upon MTP activation, patients were randomized to be managed either by an MTP goal directed by TEG or by CCA (ie, international normalized ratio, fibrinogen, platelet count). Primary outcome was 28-day survival.
Results
One hundred eleven patients were included in an intent-to-treat analysis (TEG = 56, CCA = 55). Survival in the TEG group was significantly higher than the CCA group (log-rank P = 0.032, Wilcoxon P = 0.027); 20 deaths in the CCA group (36.4%) compared with 11 in the TEG group (19.6%) (P = 0.049). Most deaths occurred within the first 6 hours from arrival (21.8% CCA group vs 7.1% TEG group) (P = 0.032). CCA patients required similar number of red blood cell units as the TEG patients [CCA: 5.0 (2–11), TEG: 4.5 (2–8)] (P = 0.317), but more plasma units [CCA: 2.0 (0–4), TEG: 0.0 (0–3)] (P = 0.022), and more platelets units [CCA: 0.0 (0–1), TEG: 0.0 (0–0)] (P = 0.041) in the first 2 hours of resuscitation.
Conclusions
Utilization of a goal-directed, TEG-guided MTP to resuscitate severely injured patients improves survival compared with an MTP guided by CCA and utilizes less plasma and platelet transfusions during the early phase of resuscitation.
Keywords: coagulopathy, fibrinolysis, goal-directed, resuscitation, thrombelastography, transfusion
Injury is the second leading cause of death worldwide and the most common for individuals 15 to 49 years of age.1–3 The burden of injuries has decreased due to strategies such as injury prevention, advanced prehospital care, regionalized trauma systems, damage control operative techniques, advances in critical care medicine, and rehabilitation with reintegration into society.4,5 However, in both civilian and military trauma, uncontrolled bleeding remains the leading preventable cause of death, with as much as 40% of injury-related mortality due to hemorrhage.6–9 This is largely attributed to the exacerbation of bleeding by dysfunctional hemostasis. In 25 to 35% of patients with severe injury, this trauma-induced coagulopathy is already present upon arrival to the emergency department (ED).10,11
Traditionally, assessment of hemostasis in the injured has been made with conventional coagulation assays (CCA) such as the international normalized ratio (INR) of prothrombin time, partial thromboplastin time (PTT), platelet count, and fibrinogen concentration. Viscoelastic assays of hemostasis (VHA) such as thrombe-lastography (TEG) (Haemonetics Corp, Niles, IN) and rotational thrombelastometry (ROTEM) (TEM International, GmbH, Munich, Germany) have been introduced into trauma care as a single assay that characterizes the life-span of a clot; from time to initial fibrin cross-linking, maximal clot strength incorporating platelets and red blood cells (RBC), to clot breakdown by fibrinolysis.12
To prioritize correction of coagulopathy, institutional massive transfusion protocols (MTPs) have been developed to systematically deliver blood products to the patient’s bedside.13 MTPs rely on abnormal values of CCA as triggers for transfusion of plasma, cryoprecipitate, and platelet units.14 An alternative approach incorporates a VHA into MTPs to assess each stage of hemostasis, allowing for goal-directed treatment with blood products.
Methods of guiding MTPs vary widely among institutions,14,15 and an optimal approach to the hemostatic resuscitation of the severely injured patient has yet to be defined. Thus, we designed a randomized trial to compare the effect of an MTP goal directed by TEG to a standard MTP guided by CCA on the primary outcome of survival after injury.
METHODS
Study Design
This investigator-initiated, single center, pragmatic, randomized trial was performed at Denver Health Medical Center, an academic level-1 trauma center. Given the pragmatic character of the trial, rapid enrollment and randomization upon MTP activation required exception from informed consent for emergency research,16,17 which was approved by the local institutional review board as part of this study’s protocol (COMIRB #10-0477). Patients or their next of kin were informed about enrollment at the earliest feasible opportunity and could discontinue their participation at any time. An independent data and safety monitoring board oversaw the trial conduct and reviewed any suspected adverse events, but no interim analyses were planned.
Study Participants
Injured patients at least18 years of age that met criteria for MTP activation upon ED arrival during a 3-year period ending July 30, 2014, were enrolled in the study. MTP activation was based on the Resuscitation Outcome Consortium criteria18 [systolic blood pressure (SBP) <70 mm Hg or SBP 70–90 mm Hg with heart rate (HR) ≥108 beats/min], in addition to any of the following injury patterns: penetrating torso wound, unstable pelvic fracture, or abdominal ultrasound suspicious of bleeding in more than one region. Patients were not eligible if they were prisoners or pregnant; patients were removed from the study if these criteria became known after activation of the MTP.
Randomization
Using a traditional random-sequence system for each patient at the time of MTP activation could potentially delay care and lead to confusion because of the multidisciplinary personnel required to execute an MTP. In addition, several severely injured patients can present at the same time and are managed by the same clinicians. Thus, individual randomization was considered unsafe for this trial, and a process of randomization by weekly alternation of the 2 treatment modalities was devised. For example, patients enrolled during weeks 1 and 3 were in the CCA group, and those enrolled during weeks 2 and 4 in the TEG group. This predefined alternate week schedule continued until complete accrual and was not modified during the entire study period. Although unconventional, this randomization scheme has been used successfully in previous emergency research trials,19 when enrollment is time-sensitive and the interventions must be made available without any delay. This randomization approach is recognized as appropriate in emergency research because it affords each patient an equal chance of being given each experimental group, and the assignment cannot be predicted for injured patients.20,21
One of the major problems of sophisticated randomization schemes, especially in emergency research, is adherence to protocol. In this pragmatic trial, our goal was to evaluate how massive transfusion of injured patients is practiced in generalizable clinical scenarios. Thus, the study followed guidelines for emergency research to make the intervention simple, time-sensitive, and pragmatic for the clinician.22,23 No source of bias associated with this randomization method was identified.
Procedures
The coagulation assays, INR, PTT, fibrinogen, and D-dimer (Diagnostica Stago Inc, Parsippany, NJ) were performed on platelet poor plasma collected in citrated vacuum tubes, per routine clinical laboratory protocols. Platelet counts were available to both groups as part of the complete blood cell count. TEG (TEG-5000 Analyzer; Haemonetics Corp, Stoughton, MA) was performed on whole blood collected in vacuum tubes with no anticoagulant, and executed within 5 minutes from collection. This assay incorporates tissue factor to the whole blood sample immediately before test initiation to expedite results, also known as Rapid-TEG.
TEG yields the following variables: activated clotting time (ACT; the time to beginning of clot formation, seconds), angle (rate of clot strength increase, degrees), maximum amplitude (MA; maximal clot strength achieved, millimeters), and percent clot lysis 30 minutes after reaching MA (LY30, %). Studies have correlated ACT with coagulation factor activity and thrombin generation, angle with fibrinogen concentration and function, MA with platelet—fibrin interactions, and LY30 with fibrinolysis.12
Both groups had all tests performed (INR, PTT, fibrinogen, D-dimer, and TEG); however, managing clinicians only had access to the test(s) assigned to the study group and were blinded to the other tests. For example, during week 1, patients were enrolled in the CCA group; thus, the electronic medical record only reported the results of the CCA tests (INR, PTT, fibrinogen, D-dimer), blinding the managing clinicians to TEG results. Conversely, in week 2, patients were enrolled in the TEG group; the electronic medical record only reported TEG results, blinding the managing clinicians to CCA results. In order for each study group to reflect the clinicians’ best practice, they could override the blinding scheme at any time if they deemed the other tests necessary for patient care, in which case, all tests were made available. The research team, who had no input into patient care, collected all test results regardless of study group.
Upon activation of the MTP the blood bank delivered 4 units of type-O, Rh-negative, RBC units and 2 of type-A plasma units (fresh frozen plasma, plasma frozen in 24 h, or thawed plasma) to the patient’s bedside. This occurred regardless of randomization group, and these first units were administered according to the treating clinicians’ criteria while awaiting results of coagulation tests (CCA or TEG). Thus, the first units of RBC and plasma were administered according to the clinician’s practice regardless of randomization group.
In the CCA group, the following parameters triggered the following transfusions: INR equal or greater than 1.5 = 2 units of plasma; fibrinogen less than 150 mg/dL = 10-pack of cryoprecipitate; platelet count less than 100,000/μL = 1 unit of apheresis platelets. Antifibrinolytic medication (tranexamic acid, 1 g, intravenous) was administered in the setting of suspicion of fibrinolysis with an elevated D-dimer (>0.5 μg/mL). These thresholds for transfusion represent parameters that are considered standard of care based on published consensus guidelines.24–29 In general, CCA results are available approximately 30 to 45 minutes from collection.
In the TEG group, the first variables of this assay become available within 5 minutes as point-of-care. The first TEG variable reported is ACT; an elevated ACT (≥140 s) has been shown to correlate not only with need for plasma transfusion, but also to be predictive of the TEG variables angle and MA being abnormal, which in turn trigger transfusion of cryoprecipitate and platelets, respectively.30 Thus, those patients with a first measurement of ACT equal or greater than 140 seconds received 2 plasma units, 10-pack of cryoprecipitate, and 1 unit of apheresis platelets while awaiting results of angle and MA. If the ACT was 111 to 139, only 2 units of plasma were given. For subsequent TEGs, an ACT greater than 110 seconds triggered transfusion of 2 plasma units, angle less than 63 degrees a 10-pack of cryoprecipitate, MA less than 55 mm 1 apheresis platelet unit, and LY30 equal or greater than 7.5% administration of tranexamic acid (1 g, intravenous). Of note, after August 31, 2012 (61% of enrollment), the LY30 threshold for administration of tranexamic acid was lowered to equal or greater than 3% given emerging data demonstrating that this lower value correlated better with transfusion requirements and mortality.31,32 Our institution’s updated version (2015) of this MTP is provided as supplemental material, http://links.lww.com/SLA/A950.
For both treatment groups, tranexamic acid had to be administered within 3 hours from time of injury. RBC units were transfused in both groups to maintain a hemoglobin at least 10 g/dL while bleeding was ongoing. The MTP was stopped in both groups as clinically indicated, once control of bleeding was achieved and the patient was hemodynamically stable.
Outcomes
The primary outcome was 28-day survival. Preplanned analyses of secondary outcomes were blood product requirements in the first 2, 4, 6, 12, and 24 hours from time of injury, and mechanical ventilation time and intensive care unit (ICU) stay. The latter 2 were expressed as outcome-free days (ie, ventilator-free days and ICU-free days) to minimize survivor bias.33 Sepsis, acute kidney injury (AKI), organ failure, deep vein thrombosis (DVT), and pulmonary embolism were defined in accordance to criteria of the National Trauma Data Bank.34 Cause of death was ascribed by the attending physician based on clinical findings, and, when available, autopsy results.
Statistical Analysis
Power and sample size were calculated using PASS-11 software.35 A 30% death rate was estimated in the control group18; thus, a sample size of 122 patients would have 80% power to detect a minimum of 20% points difference in survival rate between the 2 groups with 95% confidence.
Categorical variables were expressed as frequency (%) and compared using the χ2 test, or the Fisher exact test for expected frequencies less than 5. Continuous variables were reported as median (interquartile range) and compared using the nonparametric Wilcoxon rank-sum test. Kaplan-Meyer curves were used to analyze survival, and compared using the log-rank test (privileges late survival) and the Wilcoxon test (privileges early survival). A Cox proportional hazards regression was conducted including hourly, cumulative plasma:RBC unit ratios in the first 6 hours after ED arrival as a time-varying covariate, and a robust sandwich estimate to account for the repeated, correlated data. Violations to the proportionality assumption were checked and remediated by including an interaction of the variable with time. All tests were 2-tailed and significance set at P < 0.05.
Randomization effectiveness was assessed by comparing demographic characteristics, injury mechanisms, anatomic injury severity [Injury Severity Score (ISS), New ISS (NISS)], and physiologic derangement upon ED arrival [SBP, HR, base deficit (BD)]. In accordance to the CONSORT guidelines, no P values were reported for baseline comparisons.36
Outcome analyses were conducted as “intent-to-treat” (ITT) and “as treated” (AT). Four patients were incorrectly enrolled: 3 were later found to be under guardianship, and 1 was later found to have presented with hypotension due to medical reasons and not an injury (CONSORT Diagram Figure, http://links.lww.com/SLA/A950). The modified ITT excluded 7 patients who died within 30 minutes from arrival without receiving blood products or having any initial laboratory assessments, in accordance to the usual de-randomization process for emergency research21 (CONSORT Diagram Figure, http://links.lww.com/SLA/A950). The AT analysis was performed considering patients reallocated to the TEG or CCA groups if the attending physician terminated blinding and had access to the test to which they were originally blinded to by the randomization schedule.
Coagulation assays were obtained at the earliest feasible opportunity upon ED arrival to define baseline characteristics, and from then on as dictated for treatment by the clinician and not at predetermined time points; thus, there were no “missing” data. The time points for analysis were artificially set from time of injury at 2 hours, 2.1 to 4.0, 4.1 to 6.0, 6.1 to 12.0, and 12.1 to 24.0 hours; test values within these test values within these time intervals were analyzed.
Analyses were conducted using SAS versus 9.3 for Windows (SAS Institute Inc, Cary, NC).
RESULTS
Patient enrollment in this trial is depicted in the CONSORT Diagram Figure; http://links.lww.com/SLA/A950. Data were analyzed for 111 eligible, exposed patients: 55 in the CCA group and 56 in the TEG group. The study cohort had a median age of 39 years (28–53), ISS of 30 (24–43), NISS of 43 (29–57), arrival SBP of 92.0 mm Hg (78–110), arrival BD of 12.0 mEq/L (9–18), 67.6% had a blunt injury mechanism, and 18.9% presented with a severe traumatic brain injury (TBI) (defined as Glasgow Coma Scale <8 and head Abbreviated Injury Severity score >2). The median RBC transfusion requirement in the first 6 and 12 hours were 8 (5–16) and 10 (6–16) units, respectively. The overall mortality was 27.9%. The 2 groups were similar regarding demographics, injury severity (anatomic and physiologic), clinical, laboratory, and coagulation characteristics upon arrival to the ED, suggesting that randomization was effective (Table 1).
TABLE 1.
Baseline Patient Characteristics of Intention-to-treat Population—Vital Signs, Laboratory, and Coagulation assays Collected Upon ED Arrival
| Characteristic | CCA Group (N = 55)
|
TEG Group (N = 56)
|
||
|---|---|---|---|---|
| Median | IQR | Median | IQR | |
| Demographic data | ||||
| Age, yrs | 38.0 | 25–53 | 41.0 | 28–54 |
| Male sex, no. (%) | 41 (74.5) | 37 (66.0) | ||
| BMI, kg/m2 | 25.5 | 23–30 | 25.9 | 23–31 |
| Time from injury to ED, min | 29.0 | 21–72 | 35.5 | 23–94 |
| Injury severity (anatomic) | ||||
| ISS | 33.0 | 25–43 | 29.5 | 23–41 |
| NISS | 43.0 | 34–57 | 41.0 | 29–50 |
| Blunt mechanism, no. (%) | 36 (65.4) | 39 (69.6) | ||
| Severe TBI (AIS head >2 and GCS <8), no. (%) | 12 (21.8) | 9 (16.0) | ||
| Injury severity (physiologic) (characteristics on ED arrival) | ||||
| ABC score | 2.0 | 1–3 | 2.0 | 1–2 |
| TASH score | 12.0 | 9–17 | 13.0 | 9–15 |
| GCS | 14.0 | 3–15 | 14.5 | 6–15 |
| SBP, mm Hg | 90.0 | 76–110 | 97.0 | 78–120 |
| HR, beats/min | 112.5 | 94–134 | 107.5 | 90–123 |
| Temperature, °C | 36.2 | 35–37 | 36.5 | 35–37 |
| pH | 7.20 | 7.0–7.3 | 7.21 | 7.1–7.2 |
| Base deficit, mEq/L | 13.7 | 9–18 | 11.0 | 9–16 |
| Lactate, mmol/L | 5.4 | 3.9–7.9 | 6.9 | 3.8–7.6 |
| Hemoglobin, g/dL | 11.8 | 9.6–13.3 | 12.3 | 10.5–13.6 |
| Platelet count/mm3 | 214.5 | 165–279 | 214.5 | 145–318 |
| Creatinine, mg/dL | 1.2 | 0.9–1.5 | 1.1 | 1.0–1.3 |
| Calcium, mg/dL | 6.9 | 6.3–8.1 | 7.0 | 6.4–7.8 |
| Initial coagulation assessments upon ED arrival | ||||
| TEG-ACT, s | 130.0 | 113–178 | 128.0 | 113–140 |
| TEG-angle, degrees | 50.9 | 28–69 | 52.3 | 30–70 |
| TEG-MA, mm | 47.5 | 34–53 | 53.9 | 28–63 |
| TEG-LY30, % of clot lysis | 0.5 | 0–4.4 | 1.2 | 0.1–20 |
| INR | 1.46 | 1.2–2.3 | 1.45 | 1.2–1.7 |
| PTT, s | 38.5 | 27–52 | 32.1 | 27–39 |
| Fibrinogen, g/dL | 113.0 | 68–139 | 132.1 | 94–220 |
| D-dimer, g/dL | 12.9 | 6–20 | 10.3 | 2–20 |
Continuous values expressed in median (interquartile range, IQR), categorical characteristics expressed in number (no.) and percent (%).
ABC score indicates assessment of blood consumption score; ACT, activated clotting time; BMI, body mass index (expressed in kg/m2); ED, emergency department; GCS, Glasgow coma scale; HR, heart rate; INR, international normalized ratio; ISS, injury severity score; LY30, % clot lysis 30 minutes after reaching MA; MA, maximum amplitude; NISS, new injury severity score; PTT, partial thromboplastin time; SBP, systolic blood pressure; TASH score, trauma-associated severe hemorrhage score; TBI, traumatic brain injury; TEG, thrombelastography.
Twenty-eight-day survival in the TEG group was significantly higher than the CCA group (log-rank P = 0.032, Wilcoxon P = 0.027), as depicted in Figure 1. A Cox proportional hazards model demonstrated a statistically significant higher risk of death in the CCA group than the TEG group [hazard ratio = 2.17 (95% confidence interval, 1.034–4.576); P = 0.043]. Table 2 depicts distribution and timing of deaths. In the CCA group, 20 deaths occurred (36.4%), compared with 11 deaths in the TEG group (19.6%) (P = 0.049). Most deaths occurred within the first 6 hours from ED arrival; 12 deaths in the CCA group (21.8%), compared with 4 deaths in the TEG group (7.1%) (P = 0.032). Median time to death from ED arrival was 4.2 hours (1.2–9.9) in the CCA group, compared with 10.4 hours (4.5–200.3) in the TEG group (P = 0.181). Hemorrhagic deaths occurred in 20% of patients in the CCA group compared with 8.9% of patients in the TEG group (P = 0.110).
FIGURE 1.
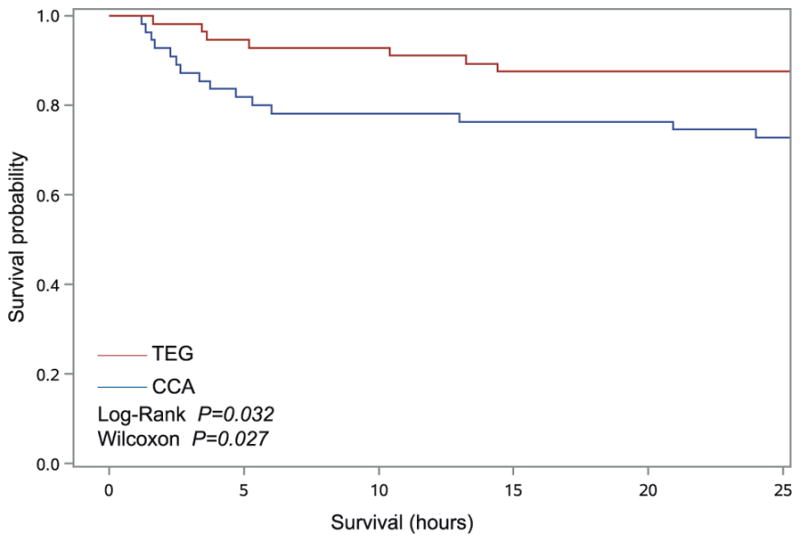
Kaplan-Meier estimates of survival by randomization group for patients analyzed as intention-to-treat. Survival in the TEG group was significantly higher than the CCA group (log-rank P = 0.0324, Wilcoxon P = 0.0275).
TABLE 2.
Outcome of Mortality Stratified by Study Group
| Intention to Treat
|
P | ||
|---|---|---|---|
| CCA (N = 55) | TEG (N = 56) | ||
| Deaths, no. (% within group) | 20 (36.4) | 11 (19.6) | 0.049 |
| Time to death in hours from ED arrival, median (IQR) | 4.2 (2.4–9.9) | 10.4 (4.5–200.3) | 0.181 |
| Deaths occurring in the first 6 hours from ED arrival, no. (% within group) | 12 (21.8) | 4 (7.1) | 0.032 |
| Deaths occurring >6 h from ED arrival, no. (% within group) | 8 (14.5) | 7 (12.5) | 0.785 |
| Hemorrhagic deaths, no. (% within group) | 11 (20.0) | 5 (8.9) | 0.110 |
| TBI deaths, no. (% within group) | 6 (10.9) | 4 (7.1) | 0.537 |
| Organ failure, no. (% within group) | 3 (5.5) | 2 (3.6) | 0.675 |
|
| |||
|
As Treated
|
|||
| CCA (N = 47) | TEG (N = 64) | P | |
| Deaths, no. (% within group) | 19 (40.4) | 12 (18.7) | 0.011 |
| Time to death in hours, median (IQR) | 3.5 (2.2–8.3) | 11.5 (4.9–211.0) | 0.073 |
| Deaths occurring in the first 6 hours from ED arrival, no. (% within group) | 11 (23.4) | 4 (6.2) | 0.010 |
| Deaths occurring >6 h from ED arrival, no. (% within group) | 8 (17.0) | 8 (12.5) | 0.589 |
| Hemorrhagic deaths, no. (% within group) | 11 (23.4) | 5 (7.8) | 0.020 |
| TBI deaths, no. (% within group) | 6 (12.8) | 4 (6.3) | 0.321 |
| Organ failure, no. (% within group) | 2 (4.3) | 3 (4.7) | 1.00 |
ED indicates emergency department; IQR, interquartile range; TBI, traumatic brain injury.
In 8 CCA patients, the treating physician requested unblinding of TEG results to guide management. In this AT analysis (47 patients allocated to the CCA group and 64 to the TEG group), the survival difference widened, privileging TEG-managed patients (log-rank P = 0.003, Wilcoxon P = 0.002) (Fig. 2); 40.4% died in the CCA group, compared with 18.7% in the TEG group (P = 0.011) (Table 2). The difference in deaths due to hemorrhage, 23.4% in the CCA group compared with 7.8% in the TEG group, was significantly greater in this “as treated” analysis (P = 0.020) (Table 2).
FIGURE 2.

Kaplan-Meier estimates of survival by randomization group for patients analyzed as treated. Survival in the TEG group was significantly higher than the CCA group (log-rank P = 0.0039, Wilcoxon P = 0.0029).
Deaths due to TBI and organ failure did not differ significantly between the 2 groups, both in the ITT and AT analyses (Table 2). Baseline characteristics of demographics, injury severity, and coagulation assays (ED arrival) of nonsurvivors were similar between the 2 study groups (Table 3). No harmful or unintended effects resulting from the intervention were reported.
TABLE 3.
Baseline Characteristics of Nonsurvivors Stratified by Study Group—Vital Signs, Laboratory, and Coagulation Assays Collected Upon ED arrival
| Characteristic | CCA (N = 20)
|
TEG (N = 11)
|
P | ||
|---|---|---|---|---|---|
| Median | IQR | Median | IQR | ||
| Demographic data | |||||
| Age, yrs | 40.3 | 32–57 | 56.8 | 38–63 | 0.172 |
| Male sex, no. (%) | 13 (65.0) | 9 (81.8) | 0.420 | ||
| BMI, kg/m2 | 26.5 | 24–34 | 29.5 | 22–36 | 0.837 |
| Time from injury to ED, min | 28.0 | 21–77 | 26.1 | 20–70 | 0.829 |
| Injury severity (anatomic) | |||||
| ISS | 37.5 | 33–45 | 47.5 | 22–59 | 0.314 |
| NISS | 45.5 | 39–57 | 54.5 | 29–66 | 0.354 |
| Blunt mechanism, no. (%) | 15 (75.0) | 9 (81.2) | 1.00 | ||
| Severe TBI (AIS head >2 and GCS <8), no. (%) | 5 (25.0) | 4 (36.4) | 0.687 | ||
| Injury severity (physiologic) (characteristics on ED arrival) | |||||
| ABC score | 2.0 | 1–3 | 2.0 | 1–3 | 1.00 |
| TASH score | 14.0 | 8–17 | 15.0 | 9–17 | 0.917 |
| GCS | 7.0 | 3–14 | 6.5 | 3–13 | 0.703 |
| SBP, mm Hg | 89.0 | 40–100 | 90.0 | 38–102 | 0.949 |
| HR, beats/min | 112.5 | 75–133 | 109.0 | 71–130 | 0.843 |
| Temperature, °C | 36.1 | 35.0–37.1 | 36.0 | 35.0–36.8 | 0.899 |
| pH | 7.19 | 6.9–7.3 | 7.11 | 6.9–7.2 | 0.419 |
| Base deficit, mEq/L | 17.5 | 9–20 | 15.0 | 8–19 | 0.323 |
| Lactate, mmol/L | 8.8 | 2–14 | 8.2 | 2–12 | 0.679 |
| Hemoglobin, g/dL | 11.3 | 8–12 | 12.7 | 6–13 | 0.744 |
| Platelet count/mm3 | 200.5 | 120–240 | 144.0 | 117–157 | 0.099 |
| Creatinine, mg/dL | 1.2 | 0.9–1.4 | 1.3 | 1.0–1.5 | 0.662 |
| Calcium, mg/dL | 6.8 | 5.8–7.9 | 6.9 | 5.7–8.7 | 0.801 |
| Initial coagulation assessments (characteristics on ED arrival) | |||||
| TEG-ACT, s | 202.5 | 140–220 | 220.0 | 160–240 | 0.271 |
| TEG-angle, degrees | 49.0 | 30–59 | 44.0 | 30–53 | 0.784 |
| TEG-MA, mm | 47.1 | 31–49 | 41.7 | 26–47 | 0.596 |
| TEG-LY30, % of clot lysis | 4.1 | 2.9–7.7 | 4.5 | 2.8–12.8 | 0.794 |
| INR | 2.1 | 1.3–3.0 | 2.0 | 1.2–2.5 | 0.495 |
| PTT, s | 49.4 | 39–70 | 44.2 | 38–60 | 0.284 |
| Fibrinogen, g/dL | 84.5 | 69–147 | 94.7 | 75–151 | 0.951 |
| D-dimer, g/dL | 14.7 | 9–25 | 19.0 | 11–31 | 0.355 |
ABC score indicates assessment of blood consumption score; ACT, activated clotting time; BMI, body mass index (expressed in kg/m2); ED, emergency department; GCS, Glasgow coma scale; HR, heart rate; ISS, injury severity score; LY30, % clot lysis 30 minutes after reaching MA; MA, maximum amplitude; NISS, new injury severity score; SBP, systolic blood pressure; TASH score, trauma-associated severe hemorrhage score; TBI, traumatic brain injury; TEG, thrombelastography.
Table 4 depicts the amount of crystalloid and blood transfusions given by group. The amounts of administered crystalloid and RBC units at 2, 4, 6, 12, and 24 hours from time of injury were similar between the 2 groups. During the initial 2 hours of resuscitation, CCA patients required similar number of RBC units as the TEG patients [CCA: 5.0 (2–11), TEG: 4.5 (2–8); P = 0.317], but more plasma units [CCA: 2.0 (0–4), TEG: 0.0 (0–3); P = 0.022], and more platelets units [CCA: 0.0 (0–1), TEG: 0.0 (0–0); P = 0.041]. This resulted in a significantly higher plasma:RBC and platelet:RBC unit ratio among CCA membership patients than those in the TEG group for the corresponding time points (Table 4). More cryoprecipitate was used cumulatively at 24 hours in the CCA group [CCA: 1.0 (0–2), TEG: 0.0 (0–2); P = 0.040] (Table 4). The use of tranexamic acid did not differ significantly between the 2 groups (Table 4). Mortality of the 13 patients who received tranexamic acid was not significantly different when compared between the 2 groups (supplemental material, http://links.lww.com/SLA/A950).
TABLE 4.
Blood Product Use and Coagulation Assessments Stratified by Study Group and Time—Time Points Calculated Form Time of Injury
| Cumulative Requirements | CCA Group (N = 55)
|
TEG Group (N = 56)
|
P | ||||
|---|---|---|---|---|---|---|---|
| N | Median | IQR | N | Median | IQR | ||
| RBC (units) | |||||||
| At 2 h | 55 | 5.0 | 2–11 | 56 | 4.5 | 2–8 | 0.317 |
| At 4 h | 48 | 8.0 | 4–14 | 55 | 6.0 | 4–13 | 0.434 |
| At 6 h | 45 | 8.0 | 5–15 | 53 | 8.0 | 4–14 | 0.716 |
| At 12 h | 42 | 10.5 | 6–15 | 50 | 9.5 | 5–16 | 0.496 |
| At 24 h | 40 | 11.0 | 6–16 | 48 | 9.5 | 5–16 | 0.413 |
| Plasma (units) | |||||||
| At 2 h | 55 | 2.0 | 0–4 | 56 | 0.0 | 0–3 | 0.022 |
| At 4 h | 48 | 4.0 | 0–6 | 55 | 2.0 | 0–5 | 0.044 |
| At 6 h | 45 | 5.0 | 2–8 | 53 | 4.0 | 2–6 | 0.305 |
| At 12 h | 42 | 6.0 | 4–8 | 50 | 5.0 | 3–8 | 0.533 |
| At 24 h | 40 | 6.0 | 4–9 | 48 | 5.0 | 3–9 | 0.509 |
| Cryoprecipitate (10-pack = 1 unit) | |||||||
| At 2 h | 55 | 0.0 | 0–0 | 56 | 0.0 | 0–0 | 0.533 |
| At 4 h | 48 | 0.0 | 0–1 | 55 | 0.0 | 0–0 | 0.841 |
| At 6 h | 45 | 0.0 | 0–2 | 53 | 0.0 | 0–2 | 0.473 |
| At 12 h | 42 | 1.0 | 0–2 | 50 | 0.0 | 0–2 | 0.121 |
| At 24 h | 40 | 1.0 | 0–2 | 48 | 0.0 | 0–2 | 0.040 |
| Platelets (units) | |||||||
| At 2 h | 55 | 0.0 | 0–1 | 56 | 0.0 | 0–0 | 0.041 |
| At 4 h | 48 | 0.0 | 0–1 | 55 | 0.0 | 0–1 | 0.981 |
| At 6 h | 45 | 1.0 | 0–1 | 53 | 1.0 | 0–2 | 0.925 |
| At 12 h | 42 | 1.0 | 0–2 | 50 | 1.0 | 0–2 | 0.539 |
| At 24 h | 40 | 1.0 | 0–2 | 48 | 1.0 | 0–2 | 0.934 |
| Plasma:RBC ratio (units) | |||||||
| At 2 h | 55 | 0.3 | 0–0.5 | 56 | 0 | 0–0.3 | 0.022 |
| At 4 h | 48 | 0.4 | 0–0.5 | 55 | 0.2 | 0–0.4 | 0.025 |
| At 6 h | 45 | 0.5 | 0.3–0.6 | 53 | 0.4 | 0.2–0.8 | 0.871 |
| At 12 h | 42 | 0.5 | 0.3–0.7 | 50 | 0.5 | 0.3–0.9 | 0.568 |
| Platelet:RBC ratio (units) | |||||||
| At 2 h | 55 | 0 | 0–0.1 | 56 | 0 | 0–0 | 0.026 |
| At 4 h | 48 | 0 | 0–0.1 | 55 | 0 | 0–0.1 | 0.783 |
| At 6 h | 45 | 0.1 | 0–0.1 | 53 | 0.1 | 0–0.1 | 0.984 |
| At 12 h | 42 | 0.1 | 0–0.1 | 50 | 0.1 | 0–0.2 | 0.225 |
| Intravenous crystalloids (mL) | |||||||
| At 2 h | 55 | 3800 | 3000–5100 | 56 | 3750 | 1000–10,000 | 0.596 |
| At 4 h | 50 | 6700 | 4750–8500 | 53 | 6000 | 2000–23,000 | 0.914 |
| At 6 h | 50 | 8000 | 5000–9683 | 52 | 8000 | 3000–29,000 | 0.506 |
| At 12 h | 42 | 11,738 | 8900–14,100 | 50 | 11,026 | 5300–31,600 | 0.197 |
| At 24 h | 40 | 14,239 | 10,533–17,613 | 48 | 13,420 | 6363–33,000 | 0.208 |
| Antifibrinolytic used, no. (% within group) | 111 | 9 (16.4) | 4 (7.1) | 0.154 | |||
|
| |||||||
| Coagulation assessment | |||||||
|
| |||||||
| TEG-ACT | |||||||
| At 2 h | 40 | 134.0 | 130–233 | 36 | 128.0 | 112–199 | 0.523 |
| 2.1–4 h | 45 | 120.0 | 130–169 | 41 | 128.0 | 121–171 | 0.755 |
| 4.1–6 h | 39 | 124.0 | 113–142 | 52 | 121.0 | 117–144 | 0.948 |
| 6.1–12 h | 42 | 128.0 | 121–144 | 52 | 121.0 | 113–140 | 0.593 |
| 12.1–24 h | 41 | 128.0 | 121–128 | 51 | 128.0 | 121–136 | 0.931 |
| TEG-angle | |||||||
| At 2 h | 40 | 63.9 | 37–68 | 36 | 66.1 | 46–74 | 0.343 |
| 2.1–4 h | 45 | 57.5 | 44–68 | 41 | 64.9 | 53–69 | 0.637 |
| 4.1–6 h | 39 | 70.8 | 64–72 | 52 | 68.2 | 60–73 | 0.901 |
| 6.1–12 h | 43 | 68.5 | 60–70 | 52 | 65.5 | 57–73 | 0.451 |
| 12.1–24 h | 42 | 69.1 | 61–71 | 51 | 71.3 | 64–74 | 0.109 |
| TEG-MA | |||||||
| At 2 h | 40 | 46.2 | 32–57 | 36 | 49.1 | 38–56 | 0.294 |
| 2.1–4 h | 45 | 40.1 | 29–54 | 41 | 45.3 | 42–55 | 0.972 |
| 4.1–6 h | 39 | 53.8 | 49–59 | 52 | 51.0 | 46–57 | 0.858 |
| 6.1–12 h | 43 | 55.0 | 52–57 | 52 | 56.9 | 49–58 | 0.598 |
| 12.1–24 h | 42 | 56.5 | 46–61 | 51 | 56.9 | 54–61 | 0.605 |
| TEG-LY30 | |||||||
| At 2 h | 46 | 0.9 | 0–1.3 | 46 | 0.6 | 0–9 | 0.449 |
| 2.1–4 h | 45 | 0.4 | 0.1–1.2 | 41 | 0.1 | 0–5 | 0.313 |
| 4.1–6 h | 39 | 0.0 | 0–0 | 52 | 0.0 | 0–1.5 | 0.852 |
| 6.1–12 h | 43 | 0.3 | 0–0.5 | 52 | 0.1 | 0.1–1.5 | 0.303 |
| 12.1–24 h | 42 | 0.7 | 0.2–1.5 | 51 | 0.7 | 0.7–1.7 | 0.737 |
| INR | |||||||
| At 2 h | 51 | 2.1 | 1.6–3.9 | 51 | 1.8 | 1.5–2.3 | 0.082 |
| 2.1–4 h | 50 | 2.8 | 1.5–4.2 | 46 | 1.9 | 1.7–3.0 | 0.811 |
| 4.1–6 h | 43 | 1.5 | 1.3–2.2 | 47 | 1.8 | 1.3–2.1 | 0.580 |
| 6.1–12 h | 44 | 1.4 | 1.2–1.6 | 50 | 1.4 | 1.3–1.9 | 0.627 |
| 12.1–24 h | 43 | 1.5 | 1.4–1.7 | 51 | 1.4 | 1.3–2.0 | 0.554 |
| Fibrinogen | |||||||
| At 2 h | 36 | 109.0 | 62–164 | 33 | 114.0 | 82–139 | 0.278 |
| 2.1–4 h | 42 | 101.4 | 62–159 | 43 | 102.0 | 67–129 | 0.782 |
| 4.1–6 h | 39 | 161.5 | 112–175 | 45 | 153.0 | 111–180 | 0.918 |
| 6.1–12 h | 44 | 185.5 | 159–232 | 48 | 159.0 | 111–214 | 0.717 |
| 12.1–24 h | 43 | 233.0 | 218–256 | 49 | 203.0 | 150–266 | 0.714 |
| Platelet count | |||||||
| At 2 h | 54 | 139.0 | 72–218 | 56 | 160.0 | 81–249 | 0.324 |
| 2.1–4 h | 51 | 96.0 | 61–145 | 48 | 99.0 | 70–143 | 0.978 |
| 4.1–6 h | 43 | 90.0 | 60–144 | 52 | 100.0 | 89–140 | 0.295 |
| 6.1–12 h | 39 | 116.0 | 75–157 | 47 | 110.0 | 90–139 | 0.342 |
| 12.1–24 h | 39 | 96.5 | 72–128 | 46 | 109.0 | 91–130 | 0.168 |
| D-dimer | |||||||
| At 2 h | 35 | 5.6 | 1–18 | 33 | 6.9 | 2–15 | 0.155 |
| 2.1–4 h | 39 | 8.2 | 1–19 | 40 | 7.4 | 2–15 | 0.261 |
| 4.1–6 h | 33 | 8.3 | 1–15 | 42 | 8.7 | 2–13 | 0.938 |
| 6.1–12 h | 42 | 8.0 | 2–13 | 48 | 6.4 | 3–13 | 0.752 |
| 12.1–24 h | 42 | 5.4 | 2–13 | 48 | 5.0 | 3–13 | 0.707 |
ACT indicates activated clotting time; INR, international normalized ratio; IQR, interquartile range; LY30, % clot lysis 30 minutes after reaching MA; MA, maximum amplitude; PTT, partial thromboplastin time; RBC, red blood cells; TEG, thrombelastography.
In an attempt to explain the effect of blood products on mortality, the effect of plasma:RBC unit ratio was studied as a time-varying covariate in the first 6 hours using Cox proportional hazards regression, adjusting for injury severity (NISS) and age. TEG group membership was shown to modify the effect of plasma:RBC ratio on mortality (interaction between study group and time-varying plasma:RBC unit ratio in the first 6 hours, P = 0.027). As illustrated in Figure 3, a higher plasma:RBC unit ratio was associated with lower predicted survival in the TEG group, whereas in the CCA group a trend was observed toward higher survival (interaction between group and plasma:RBC unit ratio P = 0.027). This suggests that TEG-guided treatment allowed for more judicious use of blood products. In the AT analysis, similar results were observed (interaction P = 0.046).
FIGURE 3.

Survival curves for different plasma:RBC ratios in the TEG and CCA groups, controlling for injury severity and age (median NISS = 43; age = 38 yrs).
There were no significant differences in INR, PTT, fibrinogen, platelet count, D-dimer, and viscoelastic TEG variables between the TEG and CCA groups at the time-intervals studied (Table 4).
Patients in the TEG group had more ICU-free days than those in the CCA group, with 16 days (0–22) in the TEG group compared with 8.5 days (0–19.5) in the CCA group (P = 0.091), and more ventilator-free days, with 18 days (0–25) in the TEG group compared with 13 days (0–22) in the CCA group (P = 0.082); these differences were not statistically significant. The groups had similar rates of sepsis (CCA 5.5% vs TEG 3.6%, P = 0.688), AKI (CCA 25.5% vs TEG 23.2%, P = 0.823), as well as DVT (CCA 10.9% vs TEG 14.3%, P = 0.599) and pulmonary embolism (CCA 0 vs TEG 1.8%, P = 1.01).
DISCUSSION
This study was conceived to trial a strategy that could further decrease the burden of injuries by targeting hemorrhage. The trial demonstrated that an MTP goal directed by TEG resulted in a survival benefit compared with guidance based on CCA (ie, INR, platelet count, fibrinogen concentration). This survival benefit resulted from less hemorrhagic deaths and less early deaths occurring in the TEG group compared with the CCA group (Table 2). An MTP based on CCA led to more plasma and platelets transfused in the early phase of resuscitation, and more cryoprecipitate overall, when compared with guidance with TEG; however, this did not result in improvement of coagulation assays in the CCA group compared with the TEG group for the corresponding time points (Table 4), suggesting more blood product utilization does not necessarily result in a hemostatic advantage. Although the survival benefit was attributable to the first 6 hours from ED arrival, survivors in the TEG-guided MTP group also benefited from more ICU-free and ventilator-free days.
These findings emerge as MTPs are now considered standard of care in trauma centers.13,14 However, in the context of current evidence, disparate strategies to guide MTPs exist.14,15 Although a retrospective study comparing a TEG-guided MTPs to a historic cohort supports the use of TEG to guide MTPs,37 this has not been prospectively validated. Recently, the State of the Science in Transfusion Medicine Working Groups, sponsored by the National Heart, Lung, and Blood Institute, identified those research questions that could transform the clinical practice of transfusion medicine in the next 10 years.38 One of these questions was whether use of a viscoelastic assay (ie, TEG and TEM) to guide transfusion improves outcomes when compared with traditional coagulation testing (ie, INR, PTT, platelet count, fibrinogen level).
In our current study, the TEG group had a significant improvement in survival at 28 days and at 6 hours from injury (Table 2) while using less plasma and platelets in the early phase of resuscitation compared with the CCA group (Table 4). A proposed alternative to goal-directed guidance of MTPs has been ratio-based transfusion.39 When using such formulaic approach, it remains unclear at what point administration of higher plasma and platelet to RBC ratios is no longer beneficial40,41 and can lead to unnecessary use of blood products; particularly because the same ratio of blood products is given to every patient, at every time point in the MTP.39,42 Recent characterization of 2 distinct phenotypes of trauma-induced coagulopathy by principal component analyses of coagulation proteins and viscoelastic TEG variables43,44 has called for a more individualized approach.
In our study, the CCA group had more plasma and platelets transfused during the first 4 and 2 hours of resuscitation, respectively, resulting in a significantly higher plasma and platelet to RBC unit ratio than the TEG group (Table 4). Increasing the amount of plasma and platelet transfusion does not necessarily translate into a survival benefit, as demonstrated by a recent randomized trial in which more plasma and platelets were given to severely injured patients by increasing the ratio of plasma to platelet to RBC transfusion from 1:1:2 to 1:1:1, with no significant difference in the study’s primary outcome of mortality.42
Although there were no major differences in the overall volume of blood products transfused at 24 hours (except for cryoprecipitate—more used in the CCA group), the 2 strategies trialled differed in the amount of plasma and platelet units delivered early in the resuscitation phase (Table 4), which is when the survival benefit occurred; in other words, administration of blood product when it was not needed or not administering it when it was. The effect of this trial may not be related to the amount of blood product given but to the importance of giving the appropriate treatment at the optimal time.
Despite this difference in the amount of hemostatic blood products delivered early in the resuscitation phase, the 2 groups were managed similarly regarding crystalloid administration and RBC transfusion at every time point (Table 4). This suggests 2 things: that the 2 groups were similar in terms of severity of injury and bleeding at baseline, and that the studied intervention only influenced the clinicians’ care regarding hemostatic blood products and not other aspects of resuscitation.
Certainly, the implications of plasma and platelet transfusion on the development of organ dysfunction after trauma have been well documented,45 and could explain the more ICU-free and ventilator-free days seen in the TEG group. Although the groups did not differ in the incidence of organ failure, a type-2 error is possible given the small subgroup sample.
It is important to underscore the pragmatic character of this trial. It was not designed to test one coagulation assay against the other head-to-head; they are obviously different (eg, the time to delivery of results varies widely between assays). Rather, it was designed to represent how clinicians deliver care in 2 real-world clinical scenarios: a trauma center that only has CCA available to guide an MTP, and a trauma center that has TEG available to guide an MTP. There were no prespecified time points at which clinicians had to deliver transfusions or obtain an assay. The findings of this study reflect not a research protocol, rather the clinicians’ best practice (including that of the multidisciplinary team of health care providers that execute an MTP) in a standard of care environment where only one thing was controlled—the results of the coagulation assay they could view. This pragmatic design makes the study’s findings generalizable.23,46
Despite the similarity in demographics, injury severity, coagulopathy score, and coagulation assays upon ED arrival between the study groups, it is possible that the 2 groups differ regarding unmeasured variables and that the increased mortality seen in the CCA group could be explained by greater risk of death. Yet, the “as-treated” analysis confirmed the survival benefit detected in the ITT analysis, with less hemorrhagic deaths in those who were initially in the CCA group but crossed over to the TEG group (Table 2). Regarding the randomization scheme used, although unconventional, it has been used successfully in previous emergency research clinical trials19; nevertheless, randomization is deemed effective when the studied groups are similar at baseline, as shown in Table 1.
This trial demonstrates that a goal-directed, TEG-guided MTP improves survival after injury and promotes appropriate use of hemostatic blood products while favorably impacting ICU stay and mechanical ventilation time. These findings support individualized hemostatic resuscitation of trauma patients by tailoring of MTPs to the dynamic biology of hemostasis.
Supplementary Material
Acknowledgments
Funding: Support was provided in the way of laboratory reagents by Haemonetics Inc, which had no role in the study design, data collection, data analysis, data interpretation of the study, or preparation of this manuscript. The investigators requested this support after the study was initially conceived. Haemonetics Inc provided no salary or financial compensation to any of the authors or managing physicians. Funding by National Institute of General Medical Sciences and National Heart, Lung, and Blood Institute.
The authors thank the ongoing support of the National Institute of General Medical Sciences grant P50 GM049222 and T32 GM008315-21, and National Heart, Lung, and Blood Institute grant UM1 HL120877, and also thank the research staff of the University of Colorado’s Trauma Research Center: Victoria Bress, Sanchayita Mitra, Fabia Gamboni, Cameron Anderson, James Chandler, Sarah Ammons, Courtney Fleming, Raymond Shepherd-Singh, Jacob Feiler, and Robert Meller. The authors also wish to acknowledge the collaboration of Denver Health Medical Center’s team of physicians, nurses, and technicians, as well as that of the Denver Health Paramedics.
Footnotes
The content is solely the responsibility of the authors and does not necessarily represent the official views of the NIGMS or National Institutes of Health.
The author reports no conflicts of interest.
Supplemental digital content is available for this article. Direct URL citations appear in the printed text and are provided in the HTML and PDF versions of this article on the journal’s Web site (www.annalsofsurgery.com).
Disclosures: The authors EG, EEM, HBM, and MPC received support from Haemonetics Inc in the way of laboratory reagents.
References
- 1.Lozano R, Naghavi M, Foreman K, et al. Global and regional mortality from 235 causes of death for 20 age groups in 1990 and 2010: a systematic analysis for the Global Burden of Disease Study 2010. Lancet. 2012;380:2095–2128. doi: 10.1016/S0140-6736(12)61728-0. [DOI] [PMC free article] [PubMed] [Google Scholar]
- 2.Murray CJ, Atkinson C, Bhalla K, et al. The state of US health, 1990–2010: burden of diseases, injuries, and risk factors. JAMA. 2013;310:591–608. doi: 10.1001/jama.2013.13805. [DOI] [PMC free article] [PubMed] [Google Scholar]
- 3.Rhee P, Joseph B, Pandit V, et al. Increasing trauma deaths in the United States. Ann Surg. 2014;260:13–21. doi: 10.1097/SLA.0000000000000600. [DOI] [PubMed] [Google Scholar]
- 4.Norton R, Kobusingye O. Injuries. N Engl J Med. 2013;368:1723–1730. doi: 10.1056/NEJMra1109343. [DOI] [PubMed] [Google Scholar]
- 5.MacKenzie EJ, Rivara FP, Jurkovich GJ, et al. A national evaluation of the effect of trauma-center care on mortality. N Engl J Med. 2006;354:366–378. doi: 10.1056/NEJMsa052049. [DOI] [PubMed] [Google Scholar]
- 6.Tisherman SA, Schmicker RH, Brasel KJ, et al. Detailed description of all deaths in both the shock and traumatic brain injury hypertonic saline trials of the Resuscitation Outcomes Consortium. Ann Surg. 2015;261:586–590. doi: 10.1097/SLA.0000000000000837. [DOI] [PMC free article] [PubMed] [Google Scholar]
- 7.Eastridge BJ, Hardin M, Cantrell J, et al. Died of wounds on the battlefield: causation and implications for improving combat casualty care. J Trauma. 2011;71:S4–8. doi: 10.1097/TA.0b013e318221147b. [DOI] [PubMed] [Google Scholar]
- 8.Cayten CG, Stahl WM, Agarwal N, et al. Analyses of preventable deaths by mechanism of injury among 13,500 trauma admissions. Ann Surg. 1991;214:510–520. doi: 10.1097/00000658-199110000-00015. [DOI] [PMC free article] [PubMed] [Google Scholar]
- 9.Sauaia A, Moore FA, Moore EE, et al. Epidemiology of trauma deaths: a reassessment. J Trauma. 1995;38:185–193. doi: 10.1097/00005373-199502000-00006. [DOI] [PubMed] [Google Scholar]
- 10.Brohi K, Singh J, Heron M, et al. Acute traumatic coagulopathy. J Trauma. 2003;54:1127–1130. doi: 10.1097/01.TA.0000069184.82147.06. [DOI] [PubMed] [Google Scholar]
- 11.MacLeod JB, Lynn M, McKenney MG, et al. Early coagulopathy predicts mortality in trauma. J Trauma. 2003;55:39–44. doi: 10.1097/01.TA.0000075338.21177.EF. [DOI] [PubMed] [Google Scholar]
- 12.Gonzalez E, Pieracci FM, Moore EE, et al. Coagulation abnormalities in the trauma patient: the role of point-of-care thromboelastography. Semin Thromb Hemost. 2010;36:723–737. doi: 10.1055/s-0030-1265289. [DOI] [PMC free article] [PubMed] [Google Scholar]
- 13.Kutcher ME, Kornblith LZ, Narayan R, et al. A paradigm shift in trauma resuscitation: evaluation of evolving massive transfusion practices. JAMA Surg. 2013;148:834–840. doi: 10.1001/jamasurg.2013.2911. [DOI] [PubMed] [Google Scholar]
- 14.Hoyt DB, Dutton RP, Hauser CJ, et al. Management of coagulopathy in the patients with multiple injuries: results from an international survey of clinical practice. J Trauma. 2008;65:755–764. doi: 10.1097/TA.0b013e318185fa9f. [DOI] [PubMed] [Google Scholar]
- 15.Camazine MN, Hemmila MR, Leonard JC, et al. Massive transfusion policies at trauma centers participating in the American College of Surgeons Trauma Quality Improvement Program. J Trauma Acute Care Surg. 2015;78:S48–53. doi: 10.1097/TA.0000000000000641. [DOI] [PubMed] [Google Scholar]
- 16.Holcomb JB, Jenkins D, Rhee P, et al. Damage control resuscitation: directly addressing the early coagulopathy of trauma. J Trauma. 2007;62:307–310. doi: 10.1097/TA.0b013e3180324124. [DOI] [PubMed] [Google Scholar]
- 17.Moore PK, Moore EE, Moore FA. Exception from informed consent requirements for emergency research. Surgery. 2009;145:630–635. doi: 10.1016/j.surg.2009.03.003. [DOI] [PubMed] [Google Scholar]
- 18.Bulger EM, May S, Kerby JD, et al. Out-of-hospital hypertonic resuscitation after traumatic hypovolemic shock: a randomized, placebo controlled trial. Ann Surg. 2011;253:431–441. doi: 10.1097/SLA.0b013e3181fcdb22. [DOI] [PMC free article] [PubMed] [Google Scholar]
- 19.Ebinger M, Winter B, Wendt M, et al. Effect of the use of ambulance-based thrombolysis on time to thrombolysis in acute ischemic stroke: a randomized clinical trial. JAMA. 2014;311:1622–1631. doi: 10.1001/jama.2014.2850. [DOI] [PubMed] [Google Scholar]
- 20.Altman DG, Bland JM. Treatment allocation in controlled trials: why randomise? BMJ. 1999;318:1209. doi: 10.1136/bmj.318.7192.1209. [DOI] [PMC free article] [PubMed] [Google Scholar]
- 21.Hallstrom AP, Paradis NA. Pre-randomization and de-randomization in emergency medical research: new names and rigorous criteria for old methods. Resuscitation. 2005;65:65–69. doi: 10.1016/j.resuscitation.2004.10.008. [DOI] [PubMed] [Google Scholar]
- 22.Cofield S, Conwit R, Barsan W, et al. Recruitment and retention of patients into emergency medicine clinical trials. Acad Emerg Med. 2010;17:1104–1112. doi: 10.1111/j.1553-2712.2010.00866.x. [DOI] [PMC free article] [PubMed] [Google Scholar]
- 23.Sugarman J, Califf RM. Ethics and regulatory complexities for pragmatic clinical trials. JAMA. 2014;311:2381–2382. doi: 10.1001/jama.2014.4164. [DOI] [PubMed] [Google Scholar]
- 24.Practice parameter for the use of fresh-frozen plasma, cryoprecipitate, and platelets. Fresh-Frozen Plasma, Cryoprecipitate, and Platelets Administration Practice Guidelines Development Task Force of the College of American Pathologists. JAMA. 1994;271:777–781. [PubMed] [Google Scholar]
- 25.Spahn DR, Bouillon B, Cerny V, et al. Management of bleeding and coagulopathy following major trauma: an updated European guideline. Crit Care. 2013;17:R76. doi: 10.1186/cc12685. [DOI] [PMC free article] [PubMed] [Google Scholar]
- 26.Kozek-Langenecker SA, Afshari A, Albaladejo P, et al. Management of severe perioperative bleeding: guidelines from the European Society of Anaesthesiology. Eur J Anaesthesiol. 2013;30:270–382. doi: 10.1097/EJA.0b013e32835f4d5b. [DOI] [PubMed] [Google Scholar]
- 27.Scott E, Puca K, Heraly J, et al. Evaluation and comparison of coagulation factor activity in fresh-frozen plasma and 24-hour plasma at thaw and after 120 hours of 1 to 6 degrees C storage. Transfusion. 2009;49:1584–1591. doi: 10.1111/j.1537-2995.2009.02198.x. [DOI] [PubMed] [Google Scholar]
- 28.Stanworth SJ. The evidence-based use of FFP and cryoprecipitate for abnormalities of coagulation tests and clinical coagulopathy. Hematology Am Soc Hematol Educ Program. 2007:179–186. doi: 10.1182/asheducation-2007.1.179. [DOI] [PubMed] [Google Scholar]
- 29.Kaufman RM, Djulbegovic B, Gernsheimer T, et al. Platelet transfusion: a clinical practice guideline from the AABB. Ann Intern Med. 2015;162:205–213. doi: 10.7326/M14-1589. [DOI] [PubMed] [Google Scholar]
- 30.Moore HB, Moore EE, Chin TL, et al. Activated clotting time of thrombelastography (T-ACT) predicts early postinjury blood component transfusion beyond plasma. Surgery. 2014;156:564–569. doi: 10.1016/j.surg.2014.04.017. [DOI] [PMC free article] [PubMed] [Google Scholar]
- 31.Chapman MP, Moore EE, Ramos CR, et al. Fibrinolysis greater than 3% is the critical value for initiation of antifibrinolytic therapy. J Trauma Acute Care Surg. 2013;75:961–967. doi: 10.1097/TA.0b013e3182aa9c9f. [DOI] [PMC free article] [PubMed] [Google Scholar]
- 32.Raza I, Davenport R, Rourke C, et al. The incidence and magnitude of fibrinolytic activation in trauma patients. J Thromb Haemost. 2013;11:307–314. doi: 10.1111/jth.12078. [DOI] [PubMed] [Google Scholar]
- 33.Schoenfeld DA, Bernard GR. Statistical evaluation of ventilator-free days as an efficacy measure in clinical trials of treatments for acute respiratory distress syndrome. Crit Care Med. 2002;30:1772–1777. doi: 10.1097/00003246-200208000-00016. [DOI] [PubMed] [Google Scholar]
- 34.National Trauma Data Standard. [Accessed October 26, 2015]; Available at: http://www.ntdsdictionary.org.
- 35.JH . PASS 11. NCSS, LLC; Kaysville, Utah: 2011. [Accessed October 26, 2015]. Available at: www.ncss.com. [Google Scholar]
- 36.Consolidated Standards of Reporting Trials (CONSORT) [Accessed October 26, 2015]; Available at: http://www.consort-statement.org/checklists/view/32-consort/510-baseline-data.
- 37.Tapia NM, Chang A, Norman M, et al. TEG-guided resuscitation is superior to standardized MTP resuscitation in massively transfused penetrating trauma patients. J Trauma Acute Care Surg. 2013;74:378–385. doi: 10.1097/TA.0b013e31827e20e0. [DOI] [PubMed] [Google Scholar]
- 38.Spitalnik SL, Triulzi D, Devine DV, et al. 2015 Proceedings of the National Heart, Lung, and Blood Institute’s State of the Science in Transfusion Medicine symposium. Transfusion. 2015;55:2282–2290. doi: 10.1111/trf.13250. [DOI] [PMC free article] [PubMed] [Google Scholar]
- 39.Holcomb JB, del Junco DJ, Fox EE, et al. The prospective, observational, multicenter, major trauma transfusion (PROMMTT) study: comparative effectiveness of a time-varying treatment with competing risks. JAMA Surg. 2013;148:127–136. doi: 10.1001/2013.jamasurg.387. [DOI] [PMC free article] [PubMed] [Google Scholar]
- 40.Davenport R, Curry N, Manson J, et al. Hemostatic effects of fresh frozen plasma may be maximal at red cell ratios of 1:2. J Trauma. 2011;70:90–95. doi: 10.1097/TA.0b013e318202e486. [DOI] [PubMed] [Google Scholar]
- 41.Kashuk JL, Moore EE, Johnson JL, et al. Postinjury life threatening coagulopathy: is 1:1 fresh frozen plasma:packed red blood cells the answer? J Trauma. 2008;65:261–270. doi: 10.1097/TA.0b013e31817de3e1. [DOI] [PubMed] [Google Scholar]
- 42.Holcomb JB, Tilley BC, Baraniuk S, et al. Transfusion of plasma, platelets, and red blood cells in a 1:1:1 vs a 1:1:2 ratio and mortality in patients with severe trauma: the PROPPR randomized clinical trial. JAMA. 2015;313:471–482. doi: 10.1001/jama.2015.12. [DOI] [PMC free article] [PubMed] [Google Scholar]
- 43.Kutcher ME, Ferguson AR, Cohen MJ. A principal component analysis of coagulation after trauma. J Trauma Acute Care Surg. 2013;74:1223–1229. doi: 10.1097/TA.0b013e31828b7fa1. [DOI] [PMC free article] [PubMed] [Google Scholar]
- 44.Chin TL, Moore EE, Moore HB, et al. A principal component analysis of postinjury viscoelastic assays: clotting factor depletion versus fibrinolysis. Surgery. 2014;156:570–577. doi: 10.1016/j.surg.2014.04.030. [DOI] [PMC free article] [PubMed] [Google Scholar]
- 45.Johnson JL, Moore EE, Kashuk JL, et al. Effect of blood products transfusion on the development of postinjury multiple organ failure. Arch Surg. 2010;145:973–977. doi: 10.1001/archsurg.2010.216. [DOI] [PubMed] [Google Scholar]
- 46.Ware JH, Hamel MB. Pragmatic trials—guides to better patient care? N Engl J Med. 2011;364:1685–1687. doi: 10.1056/NEJMp1103502. [DOI] [PubMed] [Google Scholar]
Associated Data
This section collects any data citations, data availability statements, or supplementary materials included in this article.