

ABSTRACT
P-element-induced wimpy-like (Piwil) proteins restrict the replication of mobile genetic elements in the germ line. They are also expressed in many transformed cell lines. In this study, we discovered that the human Piwil 2 (Hili) protein can also inhibit HIV replication, especially in activated CD4+ T cells that are the preferred target cells for this virus in the infected host. Although resting cells did not express Hili, its expression was rapidly induced following T cell activation. In these cells and transformed cell lines, depletion of Hili increased levels of viral proteins and new viral particles. Further studies revealed that Hili binds to tRNA. Some of the tRNAs represent rare tRNA species, whose codons are overrepresented in the viral genome. Targeting tRNAArg(UCU) with an antisense oligonucleotide replicated effects of Hili and also inhibited HIV replication. Finally, Hili also inhibited the retrotransposition of the endogenous intracysternal A particle (IAP) by a similar mechanism. Thus, Hili joins a list of host proteins that inhibit the replication of HIV and other mobile genetic elements.
IMPORTANCE Piwil proteins inhibit the movement of mobile genetic elements in the germ line. In their absence, sperm does not form and male mice are sterile. This inhibition is thought to occur via small Piwi-interacting RNAs (piRNAs). However, in some species and in human somatic cells, Piwil proteins bind primarily to tRNA. In this report, we demonstrate that human Piwil proteins, especially Hili, not only bind to select tRNA species, including rare tRNAs, but also inhibit HIV replication. Importantly, T cell activation induces the expression of Hili in CD4+ T cells. Since Hili also inhibited the movement of an endogenous retrovirus (IAP), our finding shed new light on this intracellular resistance to exogenous and endogenous retroviruses as well as other mobile genetic elements.
KEYWORDS: HIV, IAP, Hili, inhibition, lentiviruses, rare codon, replication, tRNA, translation
INTRODUCTION
The human immunodeficiency virus (HIV) causes AIDS (1). It is a lentivirus that originated in other primates and jumped to humans. HIV replicates best in activated CD4+ T cells and macrophages. They contain the necessary transcription factors and cellular machineries for the entry, uncoating, integration, transcription, RNA export, translation, and assembly of new viral particles (1). However, the virus still has to overcome various restriction factors, such as SamHD1, TRIM5, APOBEC3F/3G, Mx2, Schlafen 11, Tetherin/Bst2, and Serinc3/5, for successful passage through an infected cell (2–7). Some of these play less important roles in activated CD4+ T cells, and for others, HIV-encoded accessory and regulatory proteins mitigate their effects. Interestingly, HIV has little defense against two interferon-stimulated genes, the Mx2 and Schlafen 11 genes (2, 6). Moreover, Schlafen 11, which can inhibit translation of viral transcripts, has been implicated in long-term suppression of HIV replication in elite controllers (2).
Another group of host proteins can inhibit the movement of mobile genetic elements, such as endogenous retroviruses and retrotransposons, in the germ line (8–10). They are called P-element-induced wimpy like (Piwil) proteins (11). As members of the argonaute family of proteins, they bind to small Piwi-interacting RNAs (piRNAs), which are slightly larger than miRNAs (12). piRNAs contain sequences that are complementary to and thus restrict the movement of mobile genetic elements in the germ line (8). In their absence, spermatogenesis is inhibited and male mice are sterile. In humans, there are 4 Piwil proteins, and they are called Hiwi, Hili, Piwil 3, and Hiwi 2 (10, 13). Some of them are also expressed in many tumors, especially those of the reproductive system, e.g., seminomas (14, 15). They are thought to increase malignant transformation by inhibiting p53, which is a tumor suppressor (16). Of interest, in somatic cells, rather than binding to piRNAs, which contain retroviral or retrotransposon sequences, Piwil proteins bind to tRNAs (17–19).
In this report, we discovered that Piwil proteins also inhibit the replication of HIV. For example, Hili and Mili (the mouse Piwil 2 protein) decreased levels of viral proteins in cells. They also inhibited the expression of the native green fluorescent protein (GFP) but not of its codon-optimized counterpart (enhanced green fluorescent protein [EGFP]). We also noted increased expression of Hili upon T cell activation. In all of these scenarios, genetic inactivation of Hili increased levels of HIV replication. Since the amounts of viral transcripts did not change, we suspected that Hili inhibited their translation. Indeed, Hili bound to tRNAs. Of these, Hili favored rare tRNAArg(UCU) and tRNAIle(UAU), whose codons are found abundantly in GFP and HIV transcripts. Importantly, removing the rare tRNAArg(UCU) via antisense (AS) oligonucleotides recapitulated the effects of the presence of Hili. These findings were duplicated with an endogenous retrovirus, the intracysternal A particle (IAP). Thus, Hili, like Schlafen 11, inhibits HIV replication by interfering with the translation of viral transcripts. Since many of these suboptimal codons are found in areas of RNA secondary structure, HIV cannot easily escape this inhibition.
RESULTS
Piwil proteins inhibit HIV replication.
Piwil proteins are related to each other within species and between species (10, 20). For example, mouse and human Piwil 2 proteins (Mili and Hili) are 88% identical in sequence (Fig. 1A). Because Piwil proteins are known to inhibit the movement of mobile genetic elements, we investigated if they could also affect HIV (HIV-1NL4-3 or pNL4-3) (Fig. 1A). To this end, we coexpressed Hili and HIV in 293T cells (Fig. 1B, bars 1 and 2). At the same time, we expressed HIV by transfecting pNL4-3 in 293T cells, which stably contained Mili (293T.mili; Fig. 1B, bar 3). Supernatants were harvested 2 days after the transfection. Levels of new viral particles were determined by Gag p24 enzyme-linked immunosorbent assay (ELISA). Of note, in the presence of Hili or Mili, 5- or 10-fold-reduced levels of new viral particles were observed from these cells, respectively. Levels of Hili and Mili were determined with appropriate antibodies (Abs) by Western blotting, where tubulin served as the loading control (Fig. 1B, lower panels, lanes 1 to 3).
FIG 1.

Piwil proteins inhibit HIV replication. (A) Schematic representation of effectors and targets. Human and mouse Piwil 2 proteins (Hili and Mili, respectively) are 88% identical and 93% similar. They contain PAZ (piwi, argonaute, and zwili) and PIWI (P-element-induced wimpy) domains that bind to RNA. They contain 973 and 971 residues, respectively. pNL4-3 and pNL4-3.Luc plasmids encode the WT HIV-1NL4-3 provirus and the mutant provirus, where the luciferase reporter gene was inserted into the Nef ORF (open reading frame), respectively. The env gene was inactivated by introducing a stop codon. Other ORFs are intact, including those coding for Gag, Pol, Vif (f), Vpr (r), Vpu (u), Tat, and Rev proteins. Their transcription is regulated by 5′ and 3′ long terminal repeats (LTRs) of HIV. The luciferase reporter gene was codon optimized for expression in human cells. (B) Expression of Hili and Mili inhibits HIV replication in 293T cells. Equivalent amounts of HIV-1NL4-3 were transfected in 293T cells. Virus production was monitored with p24 ELISA in supernatants of infected cells. For the experiments whose results are represented by bar 2, Hili was expressed transiently in 293T cells (hili). For the experiments whose results are represented by bar 3, 293T cells stably expressed mili.EGFP (293T.mili). Supernatants were harvested 2 days after infection. Values were normalized to those of viruses produced in WT cells, which were 293T cells transfected with an empty vector (bar 1 [C bar]). The expression of Hili and Mili was monitored with anti-FLAG (Hili) and anti-GFP (Mili) antibodies by Western blotting. Tubulin represented the loading control. Error bars represent standard errors of the means (SEM) of results from 3 independent experiments (n = 3), which were performed in duplicate. Student's t test was used to measure the significance of the data (*, P < 0.05; **, P < 0.01; ***, P < 0.001). (C) Viruses produced by Hili- and Mili-expressing cells are equally infectious in TZM-bl cells. Supernatants from the experiments performed as described for panel B were normalized to levels of p24 and used to infect TZM-bl cells, which express receptors for HIV-1 and contain luciferase and LacZ reporter genes under the control of the HIV-1 LTR. Values were normalized to those of viruses produced from WT cells (bar 1 [C bar]). Error bars are as described for panel B. (D) HIV RNA levels are not affected by Hili. Hili was coexpressed with pNL4-3.Luc in 293T cells. Total RNA was extracted 2 days later. Using primers corresponding to gag, RT-qPCR quantitated levels of viral transcripts. (E) Hili inhibits the expression of Gag. Cell lysates from the experiment described in the panel D legend were also examined for production of viral proteins. Full-length Gag protein (p55) and its proteolytic product (capsid [CA] [p24]) were examined by Western blotting. Ratios of these proteins produced by WT (C bar) and Hili (hili bar)-expressing 293T cells are presented to the right of Western blots. (F) Luciferase levels are not affected by Hili. In contrast to the levels of viral proteins, luciferase activity was not affected by Hili.
To determine if these Piwil proteins affected the infectivity of new viral particles, we used equivalent amounts of viruses from these cells and infected fresh TZM-bl indicator cells. TZM-bl cells express necessary HIV receptors and contain the HIV long terminal repeat (LTR) linked to luciferase and LacZ reporter genes. As presented in Fig. 1C, new viral particles from 293T cells transfected with an empty vector (negative control) (C) and those expressing Hili or Mili were equally infectious (Fig. 1C, bars 1 to 3). Thus, these Piwil proteins did not affect the infectivity of new viral particles.
Next, we wanted to know if Hili affected levels of viral transcripts or proteins. To this end, we coexpressed Hili and the pNL4-3.Luc provirus, which contains the luciferase reporter gene in place of the nef gene, in these cells. We interrogated HIV genomic RNA species using gag-specific primers and reverse transcriptase quantitative PCR (RT-qPCR). No differences in levels of HIV genomic transcripts were observed between wild-type (WT) cells control (C), and Hili-expressing 293T cells (Fig. 1D, bars 1 and 2). In contrast, we found 5-fold-lower levels of expression of Gag proteins in Hili-expressing cells (Fig. 1E, lanes 1 and 2). This finding was true for the p55 Gag precursor as well as for its p24 (capsid [CA]) mature product (Fig. 1E, top panel, lanes 1 and 2). The expression of Hili was monitored by Western blotting, where tubulin again served as the internal control (Fig. 1E, bottom panels, lanes 1 and 2). Finally, despite differences in levels of viral proteins, the levels of luciferase activity of these two cells were equivalent (Fig. 1F, bars 1 and 2). Importantly, this luciferase reporter gene has been optimized for expression in human cells by substituting rare codons for abundant ones found in humans. From these studies, we conclude that Hili and Mili inhibit HIV replication at the step of translation and that the translation of viral but not codon-optimized transcripts is affected.
Hili inhibits the expression of GFP but not codon-optimized EGFP.
Since Schlafen 11 also inhibits primarily the translation of HIV transcripts, we next examined the ability of Hili to affect additional transcripts from other species that were not codon optimized. For example, the green fluorescent protein (GFP) from Aequorea victoria (jellyfish) contains several rare human codons such as Ile-AUA or Arg-AGA (Fig. 2A). They were changed in its humanized version (EGFP). To determine if Hili affected the translation of GFP but not EGFP, we coexpressed Hili and these GFP transcripts in 293T cells. Two days later, Western blotting revealed that Hili affected the expression of GFP but not EGFP in these cells (Fig. 2B and C, top panels, lanes 1 to 4). Densitometric analyses of these bands by the use of a Li-Cor instrument are presented in the top bar graphs (Fig. 2B and C, bars 1 to 4). Although 5-fold-lower expression of GFP was observed in the presence of Hili, the levels of GFP and EGFP transcripts remained the same (Fig. 2B and C, lower bar graphs, bars 1 to 4). Expression of Hili was followed by Western blotting, where tubulin again served as the internal control (Fig. 2B and C, lower two Western blots, lanes 1 to 4). We conclude that Hili affects the expression of only the non-codon-optimized version of GFP.
FIG 2.
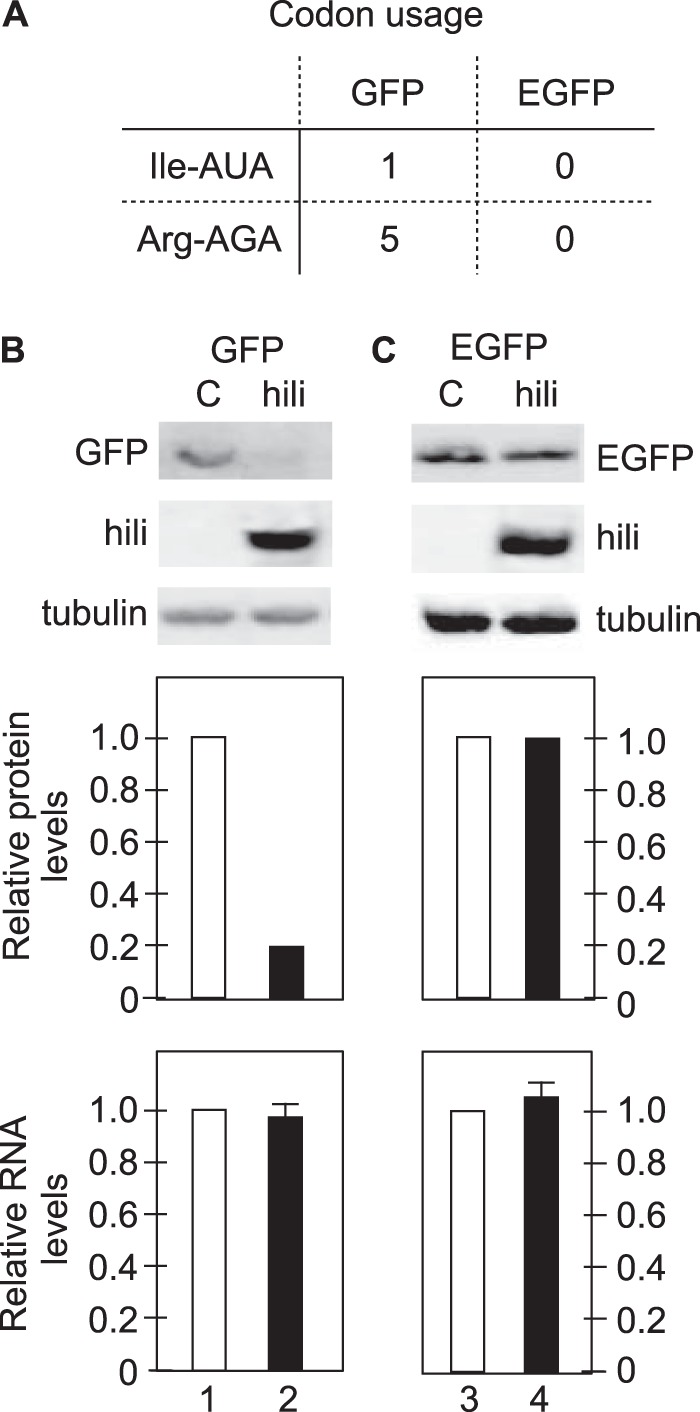
Hili inhibits expression of GFP but not of codon-optimized EGFP proteins. (A) Codon usage of GFP and EGFP genes. Of two rare codons analyzed, GFP contains one Ile-AUA codon and 5 Arg-AGA codons. In EGFP, they were all optimized for abundant human Ile and Arg codons. (B) Hili inhibits the expression of GFP. GFP was coexpressed transiently with an empty vector (C bar) or Hili (hili bar) in 293T cells. Western blots reveal levels of coexpressed proteins and were normalized to tubulin. Densitometry of Western blots (performed using a Li-Cor instrument) revealed the relative expression levels of GFP in these cells (bar graphs below the Western blots). At the same time, RNA levels of GFP transcripts were determined by RT-qPCR. (C) Hili does not affect the expression of EGFP. The codon-optimized EGFP was coexpressed transiently with an empty vector (C bar) or with Hili (hili bar) in 293T cells. The quantitation of Western blots and EGFP transcripts was performed as described for panel A.
Cell activation induces the expression of Hili in peripheral blood mononuclear cells (PBMCs) and CD4+ T cells.
Thus far, all our studies were carried out in transformed 293T cells, which represent human embryonic kidney cells. Additionally, they express the large T antigen of simian virus 40 (SV40). To determine if Hili plays any role in HIV replication in other transformed indicator and hematopoietic cells as well as in the primary cells that are the natural hosts of HIV, we examined HeLa cells, Jurkat cells, PBMCs, and CD4+ T cells. Of these, HeLa cells are the parental TZM-bl cells, Jurkat cells represent an infectible immature T cell line, and activated PBMCs and CD4+ T cells are the primary target cells in humans. Others previously determined that HeLa and Jurkat cells, unlike 293T cells, express Hili (21). Thus, we first interrogated if depletion of Hili in these cells increases levels of HIV replication. As presented in Fig. 3A and B, RNA interference (RNAi) applied to Hili with short interfering RNA (siRNA) species increased the production of new viral particles up to 4-fold in HeLa and Jurkat cells. In these cells, Hili was depleted for 24 h before cells were infected with vesicular stomatitis virus (VSV)-G-pseudotyped HIV-1NL4-3. At 48 h later, supernatants were harvested and levels of new viral particles were determined by Gag p24 ELISA. In Fig. 3A, the lower bar graph indicates levels of hili mRNA as measured by RT-qPCR and panels below the bar graphs represent Hili and tubulin proteins as determined by Western blotting. A similar presentation is given in Fig. 3B. We also examined PBMCs and CD4+ T cells (Fig. 3C). In these cells, levels of hili transcripts were vanishingly low in the resting state, but they increased dramatically following cell activation. For PBMCs, phytohemagglutinin (PHA) and phorbol myristate acetate (PMA) were administered for 2 days (Fig. 3C, left bar graph, bars 1 and 2). For purified CD4+ T cells, activation was performed with anti-CD3 and anti-CD28 antibodies. Two days later, RT-qPCR and Western blotting were performed, with results which indicated increased levels of hili mRNA and protein (Fig. 3C, bar graph on the right, Western blots below the bar graph, bars 1 and 2). Since levels of Hili were increased in these activated cells, we also used the same siRNA reagents and observed a similar increase in the production of new viral particles in the absence of Hili (Fig. 3D, bar graphs, bars 1 and 2). We conclude that Hili inhibits viral replication in transformed cell lines as well as in activated primary CD4+ T cells, which are the primary target for HIV in humans.
FIG 3.

Hili is expressed constitutively in HeLa and Jurkat cells, is induced in PBMCs and CD4+ cells by cell activation, and inhibits HIV replication in these cells. (A) Hili is expressed constitutively in HeLa cells. Its depletion increases HIV replication in these cells. Western blots and RT-qPCR revealed the presence of Hili in HeLa cells. Cells were transfected with appropriate siRNAs and, 1 day later, infected with VSV-G-pseudotyped HIV-1NL4-3. Two days later, cells were examined for levels of Hili and virus production. Using Hili siRNA (siHil bar) but not scrambled siRNA (C bar), levels of Hili were reduced (lower bar graph and Western blot) and those of HIV (top panel) were increased. (B) Hili is expressed constitutively in Jurkat cells. Its depletion increases HIV replication in these cells. Experiments similar to those performed as described in the panel A legend were performed in Jurkat cells. (C) Hili is induced following the activation of PBMCs with PHA and PMA and following the activation of CD4+ T cells by anti-CD3 and anti-CD28 antibodies. To determine the data presented in the bar graph on the left, PBMCs from anonymous donors were stimulated with PHA and PMA for 2 days and levels of hili transcripts were measured by RT-qPCR. Bar 1, no stimulation; bar 2, addition of PHA and PMA. Similar experiments were performed with CD4+ T cells, which were activated with anti-CD3 and anti-CD28 antibodies. RT-qPCR and Western blotting revealed the induction of Hili in these cells. (D) Depletion of Hili in activated CD4+ T cells increases HIV replication. Activated CD4+ T cells coexpressed siScr (C bar) or siHil (siHil bar) RNAs. siHil RNA decreased the expression levels of hili transcripts (bottom bar graph) and increased the production of new viral particles (top bar graph). For all bar graphs, error bars represent SEM of results from 3 independent experiments (n = 3), which were performed in duplicate. Student's t test was used to measure the significance of the data (*, P < 0.05; **, P < 0.01; ***, P < 0.001).
Mili binds to some tRNAs in cells.
To determine how Mili could inhibit HIV translation, we next examined RNA species that bind to Mili in cells. 293T cells stably expressing chimeric mili.EGFP (293T.mili) were UV irradiated and lysed. Anti-Piwil 2 and anti-GFP antibodies were then used to immunoprecipitate (IP) Mili and associated RNA species. RNA was released from immunocomplexes, separated by the use of a 15% Tris-borate-EDTA (TBE)-urea gel, and visualized with Sybr gold reagent. Saccharomyces cerevisiae (yeast) tRNA was used as the molecular size marker for tRNA species (Fig. 4A, lane 5). Other RNA size markers were also present (Fig. 4A, lane 1). Importantly, Mili bound predominantly to RNAs of the same size as the yeast tRNA marker (Fig. 4A, lanes 3, 4, and 5). There was no binding to the IgG control (Fig. 4A, lane 2). In addition, no smaller RNA species were observed, especially in the 25-to-30-nucleotide range, where one would expect to see piRNAs or degraded tRNA species. Some larger-molecular-size RNA bands were also observed, but they corresponded to those observed with the yeast tRNA or the IgG negative control (Fig. 4A, lanes 3 to 5). We conclude that Mili binds to tRNA in cells.
FIG 4.

Mili binds preferentially to some tRNAs in cells. (A) Mili binds to tRNA in cells. 293T.mili cells were UV irradiated and lysed. Anti-GFP and anti-Piwil 2 antibodies were used to immunoprecipitate associated RNA species (lanes 3 and 4). RNA species were separated by the use of a 15% TBE-urea gel and stained with Sybr gold reagent. Bands were visualized with a Li-Cor instrument. Yeast tRNA was used as the marker for tRNA (lane 5). The additional RNA size marker is presented in lane 1. IgG served as the negative control (lane 2). Note that the tRNAs coimmunoprecipitated with Mili, but no smaller RNA species were observed (lanes 3 and 4). mw, molecular weight. (B) Mili binds preferentially to some tRNAs in cells. UV-irradiated (cross-linked) and anti-Piwil 2 immunoprecipitated RNA was subjected to 3′ end labeling with 32P, separated by the use of 10% TBE-urea gels, and submitted to autoradiography. The band corresponding to tRNA was cut out of the gel, eluted, and hybridized to a human tRNA microarray. A heat map of this microarray is presented. Relative abundances of these tRNA species on Mili are compared to those in cells. Increasing intensities of red and green signify greater and lesser abundances of these species, respectively. (C) Data corresponding to up- or downregulated tRNAs from the experiment described in the panel B legend are presented in this bar graph, with arrows highlighting rare tRNAs. Note that the rare tRNAIle(UAU) and tRNAArg(UCU) are overrepresented on Mili and are highlighted as red bars. Fold increased and decreased abundance values are given below the bar graph.
To investigate further tRNA species that bind to Mili, we performed a modified cross-linked immunoprecipitation–microarray (Clip-chip) analysis (22). This analysis was preferred to transcriptome sequencing (RNA-seq), which would not reveal correctly relative levels of tRNAs of low abundance, i.e., rare tRNA species. 293T.mili cells were first UV irradiated. RNA bound to Mili was immunoprecipitated with anti-Piwil 2 antibodies, subjected to 3′-end 32P labeling, and analyzed using purified 32P-labeled yeast tRNAPhe as the size control. The pattern was identical to that seen with Mili as indicated in Fig. 4A (data not presented). The 32P-labeled RNAs were subjected to tRNA microarray according to methods described previously (23). Microarray data are displayed in the heat blot in Fig. 4B. Progressively redder and greener squares indicate greater and lesser abundance of specific tRNA species. The results are quantified further in the bar graph in Fig. 4C. Of note, two rare tRNAs were overrepresented on Mili. They were tRNAIle(UAU) and tRNAArg(UCU) (Fig. 4B and C). They are indicated by red bars (Fig. 4C). We conclude that Mili proteins bind to tRNA in cells and that some rare tRNAs bind better than expected.
Depletion of tRNAArg(UCU) via an antisense oligonucleotide inhibits HIV replication.
Both tRNAIle(UAU) and tRNAArg(UCU) were overrepresented on Mili (Fig. 4B and C). To examine their effects on HIV replication, we chose tRNAArg(UCU). Compared to tRNAIle(UAU), which represents 14% of all tRNAIle (23), tRNAArg(UCU) represents only 5% of all tRNAsArg. The more abundant ones include tRNAArg(CCG), tRNAArg(CCU), and tRNAArg(ICG) in 293T cells (Fig. 5A) (23). Nevertheless, tRNAArg(UCU) is encoded by 5 loci on different human chromosomes (Fig. 5B). Of interest, HIVNL4-3 contains 122 of these rare Arg-AGA codons, many of them in critical double-stranded regions, e.g., the RNA frame-shifting site (FS) between gag and pol and the Rev response element (RRE) (Fig. 5C).
FIG 5.

Levels of tRNAArg(UCU) are low in cells, and antisense Arg(UCU) oligonucleotides inhibit HIV replication. (A) tRNAArg(UCU) represents 5% of all tRNAArg in human cells. tRNAArg(CGU) represents the vast majority of tRNAArg in cells, determined by a tRNA sequencing analysis performed using 293T cells. The pie chart represents these ratios. (B) Five loci on different human chromosomes encode tRNAArg(UCU). The locations of these loci and their relative abundances are presented in this pie chart. (C) HIV-1NL4-3 contains 122 Arg-AGA codons. They are distributed in all reading frames and abundant in the gag-pol frame-shifting site (FS) and the RRE. The distribution in various ORFs of the virus is presented in this table. (D) Antisense Arg(UCU) oligonucleotides inhibit HIV replication in 293T cells. Specific and scrambled oligonucleotides were expressed in 293T cells for 24 h, and cells were then transfected with HIV-1NL4-3. At 48 h later, supernatants were harvested for levels of Gag p24 (top bar graph) and cells were examined for levels of tRNAArg(UCU) by RT-qPCR (middle graph) and for viability (bottom graph). C, scrambled oligonucleotide; AS, Arg(UCU) oligonucleotide. Error bars represent SEM (n = 3). (E) Antisense Arg(UCU) oligonucleotides inhibit HIV replication in CD4+ T cells. Specific and scrambled oligonucleotides were expressed in activated CD4+ T cells for 24 h. Cells were then infected with HIV-1NL4-3 and examined as described for panel C. Error bars are as described for panel C. For panels D and E, error bars represent SEM of results from 3 independent experiments (n = 3), which were performed in duplicate. Student's t test was used to measure the significance of the data (*, P < 0.05; **, P < 0.01; ***, P < 0.001).
Since tRNAArg(UCU) is encoded on 5 different chromosomes, we could not inactivate all these genes using clustered regularly interspaced short palindromic repeat (CRISPR)/Cas9 or related technologies. Rather, we synthesized an antisense (AS) oligonucleotide corresponding to tRNAArg(UCU) sequence [Arg(UCU)]. An irrelevant (scrambled) oligonucleotide served as the negative control (C). As presented in Fig. 5D, when Arg(UCU) AS oligonucleotide was expressed in 293T cells, HIV replication was reduced 3-fold (upper panel, lanes 1 and 2). This finding was validated in activated CD4+ T cells (Fig. 5E, upper panel, lanes 1 and 2). At the same time, we determined that the Arg(UCU) AS oligonucleotide depleted tRNAArg(UCU) equivalently in these cells (Fig. 5D and E, middle panels, lanes 1 and 2). Moreover, these AS oligonucleotides had no obvious effect on the viability of these cells (Fig. 5D and E, lower panels, lanes 1 and 2). We conclude that the depletion of tRNAArg(UCU) has the same effect as that of Hili and that both decrease the translation as well as replication of HIV.
Hili also inhibits the replication of the intracysternal A particles (IAP) in cells.
Since Piwil proteins block the replication of endogenous mobile genetic elements during germ line development in the mouse, we also wanted to determine if Hili could function similarly in somatic cells. To this end, we employed a well-characterized, fully active IAP-marked retrotransposon (pFL). Of note, IAP contains many Arg-AGA codons: 18 in gag, 2 in protease and reverse transcriptase (PR), and 16 in pol, representing up to 40% of all Arg codons in the viral genome. Since Hili and Mili share 88% sequence identity and 93% sequence similarity, we also examined effects of Hili on pFL in human cells. pFL is diagrammed in Fig. 6A. An interrupted EGFP reporter gene was placed into its genome in the opposite orientation. Importantly, pFL-expressing cells turn green only after the complete round of retrotransposition, after the splicing of the introduced intron in the EGFP gene in the IAP sense orientation and transcription of the mature EGFP gene in the IAP antisense orientation from the introduced eukaryotic initiation factor 1 alpha (eIF1α) promoter. The number of green cells then reflects the efficiency of retrotransposition (Fig. 6A, fluorescent image). Importantly, we performed our studies in cells that do not contain piRNAs (Fig. 4A).
FIG 6.

Hili inhibits the replication of IAP. (A) Schematic representation of pFL, which contains the full coding IAP genome, where an interrupted EGFP reporter gene was inserted in the opposite orientation at the 5′ end (indicated with reversed type). The 5′ LTR contains the cytomegalovirus (CMV) enhancer/chicken β-actin promoter for higher levels of expression in cells. The EGFP gene in the antisense orientation was interrupted by an intron in the sense orientation (arrow). It was transcribed from an eIF1α promoter. Other notations are as follows: PBS, primer binding site; PPT, polypurine tract. Upon transcription of IAP, the intron in EGFP was removed and the new integrated provirus expressed EGFP. EGFP-positive cells were then counted. The white arrow points to a green cell(s). The white bar represents 10 μm. (B) Hili inhibits IAP retrotransposition in 293T cells. The number of EGFP-positive cells in the presence of Hili relative to such cells transfected with an empty vector is presented (bar 2). (C) Hili inhibits the expression of IAP proteins in 293 T cells. Expression of IAP Gag proteins is presented below the Hili Western blot. A >5-fold decrease in expression of IAP proteins was observed in the presence of Hili in these cells. Expression of actin served as the internal control. (D) Levels of IAP transcripts are equivalent in 293T cells that do or do not express Hili. Relative levels of IAP gag RNA in the presence of Hili are presented in bar 2. The primers used for RT-qPCR are presented in Fig. 1A. (E) Reverse transcription of IAP is decreased in the presence of Hili. A 200-nucleotide (nt) product of RT was detected in control 293T cells transfected with an empty vector but not in Hili-expressing 293T cells (lanes 2 and 3).
After coexpressing transiently pFL and Hili in 293T cells for 72 h and counting over a thousand cells in three independent experiments, 10-fold-lower numbers of GFP-expressing cells were found in the presence of Hili than in its absence (Fig. 6B, bars 1 and 2). Expression of Hili is presented in Fig. 6C (top panel). Similarly to the situation with HIV, when IAP-specific proteins (p73, Gag, p35, matrix [MA] and p24, CA) were examined, more than 5-fold-lower expression of Gag proteins was observed in the presence of Hili (Fig. 6C, middle panel, lanes 1 and 2). Levels of actin served as the loading control (Fig. 6C, bottom panel, lanes 1 and 2). These differences in protein expression levels occurred despite similar levels of gag transcripts of Hili-expressing and parental 293T cells transfected with an empty vector (Fig. 6D, lanes 1 and 2), which were quantified using gag-specific primers and RT-qPCR. Finally, reverse transcription was compromised greatly in Hili-expressing cells (Fig. 6E, lanes 2 and 3). These data indicate that despite identical levels of IAP transcripts, expression of IAP proteins is reduced greatly in Hili-expressing cells. We conclude that even in the absence of piRNAs, Piwil proteins restrict the movement of mobile genetic elements in cells. Thus, their increased expression in activated T cells could help safeguard the genome in these cells.
DISCUSSION
In this study, we discovered that Hili can inhibit HIV replication, especially in the activated CD4+ T cells that are the preferred target cells for this virus in the infected host. Although resting cells do not express Hili, expression is rapidly induced following T cell activation. Other transformed cell lines express Hili constitutively. In them, depletion of Hili increased levels of viral proteins and new viral particles. Further studies revealed that in the absence of piRNAs, Hili binds to tRNA in these cells. Some of them represent rare tRNA species, whose codons are overrepresented in the viral genome. Targeting tRNAArg(UCU) with an antisense oligonucleotide replicated effects of Hili and also inhibited HIV replication in transformed 293T as well as activated primary CD4+ T cells. Importantly, Hili also inhibited the retrotransposition of IAP, an active endogenous retrovirus from the mouse, which also contains many Arg-AGA codons. Again, this occurred via the depletion of tRNAs rather than the formation and use of piRNAs. Thus, Hili joins a long list of host proteins that complicate the intricate intracellular trafficking of this human retrovirus.
We found that inducing Hili and depleting one of its target rare tRNAs had similar effects on HIV replication. Possibly, AS oligonucleotides targeting both tRNAArg(UCU) and tRNAIle(UAU) would have inhibited even more the replication of HIV. However, they should have greater deleterious side effects on host cells as well. In this report, we concentrated on Hili because its expression was induced following T cell activation. Nevertheless, other human Piwil proteins such as Hiwi, Piwil 3, and Hiwi 2, when expressed exogenously in cells, also inhibited HIV replication (data not presented). They contain similar PAZ and PIWI domains. Various levels of expression of Hili could also contribute to the elite controller phenotype of some HIV-infected individuals, as has been suggested for Schlafen 11 (24). However, although Schlafen 11 also depletes tRNAs in cells, its expression is induced by interferon and not by T cell activation (2). Thus, we did not coexpress and/or study cooperative effects of Hili and Schlafen 11 in our cells.
HIV is a very compact retrovirus, whose different transcripts must fold into the complicated RNA secondary structures that are required for its optimal replication. The choice of tRNA codons is thus mandated by the species where the virus originated, frequent cytosine deamination during reverse transcription by APOBEC3 proteins, and the demands of these secondary structures. For example, HIV full-length or genomic RNA contains the trans-activation region (TAR), packaging, Lys3 tRNA priming, frame-shifting, and RRE sequences and structures. They are required for transcription, nuclear export, translation, and packaging of RNA into new viral particles. HIV RNA structures that were even more complex were revealed by SHAPE analyses (25). To this end, it is not surprising that HIVNL4-3 contains 122 rare Arg AGA codons, 5 and 7 of which are found in the frame-shifting site, which is required for the translation of the Gag-Pol polyprotein precursor protein, and in the RRE, respectively. Thus, the virus would have a difficult time substituting these rare codons for more abundant ones. HIV transcripts also overwhelm the infected cell. It has been estimated that the virus usurps up to 20% of the translational machinery in activated CD4+ T cells (26). Thus, viral transcripts would be more sensitive to the relative abundance of rare tRNA species than host transcripts. Small perturbations in the levels of these rare tRNAs would thus be expected to have greater effects on HIV than on host cell proteins.
tRNAs were observed in all studies of Piwil proteins. Indeed, tRNA degration products predominate with tetrahymena Piwil proteins (17, 18). In another study, human Piwil proteins (Hiwi 2) also associated with tRNAs in somatic cells (19). Indeed, Hiwi 2 bound preferentially to 9 specific tRNAs in a breast cancer cell line (19). Although most tRNAs in those tumor cells were degraded or processed tRNA fragments, we found intact tRNAs in our study. Selected tRNAs are double stranded at their 5′ and 3′ ends. The distances between them are not sufficient to fit into the two separated RNA-binding pockets of the recently crystalized Piwil protein from silkworm (27). Nevertheless, Hili could potentially unwind the secondary structure of selected tRNAs to separate their 5′ and 3′ ends. Alternatively, Hili could bind these tRNAs simply due to strong electrostatic interactions that would favor some but not other tRNAs. Importantly, these tRNAs do not contain optimal 5′ U residues and 2′-O-methyl ribose modifications at appropriate positions (17, 19, 28, 29). Thus, further structural studies will be required to determine how some tRNAs bind selectively to Hili.
Although piRNAs are critical for restricting the movement of mobile genetic elements in the germ line, depleting rare tRNA species could also play a significant role. Most endogenous mobile genetic elements originated from different species and contain rare codons. If they are not translated, they also do not jump and replicate. Thus, depleting rare tRNAs would have effects similar to those seen with piRNAs with these mobile genetic elements. To this end, it is of interest that Hili also restricted the movement of IAP, which is an intact mouse endogenous retrovirus, in our cells. This finding not only informs studies of Piwil proteins in organisms where piRNAs are not found but also adds another level of regulation to these restriction factors. Thus, transcriptional and translational effects of Piwil proteins could synergize for more-efficient protection of the genome from these mobile genetic elements in the germ line. Furthermore, their expression following cell activation could also protect the genome of rapidly dividing cells from such inadvertent expression and movement of endogenous retrotransposons and retroviruses.
Finally, manipulating the balance of rare tRNAs might represent an attractive antiviral strategy (30). Should lower levels of these rare tRNAs be sufficient for host cell homeostasis but not support optimal viral replication, one could envision engineering a slower progression of disease, leading to more-robust antiviral immune responses. This could result in the creation of new elite controllers, who would be able to go for long periods of time without aggressive antiretroviral therapies. Possibly, introducing AS oligonucleotides or genetically inactivating some but not all of these tRNAs would achieve these goals.
MATERIALS AND METHODS
Cell culture, plasmids, antibodies, and siRNA.
Human embryonic kidney 293 cells transformed with large T antigen (293T) and HeLa cells were maintained at 37°C with 5% CO2 in Dulbecco's modification of Eagle's medium (DMEM) containing 10% fetal bovine serum (FBS) and 100 mM l-glutamine. Jurkat cells were maintained at 37°C with 5% CO2 in RPMI medium 1640 containing 10% FBS and 100 mM l-glutamine. 293T cells stably expressing mouse mili.EGFP fusion protein were a kind gift from Dubravka Pezic and Alexei Aravin (California Institute of Technology). Trima residuals from healthy donors (from the Trima aphoresis collection and enriched for PBMCs) were obtained from Blood Center of the Pacific (San Francisco, CA). PBMCs were then plated at 5 × 10⁶ cells/ml in 24-well plates, using RPMI 10% human serum Ab. After 30 min, nonadherent cells (peripheral blood lymphocytes [PBLs]) were isolated and cultured in complete RPMI medium (containing 10% FBS, 100 mM l-glutamine, and 100 μg/ml streptomycin) with 30 units/ml interleukin-2 (IL-2) (Roche Applied Science). After isolation, PBLs (107) were activated with 5 μg/ml PHA and 30 units/ml IL-2 for 2 days. CD4+ T cells were selected from bulk PBMCs using negative bead selection (Dynal CD4+ untouched beads; Invitrogen). CD4+ T cells were maintained for 24 h in RPMI 1640 medium–10% FBS–30 units/ml IL-2 at 37°C with 5% CO2 before activation and expansion using anti-CD3/anti-CD28 Dynabeads (Invitrogen).
The human hili gene was cloned downstream of oligonucleotides corresponding to the FLAG epitope-tagged peptide or upstream of a red fluorescent protein (RFP) gene into pcDNA 3.1 plasmid vector. pNL-GFP RRE splice acceptor [RRE(SA)] and pNL4-3-ΔE-EGFP were kind gifts from Manqing Li and Michael David (University of California, San Diego [UCSD]). Ago2-EGFP plasmid was obtained from Addgene. Reporter pNL4-3.luciferase (Luc) plasmid was obtained from the NIH AIDS Reagent Program. pFL was obtained from Kyoji Horie and has been described previously (31). Anti-Piwil 2 antibody (H00055124-B03P) was purchased from Abnova. Anti-GFP antibody (A11122) and antitubulin (32-2500) were purchased from Life Technologies. Anti-HIV Gag p24 (MAB7360) and anti-HIV Gag p55 (RK-65-014) were purchased from R&D Systems and MBL International Corporation, respectively. Anti-IAP Gag antibodies were a kind gift from Bryan Cullen (32). Small interfering RNA (siRNA) against Hili (4390771) and control siRNA (AM4635) were purchased from Ambion.
Luciferase and fluorescence assays.
293T cells growing in log phase were transfected with reporter pNL4-3.Luc plasmids with X-tremeGENE HP DNA transfection reagent (Roche). Luciferase activity in the cell lysate was determined 24 h later using a luciferase assay system (Promega) according to the manufacturer's instructions. Data were normalized with the protein concentrations of the cell lysates. Fluorescence microscopic analyses on pFL-expressing cells were performed as described previously (33).
Viral infectivity assays.
293T cells or 293T cells stably expressing mili.EGFP (293T.mili) were transfected with the reporter pNL4-3.Luc plasmids (1 μg) and empty vector (C) (1 μg) or the plasmid encoding FLAG.hili (1 μg) with 6 μl X-tremeGENE HP DMA transfection reagent. At 24 h after transfection, the culture supernatants were collected. The amounts of HIV particles produced from the cells were determined by Gag p24 ELISA (Cell Technologies). The same volumes of culture supernatants were added to TZM-bl cells containing Tat-driven luciferase reporter gene and CD4, and luciferase activities were measured 24 h after the addition of supernatants to determine the amount of infectious viruses. Relative levels of infectivity of HIV produced from cells with or without ectopic expression of Hili or Mili were determined by calculating the ratio between the luciferase activity and total viral production.
RNA-IP.
293T.mili cells were UV irradiated (400 J/m2) to cross-link protein and RNAs. Cells were lysed in radioimmunoprecipitation assay (RIPA) buffer (25 mM Tris-HCl [pH 7.6], 150 mM NaCl, 1% NP-40, 1% sodium deoxycholate, 0.1% SDS) containing protease and RNase inhibitors. Cell lysates were incubated with anti-Piwil 2, anti-GFP, or normal rabbit IgG precoupled with protein A-conjugated Dynabeads (Life Technologies). After extensive washing of the beads with RIPA buffer, RNAs bound to the beads were isolated by incubation with 20 μg proteinase K (New England Biolabs) in the presence of RNase inhibitors for 1 h at 55°C followed by phenol-chloroform extraction and ethanol precipitation. The purified RNAs were separated in a 15% TBE-urea gel and visualized with Sybr gold reagent (Life Technologies). Yeast tRNA and an RNA ladder (Biooscientific) were used as size markers.
Quantitative reverse transcriptase PCR (RT-qPCR) analysis.
Total RNA was extracted using TRIzol reagent (Invitrogen), treated with Turbo DNase (Ambion), and subjected to reverse transcription using a SuperScript III First Strand system (Invitrogen) and random hexamers to produce cDNA. Real-time PCR was performed using a Stratagene Mx3004P real-time PCR system and SensiFAST Sybr green reagents (Bioline) following the manufacturer's protocol. Results were normalized to the levels of GAPDH (glyceraldehyde-3-phosphate dehydrogenase). Control reaction mixtures lacking reverse transcriptase (RT-minus) were routinely incorporated and indicated at least 10-fold-lower signal in all experiments. The primer sequences used in this study were as follows: hili primers, forward, 5′-TTGTCTGCTAATCTGGTACGC-3′, reverse, 5′-CATCTGAACTCCCTCTTCCAAG-3′; GFP primers, forward, 5′-CTGGAGTTGTCCCAATTCTTG-3′, reverse, 5′-TCACCCTCTCCACTGACAGA-3′; EGFP primers, forward, 5′-CAGCAGAACACCCCCATC-3′, reverse, 5′-TGGGTGCTCAGGTAGTGGTT-3′; GAPDH primers, forward, 5′-CCTGTCCTGTGTGCTGTAAT-3′, reverse, 5′-GAGAATGTGTATTGGCCTGGA-3′; and IAP-gag primers, F, 5′-ACC CAG GAA GCA GTC AGA GA-3′; R, 5′-CCT TTA GGG CTT GAG CAC AG-3′.
Genetic inactivation of Hili.
For siRNA knockdown, 293T, HeLa, or Jurkat cells were transfected with siRNA aganst Hili or with control siRNA (40 nM) using Lipofectamine RNAiMax (Invitrogen). At 24 h after tranfection, the reporter pNL4-3 Luc plasmid was transfected with X-tremeGENE HP DNA transfection reagent. At 24 h after transfection of the reporter plasmid, culture supernatants were collected and viral production was quantified by Gag p24 ELISA. RNA or protein expression of Hili was measured by RT-qPCR or Western blot analysis, respectively.
UV cross-linking immunoprecipitation followed by tRNA microarray (Clip-chip).
The tRNA species that interacted specifically with Hili were determined by Clip-chip experiments as previously described (22). 293T.mili cells were UV irradiated (400 mJ/cm2 at 254 nm). Anti-Piwil 2 antibodies were used to immunoprecipitate associated RNA species. RNA species were subjected to tRNA microarray analysis as described before (34–36). Briefly, immunoprecipitated RNAs were released from protein A beads and the RNAs were recovered by ethanol precipitation. The RNA was subjected to 3′-end 32P labeling using [5′-32P]pCp and T4 RNA ligase. The 32P-labeled mixture was directly analyzed using 10% denaturing PAGE and purified 32P-labeled yeast tRNAPhe as a size control. To analyze the 32P-labeled RNA by tRNA microarray, the corresponding tRNA-sized bands were cut out of the gel and eluted with crush and soak buffer (50 mM KOAc–200 mM KCl, pH 7.0) at 4°C overnight. The eluted RNA was recovered by ethanol precipitation and dissolved in water. tRNA microarray preparation, hybridization, and data analyses were performed according to methods described previously (22, 34).
tRNA sequencing and analysis.
Total RNA was extracted from 293T cells and was used to construct a transcriptome library using a NEBNext Small RNA Library Prep Set for Illumina (Multiplex Compatible) (catalog no. E7330S; New England Biolabs). The constructed library was analyzed for small RNA using a HiSeq 2000 next-generation platform at BGI-Tech. The (paired-end) sequencing read length of the library was 100 bp. Raw FASTQ reads were mapped to human reference genome with tophat (v2.0.10). The parameters were set as following: tophat -p 16 –solexa1.3-quals –segment-length 30 –segment-mismatches 2 -r 20 –mate-std-dev 20 –library-type fr-unstranded –o outdir ref.fa in.fq.gz. The results were stored in bam format. cufflinks (v2.0.2) was used to calculate the refseq gene expression. The parameters were set as follows: -u -p 6 –G tRNA.gtf –b hg19.fasta –o outdir sample.bam. The tRNA results (expressed as fragments per kilobase per million [FPKM]) were stored in FPKM tracking format. R software (R-2.15.3) was used to do tRNA content analysis. Reads mapped to the tRNA regions of interest were calculated as percentages of total uniquely mapped reads.
Antisense tRNA assays.
293T cells were grown in 24-well culture plates for 24 h prior to transfection. Cells were then transfected with the reporter pNL4-3.Luc plasmid (0.5 μg) and 4 μg of antisense oligonucleotide DNA corresponding to the anti-codon region of tRNAArg(UCU) (TAGAAGTCCAATGCGCTATCCATTGCG) or a randomized negative control (AGTCTTATGCTTGCCCAGCAGGCTAAA). At 24 h after transfection, virus production in culture supernatants was quantified by Gag p24 ELISA, and luciferase activity in cell lysates were measured as described previously (37). Gag p24 levels were normalized to luciferase activities. Relative levels of targeted tRNA were measured after antisense transfection by RT-qPCR analysis using specific primers (forward, 5′-TAGAAGTCCAATGCGCTATCCATTGCG; reverse, 5′-TGGGATTCGAACCCACAACCTCTGGAT), and cell viability was measured by counting live cells by trypan blue exclusion.
Reverse transcription assay.
A reverse transcription assay was performed as described previously (33).
Statistical analysis.
For p24 ELISA, luciferase enzymatic assays, GFP assays, microscopic analyses, and RT-qPCR measurements, 3 independent experiments were performed in duplicate. Thus, bars represent standard errors of the means (SEM) (n = 3). A Student's t test was performed to measure the significance of the data (*, P < 0.05; **, P < 0.01; ***, P < 0.001).
ACKNOWLEDGMENTS
We are grateful to other members of the laboratory for help with the work and discussions of the manuscript. In addition, we thank Dubravka Pezic, Alexei Aravin, Manqin Li, Michael David, Bryan Cullen, and Kyoji Horie for reagents.
This work was supported by the following grants from the National Institutes of Health: R01 AI49104 to B.M.P., P50 GM082250 to Alan Frankel (University of California, San Francisco [UCSF]), and U19 AI076113 to David Margolis (University of North Carolina [UNC]). P.L. was supported by a fellowship from the CFAR grant P30 AI027763 to Paul Volberding (UCSF). K.F. was supported by a grant from CHRP ID13-SF-558.
B.M.P., T.P., and K.F. were responsible for the conception and design of the study, acquisition of the data, analysis and interpretation, and drafting and revising of the manuscript. P.L., X.W., D.C., W.S., M.L., and T.H. were responsible for acquisition of the data, analysis and interpretation, and drafting of the manuscript.
We declare that we have no competing financial interests.
REFERENCES
- 1.Sharp PM, Hahn BH. 2010. The evolution of HIV-1 and the origin of AIDS. Philos Trans R Soc Lond B Biol Sci 365:2487–2494. doi: 10.1098/rstb.2010.0031. [DOI] [PMC free article] [PubMed] [Google Scholar]
- 2.Li M, Kao E, Gao X, Sandig H, Limmer K, Pavon-Eternod M, Jones TE, Landry S, Pan T, Weitzman MD, David M. 2012. Codon-usage-based inhibition of HIV protein synthesis by human Schlafen 11. Nature 491:125–128. doi: 10.1038/nature11433. [DOI] [PMC free article] [PubMed] [Google Scholar]
- 3.Malim MH, Bieniasz PD. 2012. HIV restriction factors and mechanisms of evasion. Cold Spring Harb Perspect Med 2:a006940. doi: 10.1101/cshperspect.a006940. [DOI] [PMC free article] [PubMed] [Google Scholar]
- 4.Rosa A, Chande A, Ziglio S, De Sanctis V, Bertorelli R, Goh SL, McCauley SM, Nowosielska A, Antonarakis SE, Luban J, Santoni FA, Pizzato M. 2015. HIV-1 Nef promotes infection by excluding SERINC5 from virion incorporation. Nature 526:212–217. doi: 10.1038/nature15399. [DOI] [PMC free article] [PubMed] [Google Scholar]
- 5.Usami Y, Wu Y, Gottlinger HG. 2015. SERINC3 and SERINC5 restrict HIV-1 infectivity and are counteracted by Nef. Nature 526:218–223. doi: 10.1038/nature15400. [DOI] [PMC free article] [PubMed] [Google Scholar]
- 6.Kane M, Yadav SS, Bitzegeio J, Kutluay SB, Zang T, Wilson SJ, Schoggins JW, Rice CM, Yamashita M, Hatziioannou T, Bieniasz PD. 2013. MX2 is an interferon-induced inhibitor of HIV-1 infection. Nature 502:563–566. doi: 10.1038/nature12653. [DOI] [PMC free article] [PubMed] [Google Scholar]
- 7.Lin YZ, Sun LK, Zhu DT, Hu Z, Wang XF, Du C, Wang YH, Wang XJ, Zhou JH. 2016. Equine Schlafen 11 restricts the production of equine infectious anemia virus via a codon usage-dependent mechanism. Virology 495:112–121. doi: 10.1016/j.virol.2016.04.024. [DOI] [PubMed] [Google Scholar]
- 8.Aravin AA, Hannon GJ, Brennecke J. 2007. The piwi-piRNA pathway provides an adaptive defense in the transposon arms race. Science 318:761–764. doi: 10.1126/science.1146484. [DOI] [PubMed] [Google Scholar]
- 9.Ishizu H, Siomi H, Siomi MC. 2012. Biology of PIWI-interacting RNAs: new insights into biogenesis and function inside and outside of germlines. Genes Dev 26:2361–2373. doi: 10.1101/gad.203786.112. [DOI] [PMC free article] [PubMed] [Google Scholar]
- 10.Juliano C, Wang J, Lin H. 2011. Uniting germline and stem cells: the function of piwi proteins and the piRNA pathway in diverse organisms. Annu Rev Genet 45:447–469. doi: 10.1146/annurev-genet-110410-132541. [DOI] [PMC free article] [PubMed] [Google Scholar]
- 11.Tushir JS, Zamore PD, Zhang Z. 2009. SnapShot: mouse piRNAs, PIWI proteins, and the ping-pong cycle. Cell 139:830–830 e831. doi: 10.1016/j.cell.2009.10.042. [DOI] [PubMed] [Google Scholar]
- 12.Holoch D, Moazed D. 2015. RNA-mediated epigenetic regulation of gene expression. Nat Rev Genet 16:71–84. doi: 10.1038/nrg3863. [DOI] [PMC free article] [PubMed] [Google Scholar]
- 13.Ross RJ, Weiner MM, Lin H. 2014. PIWI proteins and PIWI-interacting RNAs in the soma. Nature 505:353–359. doi: 10.1038/nature12987. [DOI] [PMC free article] [PubMed] [Google Scholar]
- 14.He G, Chen L, Ye Y, Xiao Y, Hua K, Jarjoura D, Nakano T, Barsky SH, Shen R, Gao JX. 2010. Piwil2 expressed in various stages of cervical neoplasia is a potential complementary marker for p16. Am J Transl Res 2:156–169. [PMC free article] [PubMed] [Google Scholar]
- 15.Liu JJ, Shen R, Chen L, Ye Y, He G, Hua K, Jarjoura D, Nakano T, Ramesh GK, Shapiro CL, Barsky SH, Gao JX. 2010. Piwil2 is expressed in various stages of breast cancers and has the potential to be used as a novel biomarker. Int J Clin Exp Pathol 3:328–337. [PMC free article] [PubMed] [Google Scholar]
- 16.Lu Y, Zhang K, Li C, Yao Y, Tao D, Liu Y, Zhang S, Ma Y. 2012. Piwil2 suppresses p53 by inducing phosphorylation of signal transducer and activator of transcription 3 in tumor cells. PLoS One 7:e30999. doi: 10.1371/journal.pone.0030999. [DOI] [PMC free article] [PubMed] [Google Scholar]
- 17.Couvillion MT, Bounova G, Purdom E, Speed TP, Collins K. 2012. A Tetrahymena piwi bound to mature tRNA 3′ fragments activates the exonuclease Xrn2 for RNA processing in the nucleus. Mol Cell 48:509–520. doi: 10.1016/j.molcel.2012.09.010. [DOI] [PMC free article] [PubMed] [Google Scholar]
- 18.Couvillion MT, Sachidanandam R, Collins K. 2010. A growth-essential Tetrahymena piwi protein carries tRNA fragment cargo. Genes Dev 24:2742–2747. doi: 10.1101/gad.1996210. [DOI] [PMC free article] [PubMed] [Google Scholar]
- 19.Keam SP, Young PE, McCorkindale AL, Dang TH, Clancy JL, Humphreys DT, Preiss T, Hutvagner G, Martin DI, Cropley JE, Suter CM. 2014. The human piwi protein Hiwi2 associates with tRNA-derived piRNAs in somatic cells. Nucleic Acids Res 42:8984–8995. doi: 10.1093/nar/gku620. [DOI] [PMC free article] [PubMed] [Google Scholar]
- 20.Thomson T, Lin H. 2009. The biogenesis and function of PIWI proteins and piRNAs: progress and prospect. Annu Rev Cell Dev Biol 25:355–376. doi: 10.1146/annurev.cellbio.24.110707.175327. [DOI] [PMC free article] [PubMed] [Google Scholar]
- 21.Suzuki R, Honda S, Kirino Y. 2012. PIWI expression and function in cancer. Front Genet 3:204. doi: 10.3389/fgene.2012.00204. [DOI] [PMC free article] [PubMed] [Google Scholar]
- 22.Parisien M, Wang X, Perdrizet G II, Lamphear C, Fierke CA, Maheshwari KC, Wilde MJ, Sosnick TR, Pan T. 2013. Discovering RNA-protein interactome by using chemical context profiling of the RNA-protein interface. Cell Rep 3:1703–1713. doi: 10.1016/j.celrep.2013.04.010. [DOI] [PMC free article] [PubMed] [Google Scholar]
- 23.Zheng G, Qin Y, Clark WC, Dai Q, Yi C, He C, Lambowitz AM, Pan T. 2015. Efficient and quantitative high-throughput tRNA sequencing. Nat Methods 12:835–837. doi: 10.1038/nmeth.3478. [DOI] [PMC free article] [PubMed] [Google Scholar]
- 24.Abdel-Mohsen M, Raposo RA, Deng X, Li M, Liegler T, Sinclair E, Salama MS, Ghanem Hel D, Hoh R, Wong JK, David M, Nixon DF, Deeks SG, Pillai SK. 2013. Expression profile of host restriction factors in HIV-1 elite controllers. Retrovirology 10:106. doi: 10.1186/1742-4690-10-106. [DOI] [PMC free article] [PubMed] [Google Scholar]
- 25.Watts JM, Dang KK, Gorelick RJ, Leonard CW, Bess JW Jr, Swanstrom R, Burch CL, Weeks KM. 2009. Architecture and secondary structure of an entire HIV-1 RNA genome. Nature 460:711–716. doi: 10.1038/nature08237. [DOI] [PMC free article] [PubMed] [Google Scholar]
- 26.Douek DC, Picker LJ, Koup RA. 2003. T cell dynamics in HIV-1 infection. Annu Rev Immunol 21:265–304. doi: 10.1146/annurev.immunol.21.120601.141053. [DOI] [PubMed] [Google Scholar]
- 27.Matsumoto N, Nishimasu H, Sakakibara K, Nishida KM, Hirano T, Ishitani R, Siomi H, Siomi MC, Nureki O. 2016. Crystal structure of silkworm PIWI-clade argonaute Siwi bound to piRNA. Cell 167:484–497.e9. doi: 10.1016/j.cell.2016.09.002. [DOI] [PubMed] [Google Scholar]
- 28.Peng JC, Lin H. 2013. Beyond transposons: the epigenetic and somatic functions of the piwi-piRNA mechanism. Curr Opin Cell Biol 25:190–194. doi: 10.1016/j.ceb.2013.01.010. [DOI] [PMC free article] [PubMed] [Google Scholar]
- 29.Sobala A, Hutvagner G. 2011. Transfer RNA-derived fragments: origins, processing, and functions. Wiley Interdiscip Rev RNA 2:853–862. doi: 10.1002/wrna.96. [DOI] [PubMed] [Google Scholar]
- 30.Kobayashi H. 2015. Inducible suppression of global translation by overuse of rare codons. Appl Environ Microbiol 81:2544–2553. doi: 10.1128/AEM.03708-14. [DOI] [PMC free article] [PubMed] [Google Scholar]
- 31.Saito ES, Keng VW, Takeda J, Horie K. 2008. Translation from nonautonomous type IAP retrotransposon is a critical determinant of transposition activity: implication for retrotransposon-mediated genome evolution. Genome Res 18:859–868. doi: 10.1101/gr.069310.107. [DOI] [PMC free article] [PubMed] [Google Scholar]
- 32.Dewannieux M, Dupressoir A, Harper F, Pierron G, Heidmann T. 2004. Identification of autonomous IAP LTR retrotransposons mobile in mammalian cells. Nat Genet 36:534–539. doi: 10.1038/ng1353. [DOI] [PubMed] [Google Scholar]
- 33.Lu C, Luo Z, Jager S, Krogan NJ, Peterlin BM. 2012. Moloney leukemia virus type 10 inhibits reverse transcription and retrotransposition of intracisternal A particles. J Virol 86:10517–10523. doi: 10.1128/JVI.00868-12. [DOI] [PMC free article] [PubMed] [Google Scholar]
- 34.Pavon-Eternod M, Gomes S, Geslain R, Dai Q, Rosner MR, Pan T. 2009. tRNA over-expression in breast cancer and functional consequences. Nucleic Acids Res 37:7268–7280. doi: 10.1093/nar/gkp787. [DOI] [PMC free article] [PubMed] [Google Scholar]
- 35.Dittmar KA, Goodenbour JM, Pan T. 2006. Tissue-specific differences in human transfer RNA expression. PLoS Genet 2:e221. doi: 10.1371/journal.pgen.0020221. [DOI] [PMC free article] [PubMed] [Google Scholar]
- 36.Netzer N, Goodenbour JM, David A, Dittmar KA, Jones RB, Schneider JR, Boone D, Eves EM, Rosner MR, Gibbs JS, Embry A, Dolan B, Das S, Hickman HD, Berglund P, Bennink JR, Yewdell JW, Pan T. 2009. Innate immune and chemically triggered oxidative stress modifies translational fidelity. Nature 462:522–526. doi: 10.1038/nature08576. [DOI] [PMC free article] [PubMed] [Google Scholar]
- 37.Pak V, Eifler TT, Jager S, Krogan NJ, Fujinaga K, Peterlin BM. 2015. CDK11 in TREX/THOC regulates HIV mRNA 3′ end processing. Cell Host Microbe 18:560–570. doi: 10.1016/j.chom.2015.10.012. [DOI] [PMC free article] [PubMed] [Google Scholar]