Abstract
Aim:
The present study focuses on analyzing the effects of Sudarshan Kriya yoga (SKY) on EEG as well as ECG signals for stress regulation. To envision the regulation of stress Determination Test (DT) has been used. We have chosen a control group for contriving a cogent comparison that could be corroborated using statistical tests.
Subjects and Methods:
A total of 20 subjects were taken in the study, of which 10 were allotted to a control group. Electroencephalograph was taken during a DT task, before and after SKY the sky session with 30 days of SKY session given to the experimental group. No SKY was given to the control group.
Results:
We quantified mental stress using EEG, ECG and DT synergistically and used SKY to regulate it. We observed that alpha band power decreases in the frontal lobe of the brain with increasing mental stress while frontal brain asymmetry decreases with increasing stress tolerance.
Conclusions:
These EEG, ECG and DT shows a significant decrement in mental stress and improvement in cognitive performance after SKY, indicating SKY as a good alternative of medication for stress management.
Keywords: Artificial neural network, cognition, determination test, electrocardiogram, electroencephalogram, frontal brain asymmetry, mental stress, Poincare plot, reactive stress tolerance, Sudarshan Kriya Yoga
Introduction
Modern life, driven by advances in technology and capitalistic approach is becoming full of hassles, leading to uncommon mental stresses and social frustrations. It has been reported by Casey[1] and Salomon and Vella[2] in 2012 that the number of stress victims is growing at an alarming rate indicating stress to become a global problem by the 21st century. Along with several reports on mental stress and depression worldwide, a recent report by Towers Watson “The Business Value of a Healthy Workforce: 2013/2014 Staying at Work Survey Report” on May 6, 2014, presents a very critical scene of mental stress in our society. According to Towers Watson, stress is the number one lifestyle risk factor, ranking above physical inactivity and obesity. The countless deadlines of the tasks at workplace, unstable economies, frequent traveling, and odd hours of working are contributing to increased mental stress level in the society. According to Roozendaal et al. 2009, it is an emotional strain resulted from psychophysiological responses to perceive demands and pressures.[3] One can parameterize the stress as a stimulus that produces a negative emotional reaction including fear and loss of control.[4] Recent developments in technology enabled to quantify many psychophysiological changes related to mental stress using electroencephalogram (EEG), MEG, functional near-infrared spectroscopy, functional magnetic resonance imaging, ECG, and skin conductance or other psychological tests[5,6] which use different parameters and algorithms to recognize stress.
Due to its higher temporal resolution,[7] EEG is an important noninvasive method for studying the transient dynamics of the human brain's neuronal circuitry and it provides good observational data of variability in different mental states. As stress affects neural activity, EEG signals could be used as a better tool to quantify it. It consists several frequency bands, i.e., delta (0.5–4 Hz), theta (4–8 Hz), alpha (8–12 Hz), beta (13–30 Hz), gamma (30–100 Hz) which are affected by different conscious states. Out of these sub-bands, alpha wave (8–12 Hz) is associated with idleness of our brain; it shows the best correlation with mental stress.[8] Wheeler et al. (1990, 1993) showed the inverse relation between alpha band power and its corresponding activation in the brain.[8] Thus, as mental stress level increases, the alpha activity in the brain also increases resulting the decrement of alpha band power. The other sub-band theta power is found to be increasing with increasing level of stress.[9] Increase in alpha power reflects to relax and conscious conditions while decrease of alpha power and increase of beta power indicates that the subject is under intense activity.[9] Alpha waves are more active in frontal and occipital lobes of the brain. Stress due to tension, excitement, and anxiety has high power of beta band.[10] Beta waves show varying behavior in different parts of the brain.[5]
Frontal brain asymmetry (FBA) is also a prominent tool for mental stress as well as emotion recognition. Wheeler et al., Niemiec and Lithgow[8,9] studied the brain asymmetry and quantified emotion on the basis of alpha band power ratio between left-right frontal lobes. The relative increase of alpha band power in the left frontal lobe indicates negative emotions (mental stress, sorrow, disgusted) while in the right frontal lobe indicates positive emotions (joy, surprise).[8] Asymmetry in brain activity also indicates some mental problems such as fatigues, depression, stress, emotional-inconsistence.
Besides brain, heart also shows significant functional variation due to some psychological situations and its functioning is affected by mental stress.[11,12] We analyzed Poincare plot for ECG's RR interval for mental stress recognition.
Sudarshan Kriya Yoga (SKY) is a powerful rhythmic breathing technique that balances the autonomic nervous system and influences psychophysiological disorders. SKY includes Sudarshan kriya, Bhastrika pranayama, and Yoga nidra and is an integral part of art of living (AOL) programs. Today, its effectiveness is universally acclaimed that it reduces stress, anger, anxiety, and depression bringing one in a pleasant state.[13,14]
There are many published works related to stress recognition by EEG[3,4,5,6,7,8] and ECG.[11,12] However, a very few combined study of EEG and ECG have been done with SKY and mental stress.[13] A combined study of both brain and cardio signals will lead to increase accuracy and reliability of experiment and would be synergetic to each other. It also shows the interrelation between brain and heart functions during mental stress. We assessed neurophysiologic features of twenty subjects for stress recognition and showed the effect of SKY on those. We observed that SKY plays an important role in stress reduction. This paper presents a cross-validation among determination test (DT)-scores,[6] EEG power spectrum, and ECG features in different mental stress states. Along with these, an objective study of SKY has been done to evaluate its benefits in stress reduction and improving stress tolerance.
Method
Experimental setup
First, EEG and ECG signals were recorded from twenty healthy human subjects (ten male and ten female), aged between 21 and 30 (mean 26.3) years. All subjects were right-handed, nonsmoker, free from health problems and having normal temperature, blood pressure, and vision. EEG signals were collected using low-cost, portable and wireless 14 channels Emotiv Epoc instrument [Figure 1] with sampling frequency of 128 Hz. ECG data were recorded using two channels with Biopac MP150 wireless system on sampling rate of 500 Hz.
Figure 1.
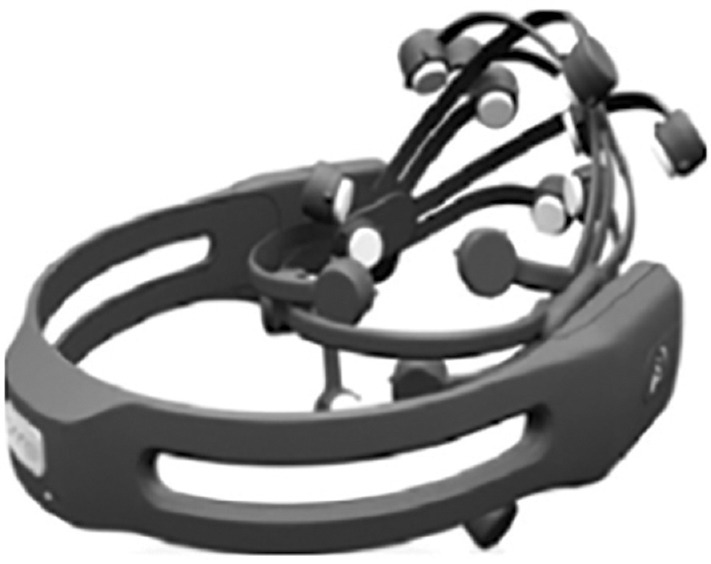
Emotiv
Data acquisition
As a controlled experiment, the psychophysiological signals (DT score, EEG, and ECG) for all subjects before SKY session were acquired in an acoustically and electrically shielded chamber. Initially, each subject filled a consent form having some lifestyle questionnaires. Then he was sat on a nonconducting comfortable chair in front of a computer having DT. The baseline EEG data was recorded for 5 min. EEG data for all the subjects during the DT have been recorded. Further, all subjects were given SKY session for 30 days for 1 h daily under the guidance of a trainer from AOL society. After 30 days of SKY session, post psychophysiological data of all subjects were recorded and compared with their prerecorded data. All the experimental procedures were approved by the ethics committee at Institute of Nuclear Medicine and Allied Sciences, Defence Research and Development Organization. The complete experimental methodology is shown in Figure 2.
Figure 2.

Methodology for experimental group
Analysis of psycho-physiological data
Out of 14 Emotiv channels, we considered 6 most prominent channels of frontal lobe,[8,9] namely, AF3, AF4, F7, F8, F3, and F4 to study the alpha power and its ratio between left and right frontal lobes. The recorded signals were analyzed off-line in MATLAB.
Analysis of electroencephalogram signals
These 6-channel EEG signals were de-noised using wavelets technique[15,16] to enhance the information embedded. Second order Butterworth band-pass filter was used here to select the interested frequency range (band-limiting). The filtered signals were held at a threshold between −100 μV and +100 μV[17] to avoid over-amplitude spikes due to noise. Then obtained signals were segmented for the baseline and DT. Now these signals were decomposed by wavelet packet decomposition [Figure 3] using db4 for separation of alpha band to study the variations.[18]
Figure 3.
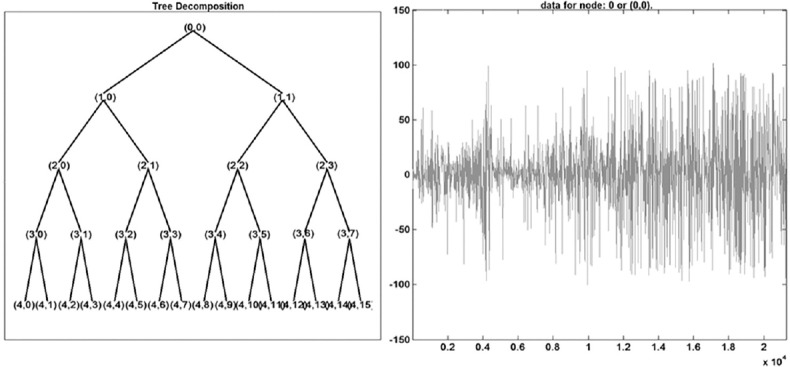
Wavelet packet decomposition tree plot in MATLAB of a particular electroencephalogram channel
Feature extraction from electroencephalogram signals
The alpha power of all the 6 channels for baseline and DT in both pre- and post-conditions were calculated by Welch method[19] implemented in MATLAB, Figure 4. The alpha band power ratio between left and right frontal lobes were calculated by the following equation:
Figure 4.
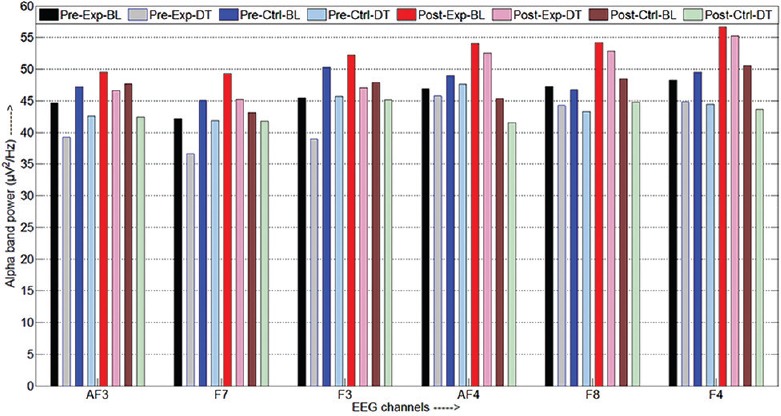
Alpha power variation before and after Sudarshan Kriya Yoga for AF3, F7, F3, AF4, F8, F4 electrodes

where Rα is the alpha power ratio and αAF4, αF8, αF4; αAF3, αF7, αF3 are alpha power of the corresponding EEG channels.
We compared the pre-values of alpha band power to corresponding post one for analyzing the changes in their mental stress level. Figure 5 illustrates the changes of Rα for all subjects from pre- to post-condition.
Figure 5.
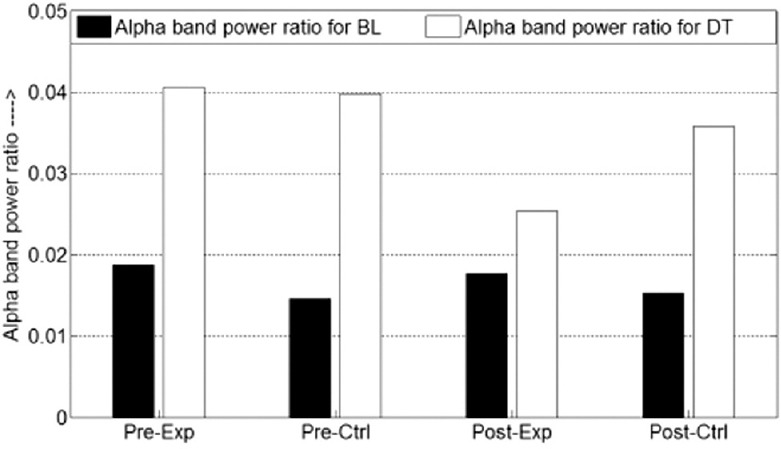
Rα for baseline (BL) and determination test (DT)
Poincare plot of heart rate variability (electrocardiogram) analysis
We analyzed single lag Poincare plot[20] between RRI(n) and RRI(n+1) to study the changes in the dynamic nature of the heart after SKY session. In plot Figure 6a, the points above the line of identity (diagonal line) indicate RRIs that are longer than the previous. Figure 6b and c show the heart rate variability (HRV) of an arbitrary subject before the SKY session.
Figure 6.
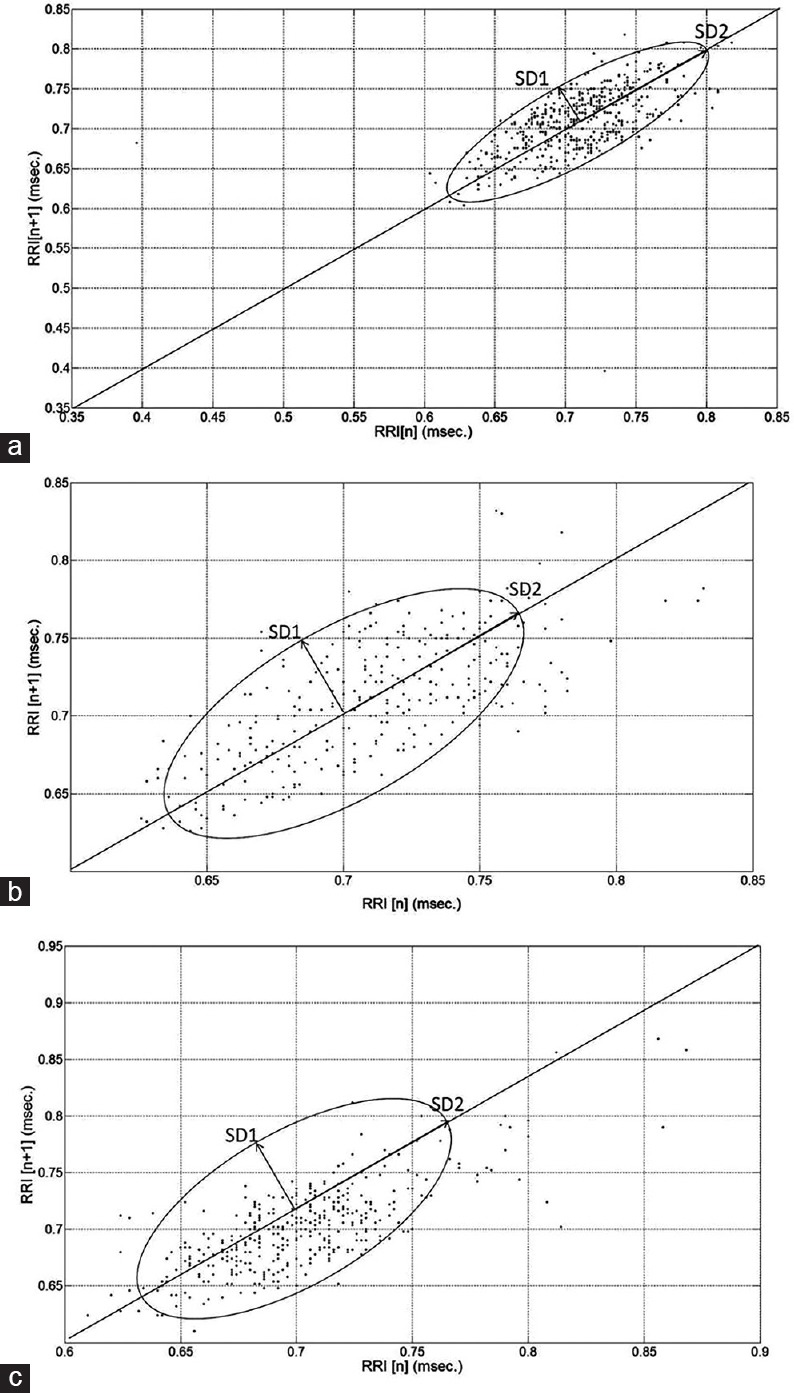
(a) Standard Poincare plot (b) Poincare plot before Sudarshan Kriya Yoga (c) Poincare plot after Sudarshan Kriya Yoga
Determination test score analysis
DT is a mental stress simulator as well as a physiological test by Vienna Test System.[12] Depending on the stimulus/reaction mode, there are four types if scoring in DT, namely, Average response/reaction time, number of total responses, number of delayed responses, and number of omitted reactions. Figure 7 shows the comparison between pre- and post-scores of DT indicating significant improvement in responses.
Figure 7.
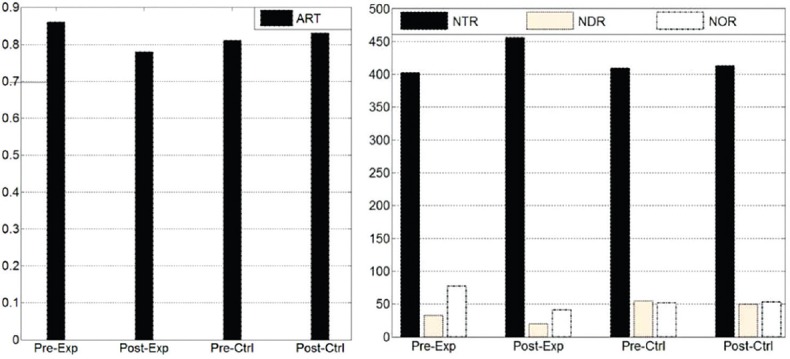
Comparison of responses on determination test in pre and post for number of total reaction (NTR), number of delayed reaction (NDR), number of omitted reactions (NOR) and average reaction time (ART)
Statistical analysis
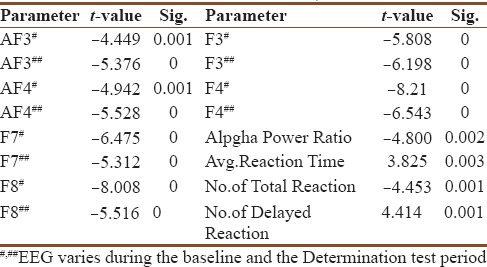
The statistical analysis of observed parameters of the experiments is done in SPSS software (IBM, NY). We calculated the t-value and significance of the data variation between pre- and post-conditions which are shown in Table 1. Here, the negative sign of t-value shows the increment in the post while positive sign for the decrement in postcompare to precondition. The weight of t-value shows the variation of a feature for different subjects in a particular class. The significance shows that how much a parameter variation is significant during the experiment (in pre- and post-conditions). The smaller value of significant represents the better variation.
Table 1.
Statistical analysis of observed feature (baseline, determination test)
Classification
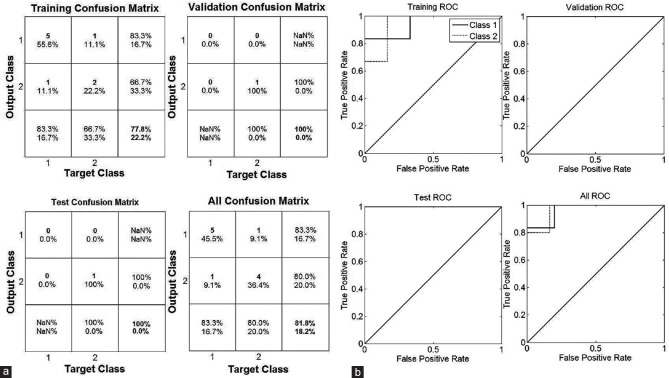
Classification is a very important and challenging task to recognize the pattern of variation. Here, we used Artificial Neural Network to classify the subjects among stressed and nonstressed on the basis of the features having high significance. We used the alpha band power of AF3, AF4, F7, F8, F3, F4; Rα and RR interval as input vector to train the model and got 81.8% accuracy by taking all subjects at a time [Figure 8]. The target vector was set on the basis of the questionnaire form filled during signal acquisition.
Figure 8.
(a) Classification of subjects in stressed and nonstressed group before Sudarshan Kriya Yoga session: Confusion matrix (b) classification of subjects in stressed and nonstressed group before Sudarshan Kriya Yoga session: Receiver operating characteristic
Results
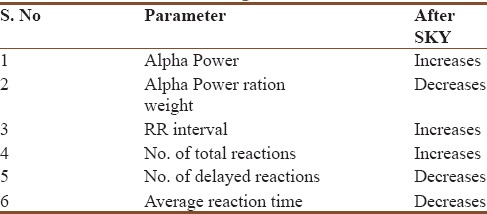
In this combined study of EEG and ECG along with DT we got that alpha power increased while alpha power ratio decreased in frontal lobe after SKY session. The increased RR interval of ECG could be seen easily in Poincare plot. In DT the average reaction time and number of delayed were found decreased while number of total responses was found increased as compared to before SKY session [Table 2].
Table 2.
Variations of different psycho-physiological features during mental stress
Discussion
In case of EEG, we can see from Figure 4a–f that the alpha power decreased from baseline to DT for all of the six electrodes, i.e., as stress level increases, power of alpha decreases. However, it shows a relative increase after the SKY under the same DT test. It indicates that under the same stressor task, the brain can bear more stress after the exposure of SKY, i.e., stress tolerance increases. In Figure 5, the negative values of the alpha band power ratio (Rα), during the DT, indicates that the subjects were in stress, but their values (weights) in post condition (after SKY) decreased compared to the precondition which showed that FBA during a stressor task decreased after SKY. Here, we got small changes in FBA in the case of some subjects (such as 2, 6, and 8) while greater changes in some of them (such as 7, 9, 10, and 11). This irregular variation could be justified by the self-assessment questionnaire (consent form) which they filled before the tests. As per that subjects 2, 6, and 8 felt less stressed during DT task even before the SKY session and subjects 7, 9, 10, and 11 felt more stressed as compared to the others. After SKY, significant changes were found in all of them, but more stressed subjects were more benefitted as compared to the less stressed.
In case of ECG before SKY, the Poincare plot shows more dispersion of RR data points from the line of identity indicating more variations in heart rate variability HRV but after SKY, the accumulation RR data points increases near line of identity showing that variation in RR interval decreases, i.e. the function of heart is going to be more relaxed, and the stress tolerance increases.
In DT scores, the average response time and delayed reactions decrease while the total number of responses during the task increases after SKY session, i.e., it is going to be easier to handle the task after the session. Thus, after SKY session, the stress tolerance increases.
Conclusion
In summary, we found from the experiment that both brain and heart functions are affected by mental stress, and combined features provide a more effective tool to recognize the mental stress. Furthermore, SKY is a very effective stress reducer. It improves human stress tolerance and enhances cognitive performance.
Financial support and sponsorship
Nil.
Conflicts of interest
There are no conflicts of interest.
References
- 1.Casey L. Stress and Wellbeing in Australia in 2012: A State-of-the-Nation Survey. Australian Physiological Society. 2012:1–47. [Google Scholar]
- 2.Salomon M, Vella A. Stress in America: Our health at risk. Monitor on Psychology. 2012;43:1–73. [Google Scholar]
- 3.Roozendaal B, McEwen BS, Chattarji S. Stress, memory and the amygdala. Nat Rev Neurosci. 2009;10:423–33. doi: 10.1038/nrn2651. [DOI] [PubMed] [Google Scholar]
- 4.Hamid NH, Sulaiman N, Aris SA, Murat ZH. Evaluation of Human Stress using EEG Power Spectrum. IEEE International Conference on Signal and Image Processing Application; 2010. pp. 263–6. [Google Scholar]
- 5.Dedovic K, Renwick R, Mahani NK, Engert V, Lupien SJ, Pruessner JC. The montreal imaging stress task: Using functional imaging to investigate the effects of perceiving and processing psychosocial stress in the human brain. J Psychiatry Neurosci. 2005;30:319–25. [PMC free article] [PubMed] [Google Scholar]
- 6.Schuhfried G. Vienna Test System, Psychological Assessment. [Last accessed on 2015 Nov 9]. Available from: http://www.schuhfried.com .
- 7.Mullinger KJ, Castellone P, Bowtell R. Best current practice for obtaining high quality EEG data during simultaneous fMRI. J Visual Exp. 2013;76:1–10. doi: 10.3791/50283. [DOI] [PMC free article] [PubMed] [Google Scholar]
- 8.Wheeler RE, Davidson RJ, Tomarken AJ. Frontal brain asymmetry and emotional reactivity: A biological substrate of affective style. Psychophysiology. 1993;30:82–9. doi: 10.1111/j.1469-8986.1993.tb03207.x. [DOI] [PubMed] [Google Scholar]
- 9.Niemiec AJ, Lithgow BJ. Alpha-band characteristics in EEG spectrum indicate reliability of frontal brain asymmetry measures in diagnosis of depression in 27th Annual International Conference of the Engineering in Medicine and Biology Society. Shanghai, China: IEEE; 2006. [DOI] [PubMed] [Google Scholar]
- 10.Sulaiman N, Hamid NH, Murat ZH, Taib MN. Initial Investigation of Human Physical Stress Level using Brainwaves. IEEE Student Conference Research and Development; 2009. pp. 230–3. [Google Scholar]
- 11.Goshvarpoura A, Goshvarpoura A, Rahatib S. Analysis of lagged Poincare plots in heart rate signals during meditation. Dig Sig Proc. 2011;21:208–14. [Google Scholar]
- 12.Ranganathan G, Rangarajan R, Bindhu V. Evaluation of ECG Signals for mental stress assessment using fuzzy technique. Int J Soft Comput Eng. 2011;1:195–201. [Google Scholar]
- 13.Brown RP, Gerbarg PL. Sudarshan Kriya yogic breathing in the treatment of stress, anxiety, and depression: Part I-neurophysiologic model. J Altern Complement Med. 2005;11:189–201. doi: 10.1089/acm.2005.11.189. [DOI] [PubMed] [Google Scholar]
- 14.Naga Venkatesha Murthy PJ, Janakiramaiah N, Gangadhar BN, Subbakrishna DK. P300 amplitude and antidepressant response to Sudarshan Kriya Yoga (SKY) J Affect Disord. 1998;50:45–8. doi: 10.1016/s0165-0327(98)00029-9. [DOI] [PubMed] [Google Scholar]
- 15.Quian Quiroga R, Garcia H. Single-trial event-related potentials with wavelet denoising. Clin Neurophysiol. 2003;114:376–90. doi: 10.1016/s1388-2457(02)00365-6. [DOI] [PubMed] [Google Scholar]
- 16.Mamun M, Al-Kadi M, Marufuzzaman M. Effectiveness of wavelet denoising on electroencephalogram signals. J App Res Tech. 2013;11:156–60. [Google Scholar]
- 17.Teplan M. Fundamentals of EEG measurement. Meas Sci Rev. 2002;2:1–11. [Google Scholar]
- 18.Jones K, Begleiter H, Porjesz B, Wang K, Chorlian D. Complexity measures of event related potential surface Laplacian data calculated using the wavelet packet transform. Brain Topogr. 2002;14:333–44. doi: 10.1023/a:1015708928892. [DOI] [PubMed] [Google Scholar]
- 19.Zhao L, He Y. Power spectrum estimation of the welch method based on imagery EEG. App Mecha Mater. 2013;278-280:1260–4. [Google Scholar]
- 20.Brennan M, Palaniswami M, Kamen P. Poincaré plot interpretation using a physiological model of HRV based on a network of oscillators. Am J Physiol Heart Circ Physiol. 2002;283:H1873–86. doi: 10.1152/ajpheart.00405.2000. [DOI] [PubMed] [Google Scholar]


