

Abstract
Assessment of renal function with magnetic resonance imaging (MRI) has been actively explored in the past decade. In this review, we introduce the principle of MRI, and review recent progress of MRI methods (contrast-enhanced and non-contrast) in assessing renal function. Contrast-enhanced MRI using ultra-low dose of gadolinium-based agent has been validated for measuring single-kidney glomerular filtration rate (GFR) and renal plasma flow (RPF) accurately. For routine functional test, contrast-enhanced MRI may not replace the simple serum-creatinine method. However, for patients with renal diseases, it is often worthy to perform MRI to accurately monitor renal function, particularly for the diseased kidney. As contrast-enhanced MRI is already an established clinical tool for characterizing renal structural abnormalities, including renal mass and ureteral obstruction, it is possible to adapt the clinical MRI protocol to measure single-kidney GFR and RPF, as demonstrated by recent studies. What makes MRI unique is the promise of its non-contrast methods. These methods include arterial spin labeling (ASL) for tissue perfusion, blood oxygen level dependent (BOLD) for blood and tissue oxygenation, and diffusion weighted imaging (DWI) for water diffusion. For each method, we reviewed recent findings, and summarized challenges.
Keywords: magnetic resonance imaging, glomerular filtration rat, tissue oxygenation, tissue perfusion, diffusion coefficient
The term “functional MRI” was coined to denote brain magnetic resonance imaging (MRI) for investigating brain activation 1, but in this article is used for MRI that studies tissue function, as opposed to structural MRI. Functional MRI of the kidneys started early, e.g. Prasad et al in 1996 2, but its early development was slow. In the past 10–15 years, functional MRI of the kidneys has progressed rapidly, partially due to the awareness that progressive renal dysfunction is a significant health problem and accurate characterization by non-invasive imaging tool would be valuable. The MRI methods include gadolinium-contrast enhanced technique and vast choices of non-contrast techniques. With the methods, multiple functional parameters of the kidneys can be estimated, including glomerular filtration rate (GFR), renal plasma flow (RPF), water diffusion, and tissue oxygenation. These parameters would enable characterization of chronic kidney diseases with much more confidence than simply serum-based GFR or urine test. In the following, we start with a brief introduction of MRI basics; then for each MRI method, we briefly introduce the principle, review new studies in the past 2–3 years, and lastly suggest future work. This review will not cover structural MRI for the kidneys, such as renal masses and ureteral obstruction, but we do realize the value and the feasibility of incorporating the functional methods into current structural MRI protocols for these diseases. Readers should also read other reviews written in recent years 3–5.
Principle of MRI
MRI images are formed of radio-frequency (RF) signals originated from atoms with odd number of protons; for clinical imaging, the most widely explored atom is hydrogen. Each hydrogen atom has a magnetic moment, a property that makes the atom behave like a tiny magnetic needle. Specifically, when placed in magnetic field of a MRI scanner, magnetic moments of hydrogen atoms, or magnetization, are aligned to the direction of the magnetic field. We define this original direction as z-axis. To emit signals, the atoms need to be first excited by RF pulses, which are produced by RF coils (part of MR hardware). When calibrated to the right frequency, RF pulse is able to tilt the magnetic moments of hydrogen atoms away from their original direction, so that the magnetization has a non-zero component in the x–y plane. The atoms are now ‘excited’, or in a high-energy state. With the RF pulse switched off, the excited moments would recover to their original direction, a process called ‘relaxation’ that usually takes few seconds. The relaxation process can be decomposed into a) recovery of the z-component of magnetization (quantified by spin-lattice relaxation time T1, Fig. 1A) and b) decay of the x–y component (quantified by spin-spin relaxation time T2, Fig. 1B). It is the relaxation process that differentiates hydrogen in different tissue types, e.g. fat versus muscle. In other words, different types of tissues have different values of T1 and of T2. For structural imaging, contrast between different tissues of interest can be created in the acquired images, by properly selecting acquisition parameters to make the acquired signals T1- or T2-weighted. For quantitative analysis, images with different T1 or T2 weighting are collected and then are processed to generate a map of T1 or T2. One major application of T1 mapping is dynamic contrast-enhanced MRI, where concentration of contrast in tissue is estimated by the T1-shortening effect of the contrast. More details of contrast-enhanced MRI are given in section “contrast-enhanced MRI”. What makes MRI versatile, and unique among all imaging modalities, is its capability of sensitizing to multiple physiologic processes in tissue. In the following we will give more details of both contrast-enhanced and non-contrast MRI techniques, and review their applications in renal function assessment.
Fig. 1.
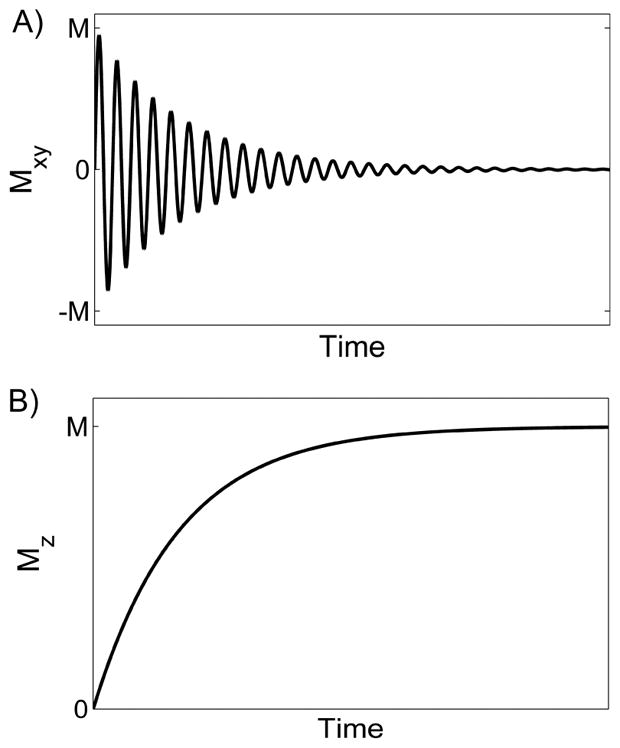
Magnetization relaxation after 90° excitation. A) The x–y component of the magnetization, Mxy, decays exponentially, characterized by spin-spin relaxation time T2. B) The z-component, Mz, is zero immediately after the excitation, and recovers to its pre-excitation state. The recovery process is characterized by spin-lattice relaxation time T1.
Contrast-enhanced MRI
Contrast-enhanced MRI is widely used in clinical practice, not for assessing renal function, but for detecting and characterizing structural abnormalities such as renal masses and ureteral diseases. In the following, we introduce the principle of contrast-enhanced MRI, its typical protocol, and then review its progress based on recent studies.
The idea of injecting exogenous contrast to enhance imaging is widely adopted for many imaging modalities, and for the kidneys, the most established technique is planar scintigraphy using technetium-99m diethylenetriamine-pentaacetic acid (DTPA) or mercaptoacetyltriglycine (MAG3). Compared to renal scintigraphy, contrast-enhanced MRI has multiple advantages. First, MRI can achieve high spatial resolution (~1 mm3), and covers the entire 3-dimensional (3D) volume of the kidneys. Second, MRI uses non-radioactive contrast agent, and 1/5–1/4 of clinical dosage is adequate for functional assessment of the kidneys. Here is the typical protocol most studies used. Via an antecubital vein, contrast agent is injected using an automatic power injector with flow rate of 2–4 ml/second. Typical dose of 0.025–0.05 mmol/kg is much lower than clinically recommended dose of 0.1 mmol/kg, because kidneys have high blood perfusion. Also, one can choose to use body-weight calibrated dosage (e.g. 0.025 mmol/kg) or fixed volume (e.g. 4 ml). One reason that many clinical studies preferred body-weight calibrated dosage is that with such dosage, arterial contrast concentration would be relatively consistent between subjects of different size. Nowadays such consideration is not necessary for contrast-enhanced MRI, as arterial input function (AIF) can be directly sampled from the dynamic images and then we remove its impact from tissue contrast enhancements in post-processing 6. The injected contrast circulates in the heart and the lungs, and then enters the kidneys through renal arteries. This is the first pass of the contrast in the circulation system, followed by later passes when the contrast returns to the heart by veins. To record the process, multiple MRI images are acquired, from the instant of contrast injection to several minutes afterwards. All the images cover the same field of view, over the kidneys and the abdominal aorta (for AIF). Representative images are displayed in Fig. 2. To resolve the first-pass peak in AIF and in kidney contrast enhancement curves, the imaging should be fast enough (2–4 sec/image), and continue for the initial period (~30 sec) after contrast injection. As contrast concentration in the later passes does not change as quickly as in the first pass, the imaging can be performed with a slower speed, e.g. one image per one minute. To avoid respiratory motion, the subject is usually asked to hold breath whenever the imaging is on. The most used sequences for renal contrast-enhanced MRI include spoiled gradient recalled echo (or termed as FLASH) 7, 8, and ultrafast gradient echo (prepared with an initial 180° pulse) 9, 10. More recent research on fast acquisition sequences are introduced in next section. In post-processing of the dynamic images, multiple physiologic parameters can be obtained. The first step of the postprocessing is to extract contrast enhancement curves from kidney tissue and from an aortic region (for AIF), using image segmentation methods. AIF is the temporal profile of contrast concentration in the flowing blood through aorta or artery. Renal enhancement curve records the uptake and excretion of contrast agent by the kidneys, and the shape of the curve is determined by RPF, GFR and tubular transit time. For example, a high value of GFR would lead to a high contrast concentration in the kidney during the tubular phase (from ~30 sec to few minutes after contrast injection). To quantify these parameters from the curve, one can use proper tracer kinetic model 7, 8, 11.
Fig. 2.

Representative contrast-enhanced images, acquired with 3D spoiled gradient recalled echo sequence. A) A coronal image acquired before contrast injection; B) when the first bolus of contrast reached the renal cortex; C) when contrast reached tubules and collecting ducts; D) when contrast reached renal pelvis.
Free-breathing acquisition has been achieved for contrast-enhanced MRI of the kidneys in the past 2–3 years. As we introduced above, in most protocols patients are asked to hold breath during imaging to avoid respiratory motion. One innovative approach is to use radial sampling in MRI image acquisition. The method has been shown to outperform conventional Cartesian sampling in reducing the impact of respiratory motion 12. Acquiring spoiled gradient echo signals with a stack-of-stars sampling trajectory and reconstructing images using 3D through-time radial generalized autocalibrating partial parallel acquisition (GRAPPA) method, Wright et al 13 achieved free-breathing 3D acquisition with spatial resolution of 2.2–2.3 mm3 and temporal resolution of 2.1–2.9 sec/frame. Riffel et al 14 employed a similar stack-of-stars radial sampling in data acquisition, and demonstrated the high flexibility of retrospectively choosing desired balance between temporal and spatial resolutions. However, a study comparing the radial and the Cartesian samplings for a group of healthy subjects 15 found that GFR estimated from the radial sampling was significantly lower than conventional Cartesian-sampling acquisition (70±30 versus 103±11 ml/min/1.73m2). In their shown example, we note that there seems to be a systematic bias between the signals acquired by the two sampling methods. Further work is needed to accurately quantify contrast concentration from radial-sampling MR signals. Other techniques were also applied in recent studies to achieve free-breathing acquisition. For patients with renal masses, Winter et al 16 used a view-sharing method, time-resolved angiography with stochastic trajectories (TWIST), to achieve dynamic imaging with spatial resolution of 2.6×2.6×2.6 mm3 and temporal resolution of 2.5 sec. Boss et al 17 used a more traditional method, navigator gating, to achieve free-breathing acquisition for pediatric patients.
There is a trend in incorporating functional assessment into established clinical MRI protocols for patients with renal diseases. For patients with ureter diseases, Boss et al 17 proposed a new MR urography protocol consisting of both 2D and 3D acquisitions. The fast 2D imaging provided estimate of split renal function and of urinary excretion, and the high-resolution 3D images gave confident structural delineation of ureteropelvic junction obstruction. As another innovative protocol for MR urography, Krepkin et al 18 performed functional MR renography with low dose of contrast (4 ml Gd-DTPA), and then acquired three high-resolution anatomic images after injection of the remainder of the standard dose. The timing of the three anatomic acquisitions was determined from the initial dynamic imaging to achieve best effect. For patients with renal mass, contrast-enhanced MRI is the routine test for characterizing and monitoring renal mass. Without changing the image-acquisition protocol, one can estimate tumor perfusion and permeability-surface area product (PS) from renal mass of the images, and quantify GFR and RPF from non-tumor kidney tissues of the same data 16. An accurate assessment of remaining renal function is extremely important to predict outcome of a possible nephrectomy.
As a conclusion, contrast-enhanced MRI provides an accurate assessment of renal function, by using only 3–4 ml contrast agent (1/5~1/4 of clinical dosage). Such low dosage may lower the risk of nephrogenic systemic fibrosis (NSF) 19. While the widely used blood-sample method for estimating GFR 20 may not be as accurate, it is extremely simple and inexpensive and thus suffices as a preliminary test. Hence, contrast-enhanced MRI would not be able to replace the blood-sample test for all patients, but would find its value in accurately assessing renal function for patients with renal diseases such as renal mass, urologic disease and renal allografts. For most these applications, contrast-enhanced MRI is already the standard diagnostic tool, so it is feasible to incorporate the functional test into the current protocol.
Non-contrast MRI
MRI is capable of sensitizing to multiple tissue properties without injecting exogenous contrast, even though the non-contrast techniques have not developed to a stage comparable to contrast-enhanced MRI. In the following, we briefly review three most popular noncontrast methods for functional kidney imaging.
Arterial spin labeling (ASL) aims to measure blood perfusion without using exogenous contrast. In ASL acquisition, arterial blood is ‘labeled’ by exciting it with RF pulses. The labeled blood flows into the kidney, resembling exogenous contrast. However, what makes labeled blood different from exogenous contrast is that the excited magnetization of the labeled blood would relax within few seconds. In other words, the labeled blood loses its contrast against kidney tissue within few seconds. This makes ASL only suitable for probing renal perfusion, but not later processes such as glomerular filtration. The other challenge is that signals from the static kidney tissue need to be removed. For this, an image without exciting arterial blood is acquired, and subtraction of the two images with and without labeling would result in an image enhanced with only the excited arterial blood. The most popular ASL technique for kidney imaging is flow-sensitive alternating inversion recovery (FAIR) 21, 22. To quantify tissue perfusion from ASL images, Buxton et al 23 proposed a tracer kinetic method by treating labeled blood as contrast and considering its T1 relaxation. However, most studies used a simplified exponential formula with a few assumptions.
Renal blood flow measured with ASL was recently validated by comparing against contrast-enhanced MRI. Cutajar et al 24 showed that for a group of healthy subjects, ASL-measured renal blood flow was comparable to contrast-enhanced measures (263±41 vs 287±70 ml/min/100g), and had better day-to-day reproducibility than the latter. Conlin et al 25 performed the comparison between ASL and the contrast-enhanced method in both healthy subjects and patients with estimated GFR 46–93 ml/min. The averaged difference between RPF measured by the two methods was 9 ml/min. It is noted that Conlin et al reformulated Buxton’s tracer kinetic method into a linear form to improve estimation precision.
Without using exogenous contrast, ASL was applied for patients with chronic kidney diseases (CKD) and patients with renal allografts. With ASL, Gillis et al 22 detected a significantly lower perfusion in patients with low eGFR (39.9±25.2 ml/min/1.73m2), as compared to age-matched healthy controls (223±75 vs 366±79 ml/min). Note that for many of the patients, estimated GFR was lower than 30 ml/min/1.73m2, so contrast-enhanced MRI is not recommended. In a mouse model of allograft rejection with marked fibrosis 26, ASL detected a significant reduction in renal perfusion, compared to normally functional allograft (56±7 vs 293±44 ml/min/100g). Applying the same ASL method to patients with renal allografts, Hueper et al 27 observed lower perfusion in transplanted kidney with delayed graft function than in normally functional ones (231±15 vs 331±15 ml/min/100g), and such reduced perfusion predicted reduced renal function at 12 months after transplantation.
Despite its promise and the encouraging studies, ASL has not yet developed into a reliable tool for quantitative measurement of renal perfusion. The major challenge with kidney ASL is respiratory motion. As we discussed above, processing of ASL images requires subtraction of two images acquired separately. Any motion between the two images would result in an artifact much stronger than the weak ASL signal. In the future, we expect more innovative acquisition techniques to be invented to improve ASL.
Blood oxygen level dependent (BOLD) is a promising MRI technique for assessing tissue oxygenation non-invasively. BOLD images are acquired with gradient echo sequence. Gradient echo signals are sensitive to magnetic-field inhomogeneity induced by deoxyhemoglobin (dHb). Hemoglobins in red blood cells transport oxygen from the lungs to all other organs. When hemoglobin releases its carried oxygen molecules, irons in hemoglobin are left with unpaired electrons, making the entire hemoglobin molecule (or dHb) paramagnetic. When placed in a magnetic field such as an MRI scanner, the paramagnetic dHb perturbs the field by creating an additional spatially inhomogeneous field around itself. Such field inhomogeneity makes water molecules in a voxel de-phase faster, and thus the acquired gradient-echo signals decay faster with echo time (TE). By acquiring the signals with different TE values, we can fit the signals with an exponential decay function to estimate another relaxation-time parameter T2* (or relaxation rate R2* = 1/T2*) 1, 2. A map of R2* can be computed from a set of BOLD images. High R2* indicates fast signal decay, thus high field inhomogeneity, which in turn corresponds to high amount of dHb and probably low tissue oxygenation. BOLD imaging of the kidneys has been heavily explored, because renal hypoxia has been identified as the central cause for CKD 28, 29. Early studies successfully validated the sensitivity of BOLD signals to diuretic-induced changes of renal oxygenation in healthy human subjects 30–32. Reduced renal blood flow in healthy subjects by continuous angiotensin-II infusion 33 correlated with the GFR/RPF to cortical R2* ratio. As GFR and RPF represent oxygen consumption and delivery respectively, their ratio should directly relate to how much oxygen is left, or tissue oxygenation. Hence, in such controlled experiment, R2* precisely reflected tissue oxygenation. A similar observation was reported in an earlier abstract 34.
The BOLD technique has been applied to multiple kidney diseases. A new application was pediatric subjects with reflux nephropathy 35. With reflux nephropathy, cortical and medullary R2* were lower, and furosemide-induced reduction in medullary R2* was lower, compared to healthy subjects. As low R2* is conventionally interpreted as high tissue oxygenation, the authors concluded that renal hypoxia is not the main culprit implicated in pediatric reflux nephropathy. We would be more cautious in making such conclusion, as the relationship between R2* and tissue oxygenation is complicated by many factors. Similar findings were observed with adult patients before and after removal of acute obstruction of the upper urinary tract 36. Within six months after the removal, cortical R2* increased to normal level, and medullary R2* increased slightly. Related to this result is an established relationship between obstructive nephropathy and tubulointerstitial fibrosis 37. The major applications of BOLD are still in CKD and renal allograft. In patients with renal allografts 38, cortical and medullary R2* were lower in the allografts with delayed function (eGFR ~37.6 ml/min/1.73m2) than in the functional allografts (eGFR ~80.5 ml/min/1.73m2). The study did not find significant differences in R2* between the allografts with acute rejection and those with acute tubular necrosis (the two major causes for delayed graft function). Prasad et al 39 compared R2* between adult CKD patients and age-matched healthy controls, and found that CKD had higher cortical R2* and comparable medullary R2*, compared to the healthy ones. This result contradicted prior studies. The authors offered a number of explanations, including variance in fluid intake before BOLD scan and different stages of CKD between the studies. We do note that the patients recruited in Prasad’s study had more advanced stage of CKD, as indicated by much smaller size of the kidneys, while the studies we reviewed above are either acute diseases or renal allografts.
Inconsistent BOLD results with CKD have been documented by other previous studies. For example, in a study consisting of 195 human subjects 40, BOLD-measured R2* correlated poorly with estimated GFR. A probable explanation for the inconsistent results is that BOLD-measured R2*, as an estimator of tissue oxygenation, is confounded by many other factors. These confounding factors may vary among the stages of CKD. Niendorf et al 41 presented an excellent review on this topic by discussing all relevant findings and identifying major confounding factors. Zhang et al 42 proposed a computational model for considering the factors in computing renal oxygenation from BOLD data. Future studies are needed to find out which confounding factors are more relevant and determine an optimal MRI protocol for quantifying renal tissue oxygenation.
Diffusion weighted imaging (DWI) measures water diffusion in tissue, and also has potential in estimating blood perfusion. To acquire DWI images, two gradient pulses (field gradients turned on for a predefined period) are applied before imaging. The first gradient pulse is to dephase the water molecules in tissues of interests, and the second gradient pulse with the same magnitude but opposite direction, rephases the water molecules. If the water molecules do not move at all, the dephasing and rephasing process does not change the magnitude of the generated signals; with water diffusion, water molecules dephase and rephase at different positions (with different field strength), and the generated signal would be lower. In other words, the signal decays due to water diffusion. Apparent diffusion coefficient (ADC) can be computed by fitting an exponential function to DWI signals. As the kidney has very high blood flow and high vascular volume, the effect of blood perfusion is detectable in DWI signals (the famous “intravoxel incoherent motion” or IVIM phenomenon 43), and a bi-exponential analysis can be applied to quantify both water diffusion and perfusion-related parameters 44. One problem with DWI, compared to other non-contrast MRI methods, is that there is no gold standard technique to verify the DWI-measured ADC. Without established tools, we have little knowledge on the impact of renal diseases on water diffusion in renal tissue. Nevertheless, MR researchers put much effort in probing renal tissue with DWI.
Because of its non-invasiveness, DWI has been mostly applied to assess renal allograft. Park et al 38 observed lower cortical and medullary ADC in renal allografts with delayed function, compared to functional ones, but did not find significant difference between those with acute rejection and with accurate tubular necrosis. This was confirmed in a more controlled mouse model of allograft rejection 26. Fan et al 45 found a significant positive correlation between estimated GFR and renal ADCs; in comparing allografts with stable function and age-matched healthy controls, the former had higher medullary ADC but lower cortical ADC. A significant correlation between cortical diffusion coefficient and estimated GFR was also observed in a pig model of renal artery stenosis 46. The other major application of DWI is in unilateral ureteral obstruction (UUO). In a mouse study 47, UUO induced renal fibrosis and reduction in glomeruli, and DWI detected decreases in both diffusion coefficient and perfusion fraction. Similar results were found in patients with acute UUO 36, by comparing DWI before and after removal of UUO. While all the above studies indicate that DWI-measured diffusion coefficient is associated with renal functional impairment, good correlation was not detected between the DWI parameters and contrast-enhanced MRI measured GFR and RPF 48. This discouraging result could be due to high estimation errors of the parameters, or as the authors suggested that water diffusion is more independent of GFR or RPF than we imagine.
Conclusion
Contrast-enhanced MRI has been developed into a reliable tool for measuring multiple functional parameters of the kidneys. The method takes only a small dose of contrast, and can be possibly incorporated into clinical MRI protocol of many renal diseases such as renal mass and obstructive uropathy. Non-contrast MRI methods are promising in measuring multiple aspects of renal physiology. Their value in assessing renal allograft and CKD would be enormous. However, more work, particularly in data interpretation, is needed to make the non-contrast methods more reliable and meaningful.
Clinical summary.
Contrast-enhanced MRI is an accurate tool for assessing renal function, and can be incorporated into clinical MRI protocol of renal mass and ureteral obstruction.
Non-contrast MRI methods hold much promise in non-invasive assessment of multiple aspects of renal function; more work is needed for quantifying physiologic parameters from the MRI data.
Footnotes
Publisher's Disclaimer: This is a PDF file of an unedited manuscript that has been accepted for publication. As a service to our customers we are providing this early version of the manuscript. The manuscript will undergo copyediting, typesetting, and review of the resulting proof before it is published in its final citable form. Please note that during the production process errors may be discovered which could affect the content, and all legal disclaimers that apply to the journal pertain.
References
- 1.Ogawa S, Lee TM, Kay AR, et al. Brain magnetic resonance imaging with contrast dependent on blood oxygenation. Proceedings of the National Academy of Sciences of the United States of America. 1990;87:9868–9872. doi: 10.1073/pnas.87.24.9868. [DOI] [PMC free article] [PubMed] [Google Scholar]
- 2.Prasad PV, Edelman RR, Epstein FH. Noninvasive evaluation of intrarenal oxygenation with BOLD MRI. Circulation. 1996;94:3271–3275. doi: 10.1161/01.cir.94.12.3271. [DOI] [PubMed] [Google Scholar]
- 3.Ebrahimi B, Textor SC, Lerman LO. Renal relevant radiology: renal functional magnetic resonance imaging. Clin J Am Soc Nephrol. 2014;9:395–405. doi: 10.2215/CJN.02900313. [DOI] [PMC free article] [PubMed] [Google Scholar]
- 4.Takahashi T, Wang F, Quarles CC. Current MRI techniques for the assessment of renal disease. Curr Opin Nephrol Hypertens. 2015;24:217–223. doi: 10.1097/MNH.0000000000000122. [DOI] [PMC free article] [PubMed] [Google Scholar]
- 5.Xie L, Bennett KM, Liu C, et al. MRI tools for assessment of microstructure and nephron function of the kidney. American journal of physiology. 2016;311:F1109–F1124. doi: 10.1152/ajprenal.00134.2016. [DOI] [PMC free article] [PubMed] [Google Scholar]
- 6.Zhang JL, Rusinek H, Bokacheva L, et al. Use of cardiac output to improve measurement of input function in quantitative dynamic contrast-enhanced MRI. J Magn Reson Imaging. 2009;30:656–665. doi: 10.1002/jmri.21891. [DOI] [PMC free article] [PubMed] [Google Scholar]
- 7.Zhang JL, Rusinek H, Bokacheva L, et al. Functional assessment of the kidney from magnetic resonance and computed tomography renography: impulse retention approach to a multicompartment model. Magn Reson Med. 2008;59:278–288. doi: 10.1002/mrm.21489. [DOI] [PMC free article] [PubMed] [Google Scholar]
- 8.Buckley DL, Shurrab AE, Cheung CM, et al. Measurement of single kidney function using dynamic contrast-enhanced MRI: comparison of two models in human subjects. J Magn Reson Imaging. 2006;24:1117–1123. doi: 10.1002/jmri.20699. [DOI] [PubMed] [Google Scholar]
- 9.Sourbron SP, Michaely HJ, Reiser MF, et al. MRI-measurement of perfusion and glomerular filtration in the human kidney with a separable compartment model. Investigative radiology. 2008;43:40–48. doi: 10.1097/RLI.0b013e31815597c5. [DOI] [PubMed] [Google Scholar]
- 10.Vivier PH, Storey P, Rusinek H, et al. Kidney function: glomerular filtration rate measurement with MR renography in patients with cirrhosis. Radiology. 2011;259:462–470. doi: 10.1148/radiol.11101338. [DOI] [PMC free article] [PubMed] [Google Scholar]
- 11.Tofts PS, Cutajar M, Mendichovszky IA, et al. Precise measurement of renal filtration and vascular parameters using a two-compartment model for dynamic contrast-enhanced MRI of the kidney gives realistic normal values. Eur Radiol. 2012;22:1320–1330. doi: 10.1007/s00330-012-2382-9. [DOI] [PubMed] [Google Scholar]
- 12.Lin W, Guo J, Rosen MA, et al. Respiratory motion-compensated radial dynamic contrast-enhanced (DCE)-MRI of chest and abdominal lesions. Magn Reson Med. 2008;60:1135–1146. doi: 10.1002/mrm.21740. [DOI] [PMC free article] [PubMed] [Google Scholar]
- 13.Wright KL, Chen Y, Saybasili H, et al. Quantitative high-resolution renal perfusion imaging using 3-dimensional through-time radial generalized autocalibrating partially parallel acquisition. Investigative radiology. 2014;49:666–674. doi: 10.1097/RLI.0000000000000070. [DOI] [PMC free article] [PubMed] [Google Scholar]
- 14.Riffel P, Zoellner FG, Budjan J, et al. “One-Stop Shop”: Free-Breathing Dynamic Contrast-Enhanced Magnetic Resonance Imaging of the Kidney Using Iterative Reconstruction and Continuous Golden-Angle Radial Sampling. Investigative radiology. 2016;51:714–719. doi: 10.1097/RLI.0000000000000299. [DOI] [PubMed] [Google Scholar]
- 15.Eikefjord E, Andersen E, Hodneland E, et al. Use of 3D DCE-MRI for the estimation of renal perfusion and glomerular filtration rate: an intrasubject comparison of FLASH and KWIC with a comprehensive framework for evaluation. AJR Am J Roentgenol. 2015;204:W273–281. doi: 10.2214/AJR.14.13226. [DOI] [PubMed] [Google Scholar]
- 16.Winter KS, Helck AD, Ingrisch M, et al. Dynamic contrast-enhanced magnetic resonance imaging assessment of kidney function and renal masses: single slice versus whole organ/tumor. Investigative radiology. 2014;49:720–727. doi: 10.1097/RLI.0000000000000075. [DOI] [PubMed] [Google Scholar]
- 17.Boss A, Martirosian P, Fuchs J, et al. Dynamic MR urography in children with uropathic disease with a combined 2D and 3D acquisition protocol--comparison with MAG3 scintigraphy. Br J Radiol. 2014;87:20140426. doi: 10.1259/bjr.20140426. [DOI] [PMC free article] [PubMed] [Google Scholar]
- 18.Krepkin K, Won E, Ramaswamy K, et al. Dynamic contrast-enhanced MR renography for renal function evaluation in ureteropelvic junction obstruction: feasibility study. AJR Am J Roentgenol. 2014;202:778–783. doi: 10.2214/AJR.13.11321. [DOI] [PubMed] [Google Scholar]
- 19.Grobner T. Gadolinium--a specific trigger for the development of nephrogenic fibrosing dermopathy and nephrogenic systemic fibrosis? Nephrol Dial Transplant. 2006;21:1104–1108. doi: 10.1093/ndt/gfk062. [DOI] [PubMed] [Google Scholar]
- 20.Levey AS, Bosch JP, Lewis JB, et al. A more accurate method to estimate glomerular filtration rate from serum creatinine: a new prediction equation. Modification of Diet in Renal Disease Study Group. Annals of internal medicine. 1999;130:461–470. doi: 10.7326/0003-4819-130-6-199903160-00002. [DOI] [PubMed] [Google Scholar]
- 21.Kim SG. Quantification of relative cerebral blood flow change by flow-sensitive alternating inversion recovery (FAIR) technique: application to functional mapping. Magn Reson Med. 1995;34:293–301. doi: 10.1002/mrm.1910340303. [DOI] [PubMed] [Google Scholar]
- 22.Gillis KA, McComb C, Patel RK, et al. Non-Contrast Renal Magnetic Resonance Imaging to Assess Perfusion and Corticomedullary Differentiation in Health and Chronic Kidney Disease. Nephron. 2016;133:183–192. doi: 10.1159/000447601. [DOI] [PubMed] [Google Scholar]
- 23.Buxton RB, Frank LR, Wong EC, et al. A general kinetic model for quantitative perfusion imaging with arterial spin labeling. Magn Reson Med. 1998;40:383–396. doi: 10.1002/mrm.1910400308. [DOI] [PubMed] [Google Scholar]
- 24.Cutajar M, Thomas DL, Hales PW, et al. Comparison of ASL and DCE MRI for the non-invasive measurement of renal blood flow: quantification and reproducibility. Eur Radiol. 2014;24:1300–1308. doi: 10.1007/s00330-014-3130-0. [DOI] [PubMed] [Google Scholar]
- 25.Conlin CC, Oesingmann N, Bolster B, Jr, et al. Renal plasma flow (RPF) measured with multiple-inversion-time arterial spin labeling (ASL) and tracer kinetic analysis: Validation against a dynamic contrast-enhancement method. Magn Reson Imaging. 2016;37:51–55. doi: 10.1016/j.mri.2016.11.010. [DOI] [PMC free article] [PubMed] [Google Scholar]
- 26.Hueper K, Hensen B, Gutberlet M, et al. Kidney Transplantation: Multiparametric Functional Magnetic Resonance Imaging for Assessment of Renal Allograft Pathophysiology in Mice. Investigative radiology. 2016;51:58–65. doi: 10.1097/RLI.0000000000000205. [DOI] [PubMed] [Google Scholar]
- 27.Hueper K, Gueler F, Brasen JH, et al. Functional MRI detects perfusion impairment in renal allografts with delayed graft function. American journal of physiology. 2015;308:F1444–1451. doi: 10.1152/ajprenal.00064.2015. [DOI] [PubMed] [Google Scholar]
- 28.Fu Q, Colgan SP, Shelley CS. Hypoxia: The Force that Drives Chronic Kidney Disease. Clinical medicine & research. 2016;14:15–39. doi: 10.3121/cmr.2015.1282. [DOI] [PMC free article] [PubMed] [Google Scholar]
- 29.Nangaku M, Nishi H, Miyata T. Role of chronic hypoxia and hypoxia inducible factor in kidney disease. Chin Med J (Engl) 2008;121:257–264. [PubMed] [Google Scholar]
- 30.Li LP, Storey P, Pierchala L, et al. Evaluation of the reproducibility of intrarenal R2* and DeltaR2* measurements following administration of furosemide and during waterload. J Magn Reson Imaging. 2004;19:610–616. doi: 10.1002/jmri.20043. [DOI] [PMC free article] [PubMed] [Google Scholar]
- 31.
- 32.Epstein FH, Prasad P. Effects of furosemide on medullary oxygenation in younger and older subjects. Kidney international. 2000;57:2080–2083. doi: 10.1046/j.1523-1755.2000.00057.x. [DOI] [PubMed] [Google Scholar]
- 33.van der Bel R, Coolen BF, Nederveen AJ, et al. Magnetic Resonance Imaging-Derived Renal Oxygenation and Perfusion During Continuous, Steady-State Angiotensin-II Infusion in Healthy Humans. Journal of the American Heart Association. 2016;5:e003185. doi: 10.1161/JAHA.115.003185. [DOI] [PMC free article] [PubMed] [Google Scholar]
- 34.
- 35.Chehade H, Milani B, Ansaloni A, et al. Renal tissue oxygenation in children with chronic kidney disease due to vesicoureteral reflux. Pediatr Nephrol. 2016;31:2103–2111. doi: 10.1007/s00467-016-3419-0. [DOI] [PubMed] [Google Scholar]
- 36.Giannarini G, Kessler TM, Roth B, et al. Functional multiparametric magnetic resonance imaging of the kidneys using blood oxygen level dependent and diffusion-weighted sequences. The Journal of urology. 2014;192:434–439. doi: 10.1016/j.juro.2014.02.048. [DOI] [PubMed] [Google Scholar]
- 37.Chevalier RL, Forbes MS, Thornhill BA. Ureteral obstruction as a model of renal interstitial fibrosis and obstructive nephropathy. Kidney international. 2009;75:1145–1152. doi: 10.1038/ki.2009.86. [DOI] [PubMed] [Google Scholar]
- 38.Park SY, Kim CK, Park BK, et al. Assessment of early renal allograft dysfunction with blood oxygenation level-dependent MRI and diffusion-weighted imaging. European journal of radiology. 2014;83:2114–2121. doi: 10.1016/j.ejrad.2014.09.017. [DOI] [PubMed] [Google Scholar]
- 39.Prasad PV, Thacker J, Li LP, et al. Multi-Parametric Evaluation of Chronic Kidney Disease by MRI: A Preliminary Cross-Sectional Study. PloS one. 2015;10:e0139661. doi: 10.1371/journal.pone.0139661. [DOI] [PMC free article] [PubMed] [Google Scholar]
- 40.Michaely HJ, Metzger L, Haneder S, et al. Renal BOLD-MRI does not reflect renal function in chronic kidney disease. Kidney international. 2012;81:684–689. doi: 10.1038/ki.2011.455. [DOI] [PubMed] [Google Scholar]
- 41.Niendorf T, Pohlmann A, Arakelyan K, et al. How bold is blood oxygenation level-dependent (BOLD) magnetic resonance imaging of the kidney? Opportunities, challenges and future directions. Acta Physiol (Oxf) 2015;213:19–38. doi: 10.1111/apha.12393. [DOI] [PubMed] [Google Scholar]
- 42.Zhang JL, Morrell G, Rusinek H, et al. Measurement of renal tissue oxygenation with blood oxygen level-dependent MRI and oxygen transit modeling. American journal of physiology. 2014;306:F579–587. doi: 10.1152/ajprenal.00575.2013. [DOI] [PMC free article] [PubMed] [Google Scholar]
- 43.LeBihan D, Breton E, Lallemand D, et al. Separation of diffusion and perfusion in intravoxel incoherent motion MR imaging. Radiology. 1988;168:497–505. doi: 10.1148/radiology.168.2.3393671. [DOI] [PubMed] [Google Scholar]
- 44.Zhang JL, Sigmund EE, Chandarana H, et al. Variability of renal apparent diffusion coefficients: limitations of the monoexponential model for diffusion quantification. Radiology. 2010;254:783–792. doi: 10.1148/radiol.09090891. [DOI] [PMC free article] [PubMed] [Google Scholar]
- 45.Fan WJ, Ren T, Li Q, et al. Assessment of renal allograft function early after transplantation with isotropic resolution diffusion tensor imaging. Eur Radiol. 2016;26:567–575. doi: 10.1007/s00330-015-3841-x. [DOI] [PubMed] [Google Scholar]
- 46.Ebrahimi B, Rihal N, Woollard JR, et al. Assessment of renal artery stenosis using intravoxel incoherent motion diffusion-weighted magnetic resonance imaging analysis. Investigative radiology. 2014;49:640–646. doi: 10.1097/RLI.0000000000000066. [DOI] [PMC free article] [PubMed] [Google Scholar]
- 47.Hennedige T, Koh TS, Hartono S, et al. Intravoxel incoherent imaging of renal fibrosis induced in a murine model of unilateral ureteral obstruction. Magn Reson Imaging. 2015;33:1324–1328. doi: 10.1016/j.mri.2015.07.012. [DOI] [PubMed] [Google Scholar]
- 48.Bane O, Wagner M, Zhang JL, et al. Assessment of renal function using intravoxel incoherent motion diffusion-weighted imaging and dynamic contrast-enhanced MRI. Journal of Magnetic Resonance Imaging. 2016;44:317–326. doi: 10.1002/jmri.25171. [DOI] [PMC free article] [PubMed] [Google Scholar]