

Abstract
Many migraine sufferers utilize daily prophylactic therapy to reduce the frequency of their headache attacks. The FDA has approved several different medications for migraine prophylaxis, but it is not clear if sufferers perceive these treatments to provide clinically significant benefits given their side effect profiles. Three hundred headache sufferers were recruited from the community and local headache clinics using print and television advertising. Participants reported experiencing problematic headache attacks with a median [IQR] frequency of 7.0 [4, 13] headache days/month. These sufferers participated in a cross-sectional, single-site, study that utilized a specially designed computer assessment task. Participants were instructed on the probability of experiencing the three most commonly experienced side effects for several blinded medication profiles: divalproex sodium, venlafaxine, gabapentin, propranolol, and topiramate. After learning of the likelihood of experiencing side effect profiles for each medication, participants were asked if they would be willing to take the medication for a given headache reduction level which ranged from 0 to 7 days/month. The side effect profile for divalproex sodium was associated with the smallest willingness-to-take, with gabapentin, propranolol, and topiramate perceived to be much more agreeable. However, < 60% of participants reported a willingness-to-take any of these medications even if they provided a 50% reduction in headache frequency. Several general predictors of willingness-to-take were observed including high headache-related disability, depressive symptoms, and pain medication concerns including fear of tolerance. These findings suggest that if properly informed of the side effect profiles of these medications, many patients might opt for other treatments.
Keywords: headache, preventative treatment, risk, side effects
Introduction
When patients experience frequent headaches, it is often recommended that they consider using a prophylactic pharmacological treatment to reduce their headache frequency [23]. Many treatments are available, including those currently FDA approved for use in reducing migraine frequency such as divalproex sodium, venlafaxine, gabapentin, propranolol, timolol, and topiramate. Each of these treatments is associated with a reduced frequency of migraine attacks when compared with placebo alone [11]. Unfortunately, each of these treatments is also associated with very low adherence rates, with less than 30% of chronic migraine patients adhering to their prescribed regimens at 6 months after initiation [9]. The low adherence rates could be due to a side effect profile that may dissuade patients from continuing their use. To the best of our knowledge, there is no information currently available to assist researchers or clinicians in understanding what perceived degree of clinical benefit is required for a patient to tolerate the side effects of these medications. Stated differently, from the patient’s perspective, what is the degree of benefit in terms of reduction in headache frequency that would lead to a patient’s willingness-to-take one of these medications?
Estimating the degree of willingness-to-take a medication given any degree of theoretical harm is a daunting task that requires an adequate paradigm to communicate the expected risks [12]. Individuals often struggle to conceptualize risk information [5, 13], especially when it is communicated as numerical probability [21]. This realization has led experts in risk communication to develop the use of graphical risk tools [7]. Such tools display risk information using concrete representations that can make these risk estimates easier to remember and compare across treatments [1]. In a study involving tamoxifen for the prophylactic treatment of breast cancer recurrence, these tools were used to uncover surprising patient perceptions that contradicted the notion that tamoxifen had tolerable risk/benefit ratios. When individuals at high risk for breast cancer understood the expected benefits of tamoxifen in the context of its side effect profile, only 6% of individuals stated that they would be willing to use tamoxifen [6]. These willingness-to-take perceptions foreshadowed reality, as in the 3-month follow-up period, only 0.9% of individuals actually took the medication [6].
The objectives of this study were twofold. First, to utilize a graphical risk tool to communicate risk information to actual headache sufferers concerning several FDA approved preventative medications. The goal of this aspect of the study was to examine a sufferer’s reported willingness-to-take for several FDA approved preventative medication side effect profiles by estimating the reduction in headache frequency required for a participant to be willing-to-take each one. The second objective of this study was to examine several influences on a sufferer’s reported willingness-to-take these medications using several predictors that were hypothesized to be associated with these perceptions (e.g., depressive symptoms, medication beliefs, previous exposure to these medications, etc.). It is hoped that successfully estimating this willingness-to-take perception in the context of risk information will assist physicians in evaluating the value of prescribed medications, patients in considering their use, and future drug makers in estimating the utility of novel compounds.
Methods
The Headache and Cognition Study (HACOGS) was a cross-sectional, single-site, prospective observational study utilizing a specially designed computer assessment tool created to examine several aspects of cognitions related to the experience and treatment of headache. The study was conducted in Winston-Salem, NC between May 2012 and May 2014. All participants provided written informed consent, and the study was approved by the Wake Forest School of Medicine Institutional Review Board. Participants completed the study in a single visit to our research center. Although the HACOG study actually consisted of 4 separate sub-studies, this manuscript reports data from only the first sub-study examining a patient’s perceived willingness-to-take preventative medication and is the first publication of any of the data from this effort.
Participants
Participants were recruited from the local area using either referral from local headache practitioners or through local television advertising. To be eligible to participate, an individual must have been at least 18 years old and currently suffering from headaches of any type (i.e., tension-type, migraine, or cluster) with greater than five lifetime attacks. Self-reported use of any headache abortive treatment including over the counter (e.g., ibuprofen, naproxen sodium, Excedrin, etc.) and prescription (Triptans, CGRP antagonists, ibuprofen, etc.) medications also was required for participation. Exclusion criteria included inability to read and write English (i.e., the only available language of the questionnaires) and the inability to accurately complete the questionnaires or provide informed consent: (e.g., florid psychosis, current intoxication).
Medication Profiles
To examine a participant’s perceived willingness-to-take a specific preventative medication, several different unnamed medication side effect profiles were communicated using a computerized graphical risk tool. The medication profiles were selected by identifying all of the FDA approved oral preventative medications at the initiation date of the study (May 2012). The actual names of the medications were never disclosed to the participants so as to avoid any brand loyalty or to reduce the chances that a participant may have a preconceived notion about a particular medication.
The medication profiles consisted of three side effects and the chances (i.e., probability) that each side effect would be experienced. To create these profiles, only the three most commonly experienced side effects were selected from a pivotal Phase III RCT comparing that medication to placebo. The medications, their side effect profiles, and the frequency that each side effect was experienced are displayed in Table 1. These profiles served as the basis of the risk information that was presented using the graphical risk tool.
Table 1.
The medication side effect profiles that were presented to the participants in a randomized order.
| Drug | Side Effect Profile | Rate of side effect (%) Placebo/Drug |
Side Effect Description |
|---|---|---|---|
| propranolol [10] | Paresthesia | 7/58 | A sensation of tingling, numbness, or “pins and needles” on the hands, feet, or skin. |
| Taste abnormality | 2/23 | An altered sense of taste | |
| Difficulty with memory | 3/11 | Trouble finding words or slow thinking | |
| venlafaxine [18] | Nausea | 16/61 | A feeling of uneasiness of the stomach that often precedes vomiting |
| Vomiting | 0/30 | The forceful expulsion of the contents of one’s stomach through the mouth and sometimes the nose. | |
| Drowsiness | 11/31 | A state of near-sleep or a strong desire for sleep | |
| gabapentin [15] | Dizziness | 11/37 | A state of impairment in spatial perception and stability. Examples are lightheadedness or vertigo |
| Somnolence | 11/36 | A feeling of drowsiness where the individual is in a state of near-sleep or has a strong desire for sleep. | |
| divalproex sodium [16] | Nausea | 14/60 | A feeling of uneasiness of the stomach that often precedes vomiting |
| Asthenia | 8/39 | A state when the body lacks or has lost strength either as a whole or in any of its parts | |
| Somnolence | 5/35 | A feeling of drowsiness where the individual is in a state of near-sleep or has a strong desire for sleep. | |
| topiramate [14] ([4] | Paresthesia | 5/52 | A sensation of tingling, numbness, or “pins and needles” on the hands, feet, or skin. |
| Fatigue | 10/24 | A feeling of tiredness or exhaustion or a need to rest because of a lack of energy or strength. | |
| Appetite loss | 5/18 | A decreased sensation of appetite/desire to eat food |
Graphical Risk Communication
A graphical risk tool was developed to communicate headache medication risk-benefit information to the headache sufferers in the study. This tool was made up of 100 small boxes aligned in a larger 10×10 rectangular shape (Figure 1). The 100 boxes represent 100 people. Boxes colored dark blue represent the number of people out of 100 who experience a given side effect after taking the drug. The light blue boxes represent the number of people who experience the same issue without taking the drug (i.e., in the placebo group). Gray boxes represent the number of people out of 100 who do not experience the side effect. In this study, each side effect for each drug is represented with one of these figures.
Figure 1.
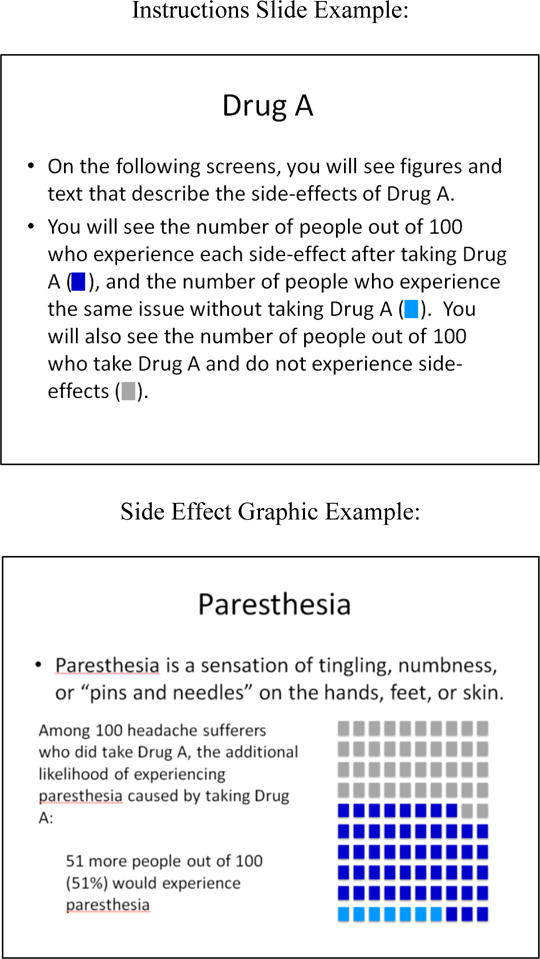
Screen captures (i.e., example) of the graphical risk tool for one side effect.
Computer Assessment
The risk assessment portion of the study was conducted using the E-Prime 2.0 software program [22]. Participants first were presented with questions inquiring about their current headache pain, the timing of their last headache, the number of headaches experienced in a typical month, whether they take prescription medications to prevent headaches, and whether they take medication when they get a headache. Following completion of these questions, participants were introduced to the format of the side effects risk assessment. They were given instructions on what they should expect to see, and how they would need to respond. Visual examples of the risk communication format also were provided. Participants were told to proceed with the study when they felt comfortable with the format and instructions.
Each side effect was presented on its own screen. The screen included a definition of the side effect and the number and percentage of people who would experience the side effect if 100 people took the drug was displayed on the screen. The graphical display of the number of people who experience the side effect after taking the drug, the number of people who would experience the same issue without taking the drug, and the number of people who do not experience the side effect also was presented on the slide (Figure 1).
After viewing all of the side effect information for a particular medication profile, participants were asked, “If taking Drug X causes you to experience ‘X’ less headache day(s)/month, would you take it?”. Answer choices were “Yes” or “No.” This question was asked for each number of days 0 through 7. Participants then repeated this procedure for each of the remaining drugs.
Questionnaires
Participants completed several other questionnaires in addition to the side effects risk communication portion of the study. These questionnaires were the Center for Epidemiologic Studies Depression Scale (CES-D) [19], the State-Trait Anxiety Inventory Form Y-2 (STAI-T) [25], the Migraine Disability Scale (MIDAS) [26], the Pain Medication Attitudes Questionnaire (PMAQ) [17], and the Weekly Stress Inventory Short Form (WSI-SF).
The CES-D is a widely-used 20-question scale that measures depressive symptoms. In the general population and in population subgroups, validity evidence and reliability of the scale are acceptable, and the scale is useful for evaluating associations between depression and other variables of interest [12]. Four response choices are used for each question: Rarely or none of the time (less than 1 day), Some or a little of the time (1–2 days), Occasionally or a moderate amount of time (3–4 days), and Most or all of the time (5–7 days). Responses are scored 0–3, and positive items are reverse coded. A higher score indicates more depressive symptomatology.
The STAI-T is a 20-question scale commonly used to assess trait anxiety, or one’s general tendency to feel uneasy, and its use is supported by strong evidence for validity and high reliability in the general population [13]. Four response options are available for each question: 1 = Almost never, 2 = Sometimes, 3 = Often, and 4 = Almost always, and some items are reverse coded. The sum of all items represents the score on the scale with higher scores indicating more anxiety.
The MIDAS is a five item scale used in both clinical and research settings to measure migraine-related disability [14]. Considerable support for reliability and validity exists for these uses. Respondents are asked to provide the number of days they missed out on or had diminished productivity in work, school, household, and social activities due to headaches in the last 90 days. The sum of the five questions is the total score on the questionnaire. The scores were interpreted according to disability levels provided by the validation: < 5 little disability; 6–10 mild disability; 11–20 moderate disability; > 21 severe disability.
The PMAQ consists of 47 items that measure seven areas of patients’ attitudes toward pain medications (addiction, perceived need, unfavorable scrutiny by others, adverse side effects, tolerance, mistrust in the prescribing doctor, and withdrawal) [15]. Evidence suggests appropriate reliability and validity for the seven scales. Scale intercorrelations support the use of scores from the scales to represent seven separate domains. The scale uses a six-point response format where 0 = never true, 1 = almost never true, 2 = seldom true, 3 = often true, 4 = almost always true, and 5 = always true. The score on each scale is calculated by summing the responses for all items on the scale, with some items being reverse coded.
The WSI-SF is a 25-item scale that is used to measure minor stress that occurred in the past week [3]. Designed to use as a brief assessment in medical and research settings, the WSI-SF has demonstrated high reliability and sound validity evidence. The scale uses eight response options where 0 = Did not occur, 1 = Happened not stressful, 2 = Slightly stressful, 3 = Mildly stressful, 4 = Moderately stressful, 5 = Stressful, 6 = Very stressful, and 7 = Extremely stressful. An event score can be obtained by summing the total number of events that were endorsed, and an impact score can be obtained by summing the stress ratings of the endorsed events. These questionnaires were completed using the REDCap (Research Electronic Data Capture) tools hosted at Wake Forest School of Medicine [8]. Participants were able to complete paper versions of the questionnaires, if they requested to do so. The PMAQ was added to the questionnaire packet after the first 80 participants had completed the study. Therefore, 220 completed PMAQ questionnaires were available for analysis.
Primary Outcome
To estimate a perceived willingness-to-take, the computerized system inquired, “If taking Drug X causes you to experience ‘X’ less headache day(s)/month, would you take it?” for each of X ranging 0 to 7 days reduction (presented sequentially from low to high). The primary outcome was this sequence of responses (either ”Yes” or ”No”) associated with each level of reduction. Responses to headache reduction scores that were greater than a participant’s monthly total were not used in the analysis. Thus, for participants who reported experiencing 5 headaches/month, their responses to 6 and 7 days reduction were not coded, as this is not relevant to them.
Statistical Analyses
Due to the diverse group of hypotheses in the HACOG study, the sample size considerations were designed to provide general precision surrounding a point estimate of a binomial proportion. An a priori statistical power calculation revealed that enrolling N = 300 participants provides an upper bound of confidence interval of 1.2% (3.5/300) assuming no events are observed, or a confidence interval width of +− 5.7% when a 50% proportion is observed. This level of precision was deemed to provide clinically significant information for the various perceptions under study.
The responses from the computer system and questionnaire data were tabulated using descriptive statistics appropriate for the distributions under study. Frequency counts and proportions are reported for categorical data, mean (SD) for normally distributed data with interval properties, and median [25th, 75th percentile] for skewed data or data with outliers. Standardized mean differences (SMD) are reported to represent a standardized effect size where appropriate [2]. Univariate differences were examined using Mann-Whitney U for ordinal variables and chi-squared (or Fisher’s exact test) for categorical variables. Except where explicitly stated, all collected data were included in the analysis.
To examine the primary outcome, we conducted generalized linear mixed effects models. These models allowed for the repeated assessments within each individual by specifying a random intercept term by subject and medication profile. The outcome variable (willingness-to-take: “Yes” versus “No”) was modeled using a binomial distribution and logit link. Fixed effects were entered into the model in several sequential blocks. Each of the models contained a predictor representing order effects to account for the changes in perception that occurred as the participant gained experience with the task. To examine willingness-to-take perceptions related to medication profiles, we specified a subject-level random intercept and entered medication profile, level of benefit, and profile x level of benefit as fixed effects.
To examine general willingness-to-take perceptions independent of medication profile, we specified two random effects, subject and medication profile-level random intercepts, and entered our various predictors as fixed effects. We estimated three different models representing different theoretical domains: 1) previous/current experience with prophylactic medications; 2) headache burden (e.g., disability, depressive symptoms, stress); and 3) pain medication beliefs (PMAQ). Finally, we estimated one exploratory combined model that forced all of the statistically significant predictors from the first three models into a multiple domain model. We plotted the predicted values from this combined model. All analyses were conducted using R 3.2 (R Core Team, Vienna, Austria). Where appropriate, all hypothesis tests are two-tailed, and p < 0.05 was interpreted for statistical significance.
Results
Sample Characteristics
Data were available from all N = 300 enrolled participants. For the analysis, the participants contributed 9,616 trials that corresponded with five medication trials that could each have up to seven theoretical levels of benefit (i.e., 0 to 7 headache days of reduction). This possible total (300 patients × 5 medications × 8 degrees of benefit = 12,000 trials) is greater than what was observed because the data for theoretically impossible headache responses greater than 100% (i.e., more than a total reduction in headache frequency for that participant) was not used in the analysis and because in < 1% of trials no response was entered. Because the PMAQ was added after the first 80 participants had completed the study, this questionnaire was not available for all participants. After accounting for additional instances of missing data, 218/300 (73%) participants were included in the PMAQ analyses.
Table 2 displays the participant characteristics by their previous/current exposure to headache prophylactic medication. A wide range of headache activity was observed with headache frequency ranging between 0 to 30 days/month, median 7.0 [4, 13] headache days/month. Similarly, participants reported a range of symptoms of depression, anxiety, stress, headache related disability, and beliefs about pain medications. The respondents reported experiencing a wide range of medications ranging from anti-depressants, anti-nausea, triptans, opioids, etc. Table 2 displays the descriptive statistics for the sample and supports the notion that the respondents reflect a diverse sample of headache sufferers with a host of previous experiences with a variety of headache therapies.
Table 2.
Participant characteristics and medication use history.
| Never Headache Prophylactic Treatment |
Past/Current Headache Prophylactic Treatment |
p | SMD | |
|---|---|---|---|---|
| n = 242 | n = 58 | |||
| Headache frequency (days/month) | 8 [5, 14] | 15 [6, 20] | 0.005 | 0.39 |
| MIDAS | 18.0 [9.0, 39.8] | 30.5 [10.3, 79.5] | 0.025 | 0.39 |
| CESD | 13.0 [6.0, 22.8] | 12.6 [5.0, 24.0] | 0.765 | 0.10 |
| STAI | 37.0 [30.0, 47.0] | 37.5 [31.0, 50.0] | 0.406 | 0.14 |
| PMAQ | ||||
| Addiction | 0 [0, 3.0] | 3.5 [0, 7.8] | 0.02 | 0.49 |
| Need | 10.0 [5.0, 16.0] | 13.0 [8.3, 20.3] | 0.019 | 0.57 |
| Scrutiny | 6.0 [2.8, 11.0] | 7.5 [3.5, 11.0] | 0.444 | 0.20 |
| Side Effects | 6.0 [2.0, 10.3] | 10.5 [7.0, 13.8] | 0.01 | 0.61 |
| Tolerance | 4.0 [1.0, 11.0] | 10.0 [8.0, 17.0] | 0.003 | 0.69 |
| Mistrust | 7.0 [1.0, 13.0] | 8.5 [5.0, 10.8] | 0.417 | 0.17 |
| Withdrawal | 2.0 [0, 6.0] | 6.5 [4.0, 12.5] | <0.001 | 0.74 |
| WSI-SF | 37.0 [20.0, 56.8] | 42.0 [20.3, 72.3] | 0.482 | 0.12 |
| Opioids | 90 (37.2) | 32 (55.2) | 0.019 | 0.37 |
| NSAIDs | 113 (46.7) | 46 (79.3) | <0.001 | 0.72 |
| Triptan | 83 (34.3) | 49 (84.5) | <0.001 | 1.19 |
| Muscle Relaxant | 48 (19.8) | 18 (31.0) | 0.094 | 0.26 |
| Sedative | 31 (12.8) | 10 (17.2) | 0.503 | 0.12 |
| Barbiturate | 24 (9.9) | 12 (20.7) | 0.041 | 0.30 |
| Antidepressant | 12 (5.0) | 18 (31.0) | <0.001 | 0.72 |
| Anti-nausea | 9 (3.7) | 17 (29.3) | <0.001 | 0.73 |
| HRT | 2 (0.8) | 2 (3.4) | 0.354 | 0.18 |
| Vitamin/Supplement | 5 (2.1) | 7 (12.1) | 0.002 | 0.40 |
| Botox | 0 (0.0) | 1 (1.7) | 0.437 | 0.18 |
| Ergot | 7 (2.9) | 6 (10.3) | 0.032 | 0.30 |
HRT, hormone replacement therapy; MIDAS, Migraine Disability Scale; NSAID, nonsteroidal anti-inflammatory drug; PMAQ, Pain Medication Attitudes Questionnaire; SMD, standardized mean differences.
A total of 58/300 (19.3%) participants reported either previously or currently taking headache prophylactic medications. This group of individuals differed markedly from individuals who had not been exposed to prophylactic medications in that they experienced more headache attacks, greater headache related disability, reported several different types of medication beliefs, and were much more likely to have been exposed to certain prescription medications, like triptans. Table 2 displays the group differences using standardized mean differences.
Willingness-to-Take Several Headache Prophylactic Medications
Participants reported varying degrees of willingness-to-take by medication side effect profiles. Although the order of medication presentation was randomized, the actual order substantially impacted perceptions of willingness-to-take, so the order of presentation was entered as a covariate in the model. The models estimated two parameters of interest- the intercept and slope. The intercept represented a participant’s willingness to take the medication when the expected degree of benefit is 0%. This value was not theoretical as it was formally assessed as a response choice and probably reflects a general willingness-to-take given the medication under any circumstances. The slope parameter represents an increasing willingness-to-take a medication as the expected degree of benefit increases. The coding of this parameter is such that the odds ratio corresponds to the odds of a participant being willing-to-take a medication for each additional 10% reduction in headache frequency.
Table 3 displays the intercept and slope parameters for the five medication side effect profiles considered in this study. The side effect profile for divalproex sodium was associated with the smallest willingness-to-take with 0% expected benefit (the predicted probability was ~15% in the sample). The side effect profile for venlafaxine was not different (p = 0.614) from divalproex sodium, but gabapentin, propranolol, and topiramate profiles were perceived to be much more agreeable with 0% expected benefit (p’s < 0.0001). The medication profiles were all associated with increases in willingness-to-take with increasing expected benefit. For divalproex sodium, each 10% reduction in headache frequency was associated with a 24% increase in the odds of willingness-to-take, OR: 1.24 (95%CI: 1.18, 1.30), p < 0.0001. The slope was not different for propranolol and venlafaxine, but compared to divalproex sodium, gabapentin, and topiramate both were associated with an additional 9% increases in the odds of being willing-to-take for each 10% reduction in headache frequency. Figure 2 displays the predicted probabilities of willingness-to-take for each medication profile. This figure displays that given a 50% reduction in headache frequency, the various medication profiles were associated with only a 20% (divalproex sodium) to 60% (topiramate) willingness-to-take. Even with a 100% reduction in headache frequency, these medication profiles were all associated with a < 65% willingness-to-take.
Table 3.
Willingness to take surveyed medications
| Medication | Intercept | Slope | ||||
|---|---|---|---|---|---|---|
| Willingness-to-take with 0% expected benefit | Increased willingness-to-take for each 10% reduction in headache frequency | |||||
| OR | 95%CI | p-value | OR | 95%CI | p-value | |
| divalproex sodium* | – | – | – | – | – | – |
| venlafaxine | 1.1 | 0.78, 1.52 | 0.614 | 1.03 | 0.97, 1.10 | 0.351 |
| gabapentin | 3.3 | 2.45, 4.57 | < 0.0001 | 1.09 | 1.03, 1.16 | 0.006 |
| propranolol | 3.0 | 2.19, 4.07 | < 0.0001 | 0.97 | 0.92, 1.04 | 0.392 |
| topiramate | 4.3 | 3.16, 5.88 | < 0.0001 | 1.09 | 1.03, 1.16 | 0.005 |
Divalproex sodium is used as the reference category. The model controls for order of presentation of medication profile.
Figure 2.
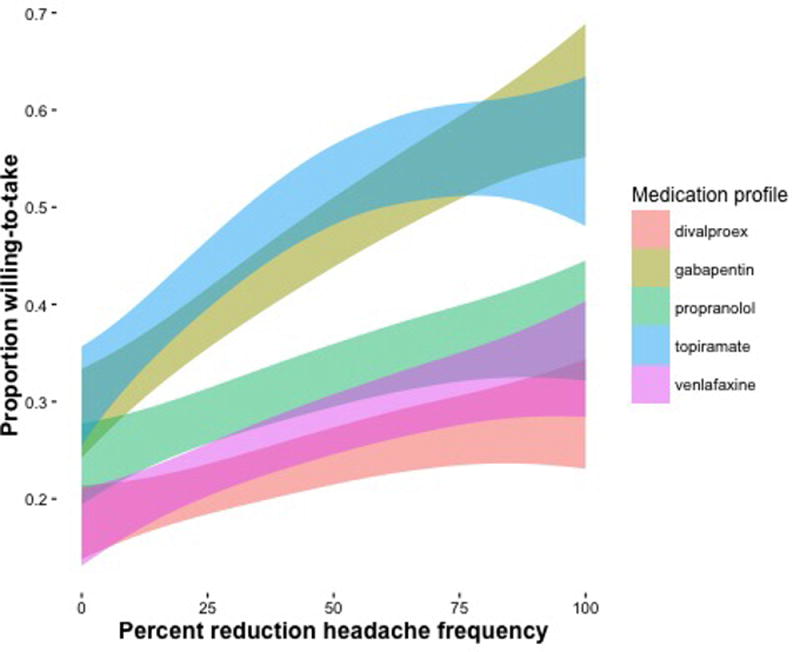
Estimated proportion of the sample willing-to-take (y-axis) as a function of expected benefit (x-axis). The different colors represent side-effect profiles that are associated with each medication. The width of the colors represents a 95% confidence interval.
General Predictors of Willingness-to-Take Medications
To examine our pre-specified hypotheses, we estimated several different models. We first tested whether previous/current experience with headache prophylactic medications is related to willingness-to-take perceptions. We failed to find evidence to support the notion that previous experience is either positively or negatively associated with willingness to take these medications either generally (intercept: p = 0.324) or with increasing expectations of benefit (slope: p = 0.974), see Table 4. Our second hypothesis related to headache burden was supported; depressive symptoms (CES-D) and recent stress (WSI-SF impact score) were both uniquely associated with general willingness to take (P’s, 0.008). Further, headache-related disability (MIDAS) and stress were both associated with increasing benefit (p’s < 0.0001). For example, for each standard deviation increase in disability, the odds of an individual being willing-to-take a medication rose by an OR 1.13 (95%CI: 1.09, 1.17), p < 0.0001. Our third hypothesis regarding medication beliefs was also supported, for fear of tolerance was also uniquely associated with a 2.3 fold increase in the odds of willingness-to-take (p < 0.0001). Interestingly, this fear of tolerance was also associated with a diminished willingness-to-take with increasing benefit (OR: 0.95, 95%CI: 0.91, 0.99), and this may in part be due to a confusion in the individual’s mind about the role of prophylactic therapies (i.e., unlike abortive therapies, these medications do not have to be taken more often for increased benefit). The mistrust of medical professionals was also uniquely associated with a small reduced willingness-to-take with increasing expected benefit (OR: 0.97, 95%CI: 0.94, 0.99).
Table 4.
Predictors of General Willingness-to-Take
| Predictor | Intercept | Slope | ||||
|---|---|---|---|---|---|---|
| Willingness-to-take with 0% expected benefit | Increased willingness-to-take for each 10% reduction in headache frequency | |||||
| Prophylactic Experience | OR | 95%CI | p-value | OR | 95%CI | p-value |
| Current/past headache prophylactic medication use | 1.42 | 0.71, 2.84 | 0.324 | 1.00 | 0.94, 1.06 | 0.974 |
| Headache Burden | ||||||
| MIDAS | 1.03 | 0.77, 1.39 | 0.829 | 1.13 | 1.09, 1.17 | < 0.0001 |
| CESD | 1.54 | 1.11, 2.11 | 0.008 | 0.98 | 0.95, 1.01 | 0.146 |
| WSI-SF | 1.68 | 1.24, 2.28 | 0.001 | 0.94 | 0.92, 0.97 | < 0.0001 |
| Pain Medication Beliefs | ||||||
| Addiction | 1.05 | 0.60, 1.82 | 0.861 | 0.96 | 0.91, 1.01 | 0.114 |
| Need | 1.17 | 0.72, 1.90 | 0.519 | 0.99 | 0.95, 1.03 | 0.488 |
| Scrutiny | 0.75 | 0.47, 1.20 | 0.236 | 1.01 | 0.97, 1.05 | 0.610 |
| Side Effects | 0.89 | 0.59, 1.37 | 0.618 | 1.01 | 0.98, 1.05 | 0.532 |
| Tolerance | 2.34 | 1.39, 3.94 | 0.001 | 0.95 | 0.91, 0.99 | 0.022 |
| Mistrust | 1.33 | 0.91, 1.94 | 0.139 | 0.96 | 0.92, 0.99 | 0.009 |
| Withdrawal | 1.32 | 0.76, 2.31 | 0.319 | 1.02 | 0.96, 1.07 | 0.567 |
| Combined | ||||||
| MIDAS | 1.12 | 0.79, 1.58 | 0.522 | 1.07 | 1.03, 1.11 | 0.0004 |
| CESD | 1.40 | 0.95, 2.04 | 0.086 | 1.02 | 0.98, 1.05 | 0.369 |
| WSI-SF | 1.60 | 1.11, 2.32 | 0.012 | 0.94 | 0.91, 0.97 | 0.0007 |
| Addiction | 0.99 | 0.66, 1.49 | 0.953 | 0.96 | 0.93, 1.00 | 0.068 |
| Tolerance | 2.03 | 1.34, 3.08 | 0.0009 | 0.97 | 0.94, 1.01 | 0.094 |
| Mistrust | 1.02 | 0.72, 1.43 | 0.922 | 0.97 | 0.94, 0.99 | 0.022 |
CI, confidence interval; CES-D, Center for Epidemiologic Studies Depression Scale; MIDAS, Migraine Disability Scale; OR, odds ratio; WSI-SF, Weekly Stress Inventory Short Form.
To examine the potential clinical significance of these various factors, Figure 3 displays the model predictions for each participant for the propranolol medication profile by degree of headache related disability. For display purposes only, each participant’s MIDAS score was artificially dichotomized using clinical cut-points reflecting ‘little to mild’ disability (MIDAS <= 10) versus ‘moderate to severe’ disability (MIDAS > 10). The predictions are colored using an unweighted sum of the all of the z-scores of the predictors in the model to reflect an overall model risk (higher z-scores generally reflect similar associations for all predictors). As can be observed, participants with higher than average (i.e., model risk z-scores > 0) levels of depressive symptoms, stress levels, fear of developing tolerance, fear of addiction, and mistrust of physicians were more likely to be willing-to-take headache prophylactic medications (i.e., greater intercepts) but exhibited diminished slopes with increasing benefits. In clinical practice, it is unlikely that participants in the little to mild disability group would be candidates for prophylactic therapy [24].
Figure 3.
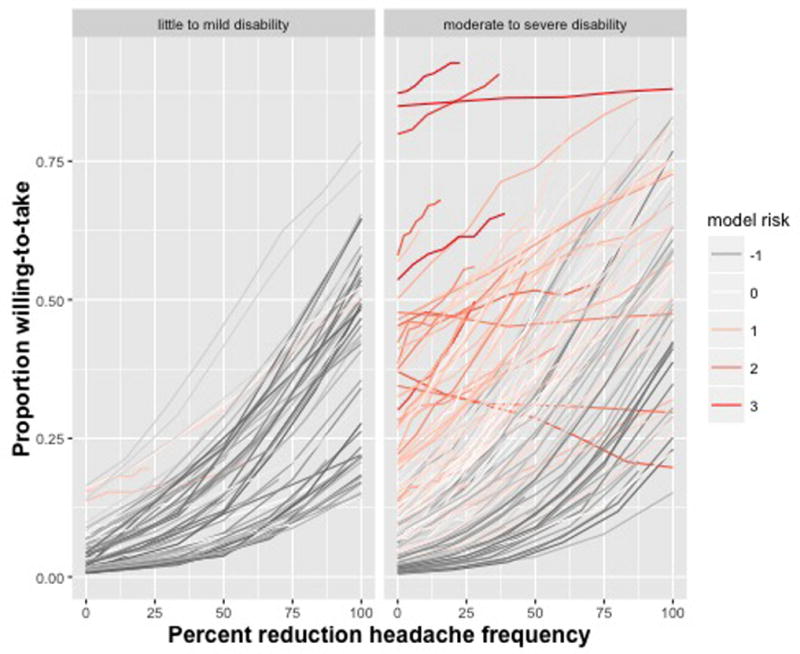
Individual differences in the proportion willing-to-take a medication as a function of expected benefit for the side-effect profile of propranolol. Each line represents a unique participant, with the plot stratified by migraine disability: left panel is little to mild disability, right panel is moderate to severe disability. The color of the line represents the sum of each participant’s ‘model risk’ that is the sum of z-scores for the CESD, WSI, Addiction, Tolerance, and Mistrust scaled scores (i.e., a score of 3 represents an individual who is 3 SD above the mean of the average sum of these scales).
Discussion
In this study we pursued two objectives, to utilize a graphical risk tool to communicate side effect risk information to actual headache sufferers concerning several FDA approved preventative medications and to examine predictors of general willingness-to-take perceptions using several types of psychosocial predictors. We utilized a specially designed risk communication tool to help participants understand the likely side effect profiles for each of five FDA approved migraine prophylactic medications and then inquired about the degree of benefit required for these participants to be willing-to-take each one. Our major findings were that, given the same level of expected benefit, participants were much more inclined to be willing-to-take propranolol, gabapentin, and topiramate compared with venlafaxine and divalproex sodium. There were several predictors that influenced these general perceptions that ranged from depressive symptoms, recent stress, and medication beliefs such as fear of developing tolerance to a pain medication, fear of addiction to a pain medication, and general mistrust of doctors. We failed to find evidence that previous experience with prophylactic medications influenced these perceptions in any way.
A striking feature of the results of this laboratory task is that only a minority (< 50%) of participants were generally willing-to-take any of these medications when they provided ~ 25% reduction in headache days/month (1–4 days/month in this sample). This modest level of clinical benefit was found to be typical of these medications in a recent meta-analysis [11]. Furthermore, the lack of enthusiasm for these side effect profiles in this lab task is consistent with a recent analysis by Hepp and colleagues who found only 26% to 29% six-month adherence rates in a large sample of chronic migraine sufferers [9]. In a similar finding to the current analysis, Hepp et al. found that topiramate had superior adherence rates to several other medications (including divalproex sodium) [9], perhaps reflecting a greater willingness-to-take perception for this medication in a real-world setting. When combining these laboratory data with other clinical samples [20], there is ample evidence that these medications are associated with a high degree of non-adherence, failure to refill prescriptions, and high discontinuation rates that diminish their practical use.
We also found several interesting predictors of willingness-to-take that could impact routine clinical care. Contrary to our hypothesis, we failed to find that participants with a history of using prophylactic medications were more or less likely to report a willingness-to-take these medications. It is unclear if this is indicative of a lack of impact of past experiences (e.g., a previously positive experience with these medications might lead to a bias in the lab task), or if the blinding successfully removed this source of bias. We did observe that higher levels of depressive symptoms, higher levels of weekly stress, and greater levels of headache-related disability were all associated with some aspect of a participant’s willingness-to-take these medications. These psychosocial domains are routinely assessed in clinical practice, but it is unclear if clinicians utilize stress or depressive symptoms as important factors in their prescribing practices. We also found that self-reported pain medication beliefs, as measured by the Pain Medication Attitudes Questionnaire [17], appear to have utility in predicting who is and is not inclined to view prophylactic medications favorably. Including this assessment in standard clinical batteries could be an important aspect of assessing potential problems with medication adherence.
Generalizability & Limitations
Although our study provides much support for future use of graphical risk tools with headache sufferers, it is not without its limitations. The study’s participants were a convenience sample from the community, and while we cannot ascertain their representativeness of the general headache population, this group includes a mix of both those currently under a physician’s care for their headaches and those who are not. This is an advantage over the inclusion of only treatment seeking participants.
In an effort to maintain our participants’ anonymity and ensure their comfort with honestly responding to the tasks, we collected only information directly relevant to our objectives. Therefore, details such as headache diagnosis, socioeconomic status, and health insurance type were not available for analysis. While this information could have further informed the analysis, it was not necessary for addressing the objectives of the study.
An additional limitation to undertaking an innovative data acquisition method such as our graphical risk assessment is the participants’ lack of familiarity with the task. In our study, participants were required to learn how to interpret the provided risk communication tools and respond to and answer questions about the information they saw. A presentation effect was detected, as it appeared the ability of the participants to perform the task changed as they gained more experience with the task. We were able to account for this effect in the model, but future studies of this nature may be improved by giving participants the opportunity to practice the task before beginning data collection. Relatedly, with this novel data acquisition method, we are uncertain of the potential effects of social desirability bias. Perhaps participants were not willing to say they would take a drug that causes side effects because inflicting unpleasant conditions on oneself appears to be irrational. However, this could differ in a real world setting when a headache sufferer is desperate for relief. We also did not assess if the participants were aware of what medication profiles were being examined, though it is seems unlikely that participants could guess this information. This was the first time a complex, laboratory-based task of this nature has been conducted, and, therefore, the extent to which the task predicts real world behavior is unknown. Recruiting participants who take the actual drugs evaluated in the study or patients who would qualify to take those drugs but do not would extend our understanding of willingness-to-take into real life situations. While we likely included a mix of such patients in the current study, we did not collect the necessary information to assess their real world behaviors. A final limitation is that we based the estimates of the side-effect profiles on only a few studies, several of which had substantial patient drop-out. The degree to which the side-effect profiles used in this study apply in real-world situations is also not known. Future studies are needed to further investigate this promising graphical risk communication tool.
Acknowledgments
Finding: NINDS, RO1NS06525701
Footnotes
Conflicts of Interest: D. P. Turner and A. N. Golding have no conflicts to report. T. T. Houle was a consultant for Depomed, Inc. during the time period prior to submission.
References
- 1.Ancker JS, Senathirajah Y, Kukafka R, Starren JB. Design features of graphs in health risk communication: a systematic review. J Am Med Inform Assoc. 2006;13:608–618. doi: 10.1197/jamia.M2115. [DOI] [PMC free article] [PubMed] [Google Scholar]
- 2.Austin PC. Using the standardized difference to compare the prevalence of a binary variable between two groups in observational research. Communications in Statistics-Simulation and Computation. 2009;38:1228–1234. [Google Scholar]
- 3.Brantley PJ, Bodenlos JS, Cowles M, Whitehead D, Ancona M, Jones GN. Development and Validation of the Weekly Stress Inventory-Short Form. Journal of Psychopathology and Behavioral Assessment. 2007;29:54–59. [Google Scholar]
- 4.Bussone G, Diener HC, Pfeil J, Schwalen S. Topiramate 100 mg/day in migraine prevention: a pooled analysis of double blind randomised controlled trials. International Journal of Clinical Practice. 2005;59:961–968. doi: 10.1111/j.1368-5031.2005.00612.x. [DOI] [PubMed] [Google Scholar]
- 5.Edwards A, Elwyn G. Understanding risk and lessons for clinical risk communication about treatment preferences. Qual Health Care. 2001;10(Suppl 1):i9–13. doi: 10.1136/qhc.0100009... [DOI] [PMC free article] [PubMed] [Google Scholar]
- 6.Fagerlin A, Zikmund-Fisher BJ, Nair V, et al. Women’s decisions regarding tamoxifen for breast cancer prevention: responses to a tailored decision aid. Breast Cancer Res Treat. 2010;119:613–620. doi: 10.1007/s10549-009-0618-4. [DOI] [PMC free article] [PubMed] [Google Scholar]
- 7.Gigerenzer G, Edwards A. Simple tools for understanding risks: from innumeracy to insight. BMJ. 2003;327:741–744. doi: 10.1136/bmj.327.7417.741. [DOI] [PMC free article] [PubMed] [Google Scholar]
- 8.Harris PA, Taylor R, Thielke R, Payne J, Gonzalez N, Conde JG. Research electronic data capture (REDCap):a metadata-driven methodology and workflow process for providing translational research informatics support. Journal of Biomedical Informatics. 2009;42:377–381. doi: 10.1016/j.jbi.2008.08.010. [DOI] [PMC free article] [PubMed] [Google Scholar]
- 9.Hepp Z, Dodick DW, Varon SF, Gillard P, Hansen RN, Devine EB. Adherence to oral migraine-preventive medications among patients with chronic migraine. Cephalalgia. 2015;35:478–488. doi: 10.1177/0333102414547138. [DOI] [PubMed] [Google Scholar]
- 10.Holroyd KA, Penzien DB, Cordingley GE. Propranolol in the Management of Recurrent Migraine: A Meta analytic Review. Headache: The Journal of Head and Face Pain. 1991;31:333–340. doi: 10.1111/j.1526-4610.1991.hed3105333.x. [DOI] [PubMed] [Google Scholar]
- 11.Jackson JL, Cogbill E, Santana-Davila R, et al. A Comparative Effectiveness Meta-Analysis of Drugs for the Prophylaxis of Migraine Headache. PLoS One. 2015;10:e0130733. doi: 10.1371/journal.pone.0130733. [DOI] [PMC free article] [PubMed] [Google Scholar]
- 12.Knapp P, Raynor DK, Berry DC. Comparison of two methods of presenting risk information to patients about the side effects of medicines. Qual Saf Health Care. 2004;13:176–180. doi: 10.1136/qshc.2003.009076. [DOI] [PMC free article] [PubMed] [Google Scholar]
- 13.Lloyd AJ. The extent of patients’ understanding of the risk of treatments. Qual Health Care. 2001;10(Suppl 1):i14–i18. doi: 10.1136/qhc.0100014... [DOI] [PMC free article] [PubMed] [Google Scholar]
- 14.Luykx J, Mason M, Ferrari MD, Carpay J. Are migraineurs at increased risk of adverse drug responses? a meta-analytic comparison of topiramate-related adverse drug reactions in epilepsy and migraine. 2009;85:283–288. doi: 10.1038/clpt.2008.203. [DOI] [PubMed] [Google Scholar]
- 15.Mathew NT, Rapoport A, Saper J, et al. Efficacy of gabapentin in migraine prophylaxis. Headache: The Journal of Head and Face Pain. 2001;41:119–128. doi: 10.1046/j.1526-4610.2001.111006119.x. [DOI] [PubMed] [Google Scholar]
- 16.Mathew NT, Saper JR, Silberstein SD, et al. Migraine prophylaxis with divalproex. Archives of Neurology. 1995;52:281–286. doi: 10.1001/archneur.1995.00540270077022. [DOI] [PubMed] [Google Scholar]
- 17.McCracken LM, Hoskins J, Eccleston C. Concerns about medication and medication use in chronic pain. The Journal of Pain. 2006;7:726–734. doi: 10.1016/j.jpain.2006.02.014. [DOI] [PubMed] [Google Scholar]
- 18.Ozyalcin SN, Talu GK, Kiziltan E, Yucel B, Ertas M, Disci R. The efficacy and safety of venlafaxine in the prophylaxis of migraine. Headache: The Journal of Head and Face Pain. 2005;45:144–152. doi: 10.1111/j.1526-4610.2005.05029.x. [DOI] [PubMed] [Google Scholar]
- 19.Radloff LS. The CES-D scale a self-report depression scale for research in the general population. Applied Psychological Measurement. 1977;1:385–401. [Google Scholar]
- 20.Rains JC, Penzien DB, Lipchik GL. Behavioral facilitation of medical treatment of headache: implications of noncompliance and strategies for improving adherence. Headache: The Journal of Head and Face Pain. 2006;46:S142–S143. doi: 10.1111/j.1526-4610.2006.00565.x. [DOI] [PubMed] [Google Scholar]
- 21.Rothman AJ, Kiviniemi MT. Treating people with information: an analysis and review of approaches to communicating health risk information. J Natl Cancer Inst Monogr. 1999;25:44–51. doi: 10.1093/oxfordjournals.jncimonographs.a024207. [DOI] [PubMed] [Google Scholar]
- 22.Schneider W, Eschman A, Zuccolotto A. J computer software and manual. Pittsburgh, PA: Psychology Software Tools Inc; 2002. E-prime (version 2.0) [Google Scholar]
- 23.Silberstein SD, Goadsby PJ. Migraine: preventive treatment. Cephalalgia. 2002;22:491–512. doi: 10.1046/j.1468-2982.2002.00386.x. [DOI] [PubMed] [Google Scholar]
- 24.Silberstein SD, Consortium USH. Practice parameter: Evidence-based guidelines for migraine headache (an evidence-based review) Report of the Quality Standards Subcommittee of the American Academy of Neurology. Neurology. 2000;55:754–762. doi: 10.1212/wnl.55.6.754. [DOI] [PubMed] [Google Scholar]
- 25.Spielberger CD, Gorsuch RL. Manual for the state-trait anxiety inventory (form Y) (“self-evaluation questionnaire”) Palo Alto: Consulting Psychologists Press; 1983. [Google Scholar]
- 26.Stewart WF, Lipton RB, Dowson AJ, Sawyer J. Development and testing of the Migraine Disability Assessment (MIDAS) Questionnaire to assess headache-related disability. Neurology. 2001;56:S20–S28. doi: 10.1212/wnl.56.suppl_1.s20. [DOI] [PubMed] [Google Scholar]