. 2017 May 9;6:e21660. doi: 10.7554/eLife.21660

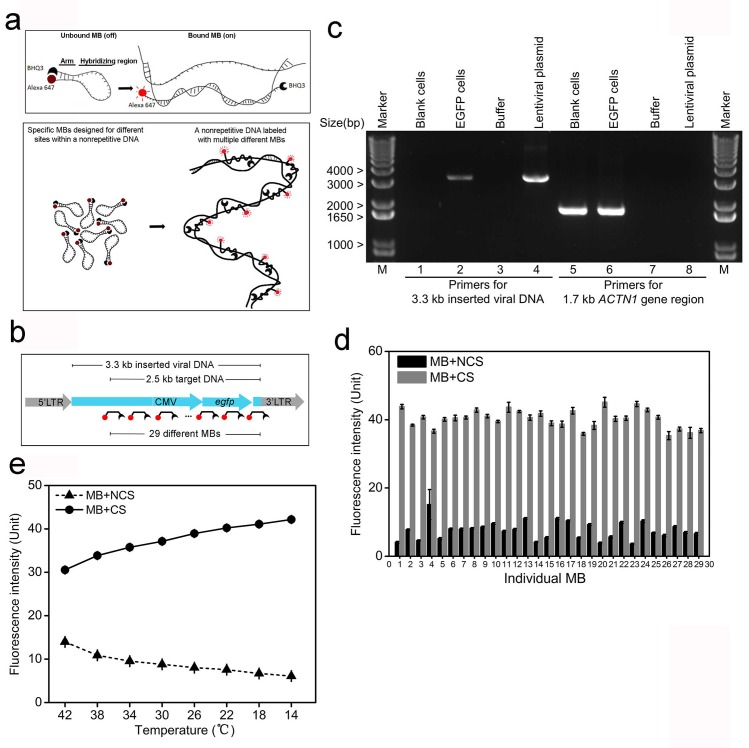
Figure 1. MB probes can efficiently reduce non-specific fluorescence and facilitate probe-target binding.

(a) Schematic illustration of the MB design for minimizing fluorescence of unbound/non-specifically bound probes. Alexa-647 and BHQ3 was conjugated to MB at 5’ and 3’ ends, respectively. Two short arms flanking the 42 bp hybridizing region are complementary and will bind to each other in the absence of a complementary sequence (CS) forming a hairpin structure that quenches the fluorescence (top). The set of MB probes were designed to tile along the non-repetitive target DNA in the nuclear genome and fluoresce only upon in situ hybridization to the target, which minimizes non-specific fluorescence (bottom). (b) Schematic illustration of the integrated viral DNA with the target in the inserted region. A 3.3 kb non-repetitive lentiviral region (blue) between 5’ and 3’ LTRs was randomly inserted into the human genome by viral infection. The target DNA was a 2.5 kb sequence containing a CMV promoter and an egfp gene within the 3.3 kb inserted region, which was then labeled with the 29 specific MB probes. Each MB is shown as broken-line with red dot (dye) and black crescent (quencher). (c) PCR confirmation of lentiviral integration in the human genome. Using primers targeting the 3.3 kb inserted lentiviral regions (lanes 1–4), a 3.3 kb electrophoretic band was amplified from the lentiviral plasmid (lane 4) and genomic DNA of EGFP cells (lane 2), but not from blank controls (lane 1) or PCR mixture without any template (lane 3). Using primers targeting a 1.7 kb portion of human ACTN1 gene (lanes 5–8), a 1.7 kb PCR product was amplified from genomic DNA of both cells (lanes 5 and 6). Lane Marker: different-sized (bp) DNA ladder bands are shown on the left of gel picture. (d) Fluorescence spectrophotometry measurements of 29 individual MB probes (numbered 1–29 in the x-axis) in FISH hybridization buffer with excessive amounts of the corresponding CS (gray bars) or NCSs (black bars) at room temperature. Representative results are shown from three independent experiments. Error bars, SEM. CS: complementary sequence, NCSs: non-complementary sequences. (e) Fluorescence spectrophotometry measurements of 29 individual MB probes in the FISH hybridization buffer with excessive amounts of the corresponding CS (solid line with circles) or NCSs (dashed lines with triangles) at different temperatures. Averaged fluorescence readings of the whole probe set are presented for each temperature decreasing from 42°C to 14°C (x-axis). Representative results are shown from three independent experiments. Error bars, SEM. CS: complementary sequence, NCSs: non-complementary sequences.

DOI: http://dx.doi.org/10.7554/eLife.21660.002

Figure 1—source data 1. Design of 29 specific MBs (Viral_MBs) for labeling the 2.5 kb integrated lentiviral target sequence.
Design of 29 Viral_MBs are shown in the table. Each Viral_MB was a 56-nt oligonucleotide composed of a 42-nt hybridizing region (upper-case) and two 7-nt flanking arms (lower-case). The hybridizing region melting temperature (hybridizing region Tm) was the temperature at which the hybridizing region dissociated from the complementary target sequence in the genome (denoted as sense/antisense stand as +/-). The arm melting temperature (arm Tm) was the temperature at which the two flanking arms dissociated from each other. The melting temperature (Tm) values were obtained from DINAMelt’s online ‘Quickfold Prediction’ tool. All MB sequences were BLASTed against the human genome and transcripts, and the maximum identical sequence was restrained to 22 nt.
DOI: 10.7554/eLife.21660.003
Figure 1—source data 2. Source data for 1d and e.
Fluorescence spectrophotometry measurements of 29 individual Viral_MB probes in FISH hybridization buffer with excessive amounts of the corresponding CS or NCSs at room temperature or averaged reading of the whole probe set at different temperature (42°C to 14°C).
DOI: 10.7554/eLife.21660.004

Figure 1.

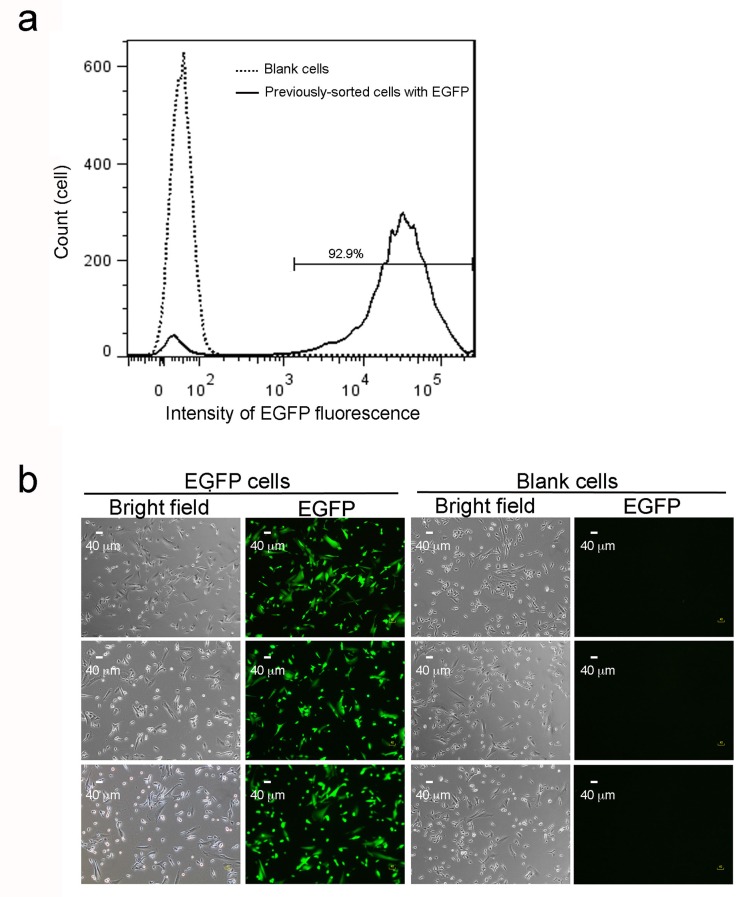
Figure 1—figure supplement 1. EGFP expression in sorted cells after multiple culture passages.

Figure 1—figure supplement 1.

(a) Flow cytometry analysis of 14,370 previously sorted EGFP cells after eight further culture passages. The solid line with two peaks indicate a major population (right peak) with maintained EGFP expression and a minor fraction (left peak) with lower fluorescence intensity. The dotted line reveals a single peak from 11,816 blank cells, which confirms the left peak (solid line) as a small fraction of cells losing EGFP expression. (b) EGFP cells were sorted by fluorescence cytometry 4 days after lentiviral infection and after eight further culture passages. Blank (non-infected) cells, sorted transfectants on coverslips, or EGFP before fixation were imaged under bright field. Scale bars are 40 μm. Three representative images are shown for each collection. 2. PCR confirmation of no tandem repeats of lentiviral integration in a single inserted locus in EGFP cells.
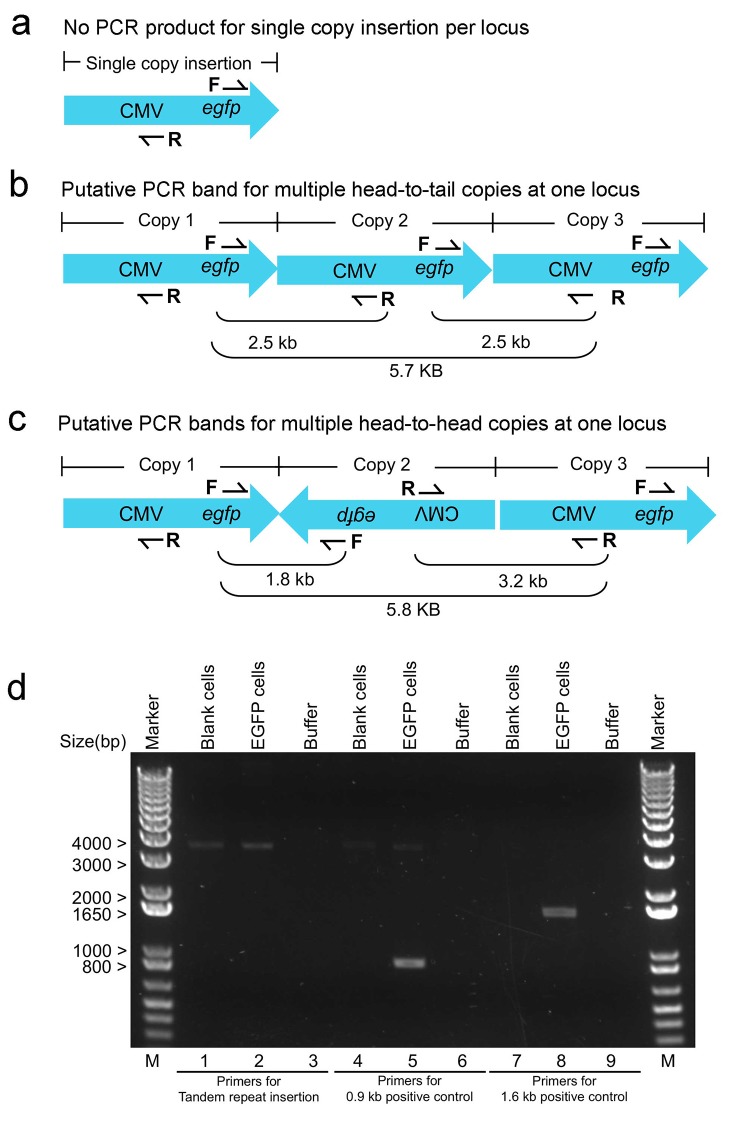
Figure 1—figure supplement 2. PCR confirmation of no tandem repeats of lentiviral integration in a single inserted locus in EGFP cells.

Figure 1—figure supplement 2.

(a) Schematic illustration of single-copy inserted viral DNA and a pair of upstream reverse (R) and downstream forward (F) primers used to detect tandem repeats insertion. (b,c) Multiple PCR bands could be amplified if there exists two or more copies inserted at the same site in a head-to-tail (b) or head-to-head fashion (c). PCR confirmed no tandem viral copies inserted at the same site. Using a pair of upstream reverse (R) and downstream forward (F) primers targeting tandem viral copies (lanes 1–3), no specific PCR bands were amplified from genomic DNA of EGFP cells (lane 2) or blank controls (lane 1). Pairing the downstream forward (F) primer with a downstream reverse primer (lane 4–6), a 0.9 kb PCR band was specifically amplified from genomic DNA of EGFP cells (lane 5) but not from blank controls (lane 4). Pairing the upstream reverse (R) primers with an upstream forward primer (lane 7–9), a 1.6 kb PCR band was specifically amplified from genomic DNA of EGFP cells (lane 8) but not from blank controls (lane 7). Lane Marker: the different sized (bp) DNA ladder bands are shown on the left of gel picture.
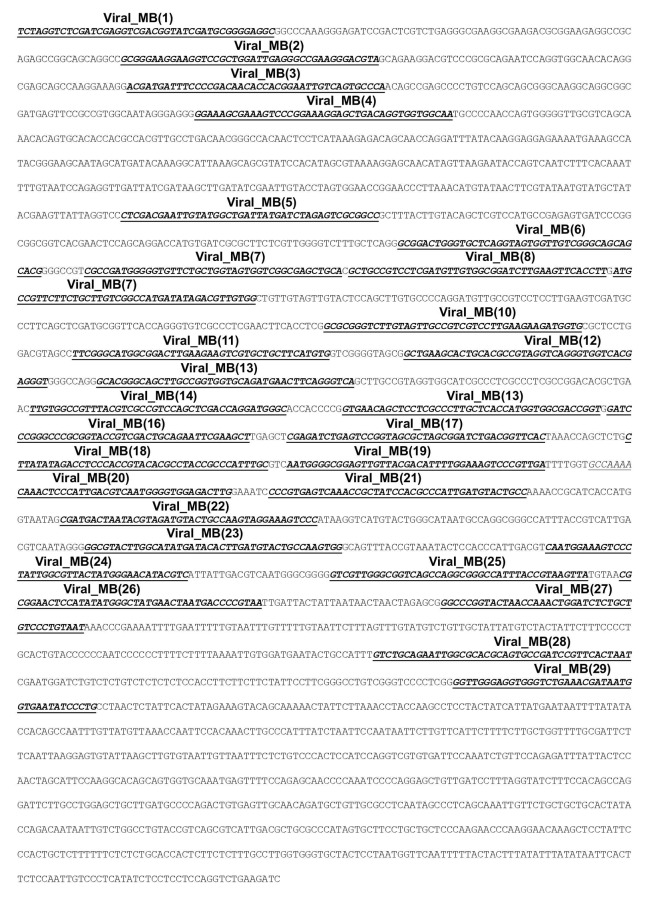
Figure 1—figure supplement 3. Sequence of inserted viral DNA with 29 sites for specific MB probes (Viral_MBs) within the 2.5 kb target region.

Figure 1—figure supplement 3.

Antisense strand of the 3.3 kb inserted viral DNA are shown as 100 bp per line. The 29 underlined sequences represented the specific binding sites for 29 specific Viral_MBs covering the 2.5 kb target region.