
Figure 5. Specific nanostructures of 2.5 kb MB-labeled Nanog enhancer in mESC nuclei.
(a) Fluorescence spectrophotometry measurements of 34 individual Nanog_MB probes (numbered 1–34 in the x-axis) in FISH hybridization buffer with excessive amounts of the corresponding CS (gray bars) or NCSs (black bars) at room temperature. Representative results show the inhibition of non-specific fluorescence was 15.8 ± 5.9% compared to the fluorescence reading in the presence of CS. Error bars, SEM. CS: complementary sequence, NCSs: non-complementary sequences. (b) Fluorescence spectrophotometry measurements of 34 individual Nanog_MB probes in the FISH hybridization buffer with excessive amounts of the corresponding CS (solid line with circles) or NCSs (dashed lines with triangles) at different temperatures. Averaged fluorescence readings of the whole probe set are presented for each temperature decreasing from 46°C to 14°C (x-axis). Representative results are shown from three independent experiments. Error bars, SEM. CS: complementary sequence, NCSs: non-complementary sequences. (c) PCR confirmation of homozygous knockout of MB-labeled Nanog enhancer from both alleles. Using primers targeting the endogenous 2.5 kb Nanog_MBs target region (lanes 1–3), a 2.5 kb electrophoretic band was amplified from genomic DNA of WT mESCs (lane 2) but not from HoKO mESCs (lane 1) or PCR mixture without any template (lane 3). Using primers targeting a 1.1 kb portion of mouse Actb gene (lane 4–6), a 1.1 kb PCR product was amplified from genomic DNA in both cells (lane 4 and 5). Lane Marker: the different sized (bp) DNA ladder bands are shown on the left of gel picture. (d) Representative specific nanostructures of MB-labeled 2.5 kb endogenous enhancer in Nanog locus in CJ9 mESCs (Cell I to VI). The conventional view of a cellular region in bright field (outlined in red) or excited by 405 nm or 641 nm lasers are shown in the top three rows (rows A, B, and C), respectively. The nanostructures were identified from the drift corrected STORM images corresponding to the green box region in conventional images (row D). Zoomed views of the white boxed regions in row D reveal more detailed morphology of the detected 3D structures (bottom row) with the localization number of each nanostructure shown in the lower-right corner. Each localization number represents the detected times of the Alexa-647 fluorophores labeled on DNA during the entire imaging process. STORM images are shown with rainbow color-coded z-axis information (color bar at the bottom, −350 to 350 nm). Three representative fluorescent dots visible under 641 nm laser excitation but not identified as specific nanostructures in STORM reconstruction are highlighted by blue arrows in panel C of Cell III. Scale bars are 1 μm in top three rows and 300 nm in bottom two rows. (e) Histograms of the normalized number of counts detected (Normalized intensity) along the cross-sections defined by the red lines (i–vi) in the STORM images in (d). Values of FWHM indicate the features above each structure along the transverse positions with 1D Gaussian fit.
DOI: http://dx.doi.org/10.7554/eLife.21660.012

Figure 5—figure supplement 1. Identification of nuclear periphery of mESCs by conventional co-imaging using bright field and DAPI staining.
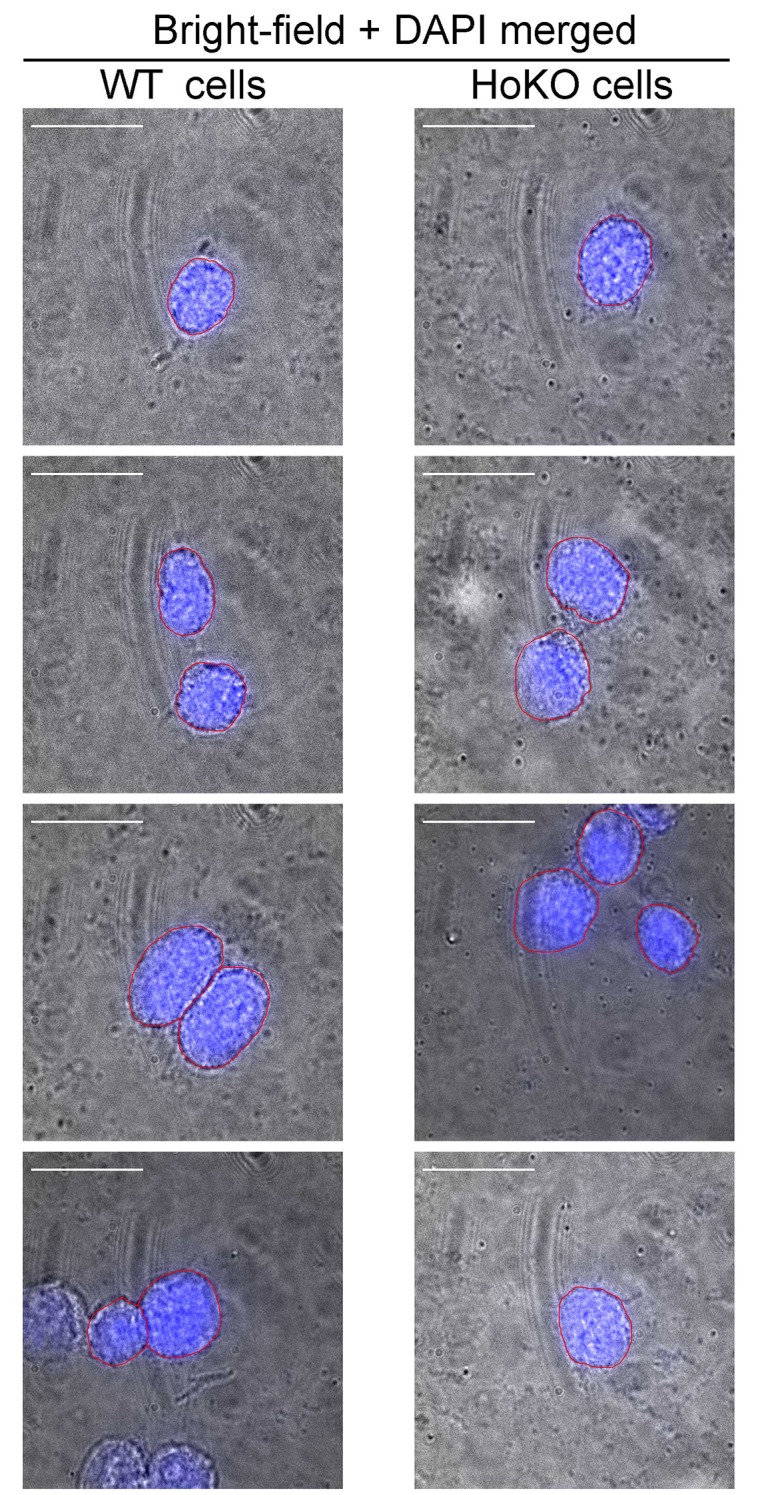
Figure 5—figure supplement 2. Sequence of endogenous DNA with 34 sites for specific MB probes (Nanog_MBs) within the 2.5 kb target region.

Figure 5—figure supplement 3. Sequence information of allele identified in homozygous knockout (HoKO) ESC clone.

Figure 5—figure supplement 4. A representative of identified nanostructure or excluded fluorescence noise and their corresponding appearances in 641 nm conventional imaging.
