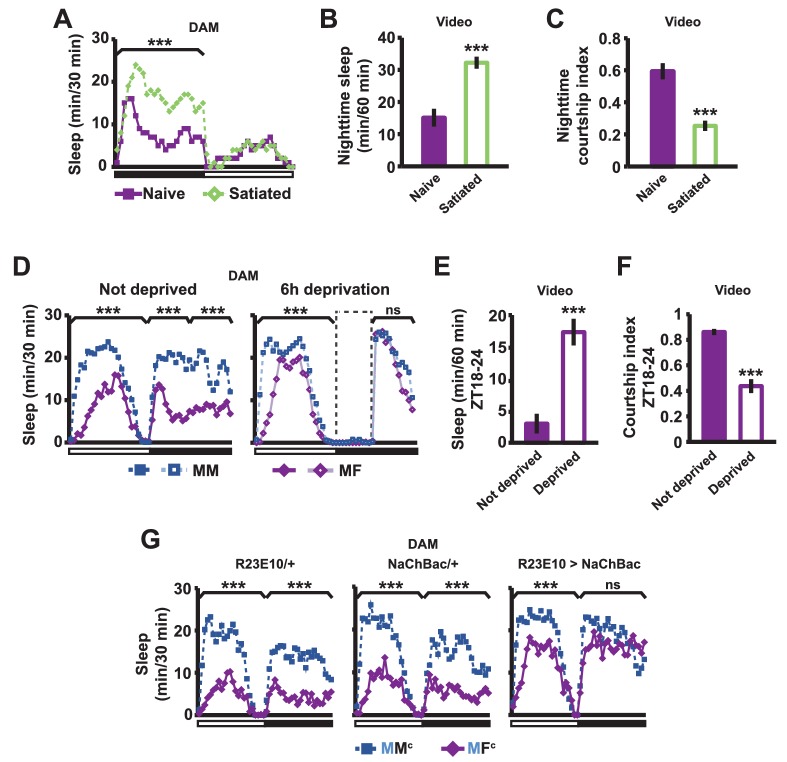
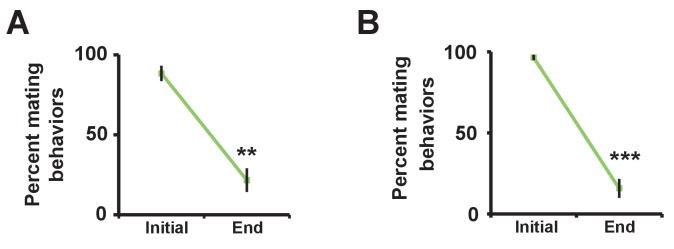
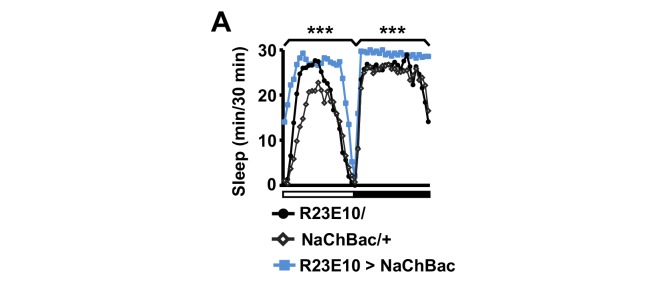
Figure 2. Sexual satiety and sleep deprivation attenuate female-induced sleep loss in males.
(A) Sleep profile of wild-type (iso31) MF pairs including satiated or non-satiated (naive) males assayed using single-beam monitors. N = 31–33. (B–C) Sleep amount (B) and courtship index (C) of males in MF pairs from video analysis of the first 5 min every nighttime hour. N = 38–40. (D) Sleep profile of wild-type (iso31) MM or MF pairs without sleep deprivation or with 6 hr sleep deprivation in the early night measured using single-beam monitors. Dotted rectangles indicate the period of sleep deprivation by mechanical stimulation. N = 38–42. (E–F) Sleep amount (E) and courtship index (F) of males in MF pairs without sleep deprivation or with 6 hr sleep deprivation in the early night. Sleep during the first 5 min every 30 min during 6 hr after sleep deprivation (ZT18 – ZT24) was scored from videos. N = 40–48. (G) Sleep profile of ‘experimental’ (R23E10>NaChBac, R23E10/+, or NaChBac/+) males, paired with iso31 control females (MFc) or control males (MMc) measured using multi-beam monitors. N = 28–30. Student’s t test (A–G) with Bonferroni correction (A, D, G). For statistical analysis, sleep amounts were summed and courtship index averaged over the periods indicated by the brackets above the sleep profiles or as noted on the y-axis of the bar graphs. For simplicity, in all figures involving comparison of a genotype against two parental controls, significant differences are indicated only if the experimental group differed significantly from both control groups in the same direction.


