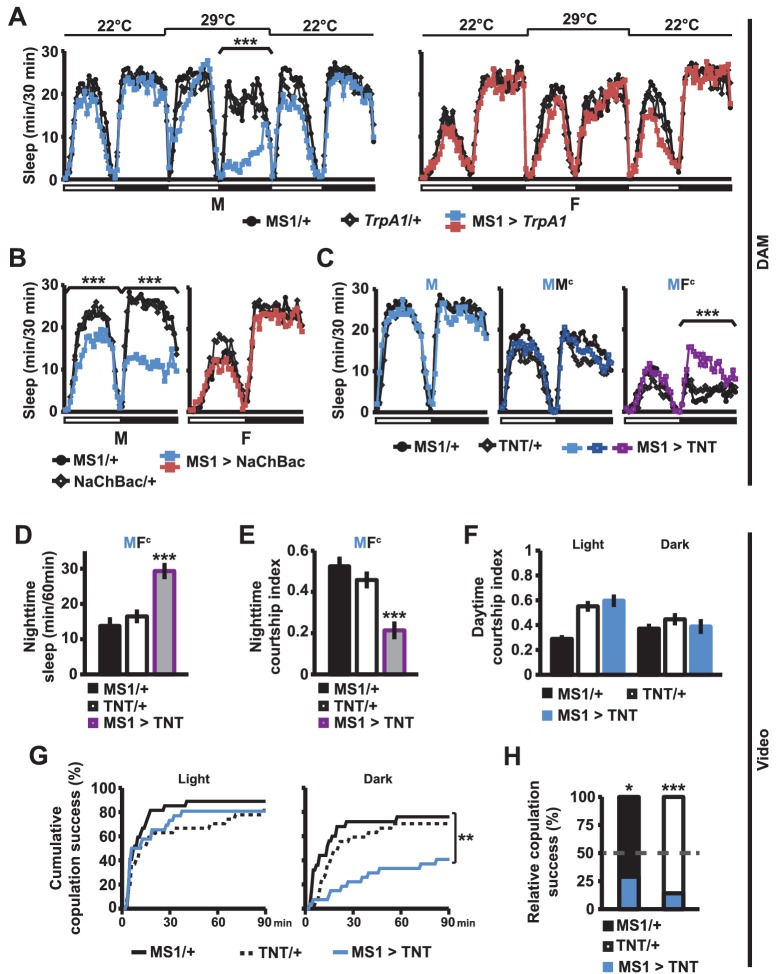
Figure 3. MS1 neuronal activity regulates sleep and mating behavior in males.
(A) Sleep profile of male (left) and female (right) flies expressing the warmth-activated TrpA1 channel in MS1 neurons (MS1>TrpA1) and control flies (MS1/+ and TrpA1/+). TrpA1 was activated by temperature shift from 22°C to 29°C. N = 32–40. (B) Sleep profile of flies expressing the NaChBac bacterial sodium channel in MS1 neurons and parental controls. N = 30–36. (C) Sleep profile of males expressing tetanus toxin in MS1 neurons (MS1>TNT) and parental controls (MS1/+ and TNT/+) in isolation (M) or paired with iso31 control males (MMc) or females (MFc) in multi-beam monitors. N = 37–49. (D–E) Sleep amount (D) and courtship index (E) of males with silenced MS1 neurons (MS1>TNT) and parental controls paired with control females. Videos were manually scored for sleep and courtship index during the first 5 min bins every hour at night and values summed (D) or averaged (E) for statistical analysis. N = 26–27. (F–G) courtship index (F), and cumulative copulation success (G) over 90 min mating assays. Males with silenced MS1 neurons (MS1>TNT) and parental controls were assayed in dim white light (left) or infrared light (right). N = 23–26. (H) Percentage of successful copulation by males with silenced MS1 neurons (MS1>TNT) against MS1/+ or TNT/+ controls in 90 min competitive copulation assays under dim red light. N = 29–34. One-way ANOVA followed by Dunnett post hoc test relative to both parental controls (A–F); log rank test (G); binomial test relative to 50% (H).

