Abstract
BACKGROUND:
Income-based deductibles are present in several provincial public drug plans in Canada and have been the subject of extensive debate. We studied the impact of such deductibles in British Columbia’s Fair PharmaCare plan on drug and health care utilization among older adults.
METHODS:
We used a quasi-experimental regression discontinuity design to compare the impact of deductibles in BC’s PharmaCare plan between older community-dwelling adults registered for the plan who were born in 1928 through 1939 (no deductible) and those born in 1940 through 1951 (deductible equivalent to 2% of household income). We used 1.2 million person-years of data between 2003 and 2015 to study public drug plan expenditures, overall drug use, and physician and hospital resource utilization in these 2 groups.
RESULTS:
The income-based deductible led to a 28.6% decrease in person-years in which public drug plan benefits were received (95% confidence interval [CI] −29.7% to −27.5%) and to a reduction in the per capita extent of annual benefits by $205.59 (95% CI −$247.81 to −$163.37). Despite this difference in public subsidy, we found no difference in the number of drugs received or in total drug spending once privately paid amounts were accounted for (p = 0.4 and 0.8, respectively). Further, we found only small or nonexistent changes in health care resource utilization at the 1939 threshold.
INTERPRETATION:
A modest income-based deductible had a considerable impact on the extent of public subsidy for prescription drugs. However, it had only a trivial impact on overall access to medicines and use of other health services. Unlike copayments, modest income-based deductibles may safely reduce public spending on drugs for some population groups.
Although every Canadian province provides universal coverage for hospital and physician services, drug coverage varies widely.1 Several provinces, including British Columbia, Saskatchewan, Manitoba, and Newfoundland and Labrador, have universal public drug coverage programs that use income-based deductibles. An income-based deductible is an amount that households are required to spend out of pocket before any drug costs are covered by the public drug plan. Income-based programs set this amount as a fixed percentage (e.g., 3%) of household income. Other provinces also use income-based programs for particular segments of the population, such as Ontario’s Trillium Program for residents under 65 years of age. Ontario has also publicly discussed requiring more financial contribution to drug benefits from upper-income households.2
The use of income-based deductibles is potentially problematic because there is extensive evidence, both from Canada and other countries, that out-of-pocket charges reduce drug use.3–5 Further, we know that cost-related nonadherence remains a problem for many Canadians.6 However, the specific impact of income-based deductibles remains less clear. For example, an analysis undertaken shortly after BC’s income-based Fair PharmaCare Plan was implemented in 2003 suggested the plan did not alter population-level use of prescription drugs.7 But the province’s previous drug plan already included high deductibles for adults under 65 years of age; therefore, the study was not a clean test of deductibles versus no deductibles. Similarly, evidence from Manitoba suggested that income-based deductibles decreased the use of inhaled corticosteroids by children with asthma.8 However, as with the BC study, the prior public drug plan in Manitoba included a deductible per family.8 Further, we lack information on the health impact of deductibles: a recent systematic review on the health impacts of prescription drug coverage found no studies specifically on deductibles.9
The uncertainty about the impact of income-based deductibles on drug use in Canada has led to a major debate on the role that such deductibles should play in provincial drug plans. A recent report from the Institute for Research on Public Policy concluded that BC’s Fair PharmaCare plan should not be emulated in other provinces,10 whereas others, such as the CD Howe Institute,11 have recommended the plan as a model policy for reforming Ontario’s public drug plan. To help inform this debate, we studied the impact of the income-based deductibles in the Fair PharmaCare plan on drug and health care utilization among older adults.
Methods
Study context
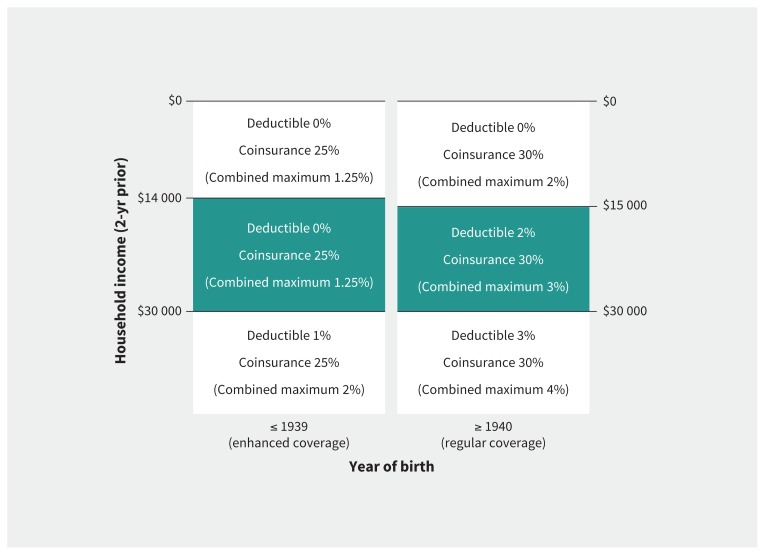
British Columbia offers its residents public drug coverage through the Fair PharmaCare plan. The income-based deductible for an individual or family enrolled in the plan is determined annually on the basis of the Canada Revenue Agency–verified net household income reported 2 years previously. Notably, the BC government maintained more generous coverage levels (so-called “enhanced coverage”) for individuals who were eligible for seniors’ drug benefits when the new plan was introduced (i.e., those born in 1939 or earlier).12 Other members of their household born after 1939 are also eligible. As shown in Figure 1, there are no deductibles for these households if the net income is less than $30 000; members pay coinsurance of 25% of drug costs, to a maximum of 1.25% of household income. In contrast, individuals born after 1939 who live in households with a net income between $15 000 and $30 000 face a 2% household deductible, after which they pay coinsurance of 30% of drug costs, to a maximum of 3% of household income. We leveraged this artificial break at 1939 to estimate the impact of deductibles within this income band.
Figure 1:
Design of enhanced and regular coverage in British Columbia’s Fair PharmaCare plan. Within each income band and birth-year group, individuals are responsible first for meeting their deductible and then for covering the copayments on the cost of medications (to the stated combined maximum percent of household income). The groups in the centre income band constitute the study population for this analysis.
Data sources
We used 3 population-based data systems on health services utilization in the province between 2003 and 2015. First, we captured data on individual prescriptions, including drug information, total cost and the publicly paid portion, from the BC PharmaNet system, an administrative database of all drug dispensations in the province.13 Second, we obtained information on fee-for-service physician consultations and expenditures through the Medical Services Plan billings data.14 Finally, we obtained information on all hospital admissions and lengths of stay in days from the Discharge Abstract Database.15
Study population
Our study focused on a population-based open cohort of adults eligible for coverage under the PharmaCare plan during the study period. We included only adults registered for Fair PharmaCare, because household income data were not available for nonregistered residents of the province. We excluded people who received drug benefits through the federal government, because they would not have been subject to the same program rules.
Our unit of observation was the person-year. We created our cohort by including all person-years for individuals born in 1928 through 1939 whose reported household income was between $14 000 and $30 000 (and thus had no income-based deductible) and those born in 1940 through 1951 whose reported household income was between $15 000 and $30 000 (and thus had a 2% income-based deductible ranging from $300 to $600). (Specifically, we included individuals registered for the entire year under Fair PharmaCare plan codes I8, I9, IA, IB, IC, ID or IE for regular coverage, and codes J5, J6, J7 or J8 for enhanced coverage.) We excluded person-years where the individual changed income bands during the year in question. We also excluded person-years where the individual had claims paid under other PharmaCare account codes in that year. (Other PharmaCare account codes included code B [permanent residents of licensed residential care facilities], code C [recipients of income assistance], code D [cystic fibrosis plan], code F [severely handicapped children in the community], code G [psychiatric medications plan] or code P [palliative care].)
Finally, because individuals younger than the oldest household member could receive enhanced coverage by virtue of living with someone born in 1939 or earlier, we limited our analysis to the oldest individual in each household unit.
Outcome measures
We studied the impact of income-based deductibles on 7 outcomes within the following 4 categories:
PharmaCare drug expenditure
We calculated the average amount paid by the PharmaCare program per person-year to estimate the impact of enhanced coverage on the availability and extent of public drug payment.
Prescription drug use and costs
We calculated the average prescription drug expenditure (both public and private), the average number of prescriptions dispensed and the number of unique medicines (based on level 7 Anatomical Therapeutic Chemical Classification codes) per person-year in our cohort.
Physician visits and costs
We calculated the average number of unique physician contacts and the average physician expenditure per person-year (adjusted for inflation using Statistics Canada’s consumer price index). We considered multiple billings from a unique patient and physician combination in the same day to represent a single visit.
Hospital admissions and days
We calculated the average number of days spent in hospital and average number of unique hospital admissions per person-year.
Statistical analysis
We used a regression discontinuity analysis, one of the strongest quasi-experimental research designs, to study the impact of deductibles on the above outcomes.16,17 This method leverages the quasi-random nature of the change in program design at the 1939 birth year to derive causal estimates of “real world” impacts.18 Because individuals on either side of this threshold are likely similar in terms of other characteristics, any abrupt differences in their drug and health services utilization can be attributed to the effects of the plan design. Observations in years further from the threshold aid in estimating the overall age-related trend. The main assumption in such an analysis is that all potential confounders do not have abrupt changes across this threshold. To test this assumption on observed covariates, we also estimated regression discontinuity models on the proportion of women and average household size. Regression discontinuity designs have a long history in economics and are gaining popularity in the medical literature.19,20
To fit our statistical models, we first determined the average for each outcome across all person-years in our data set. Using these aggregate figures, we fit linear regression models that included 6 terms: (1) an intercept term, (2) an incrementing variable for each year from 1928 onward to capture the slope, (3) the square of this term to capture any nonlinear trends in the outcomes, (4) an indicator variable for post-1939 observations, (5) an incrementing variable to capture the post-1939 slope in the outcome and (6) the square of this post-1939 slope to capture nonlinear trends. Our measure of interest was variable 4, which would represent abrupt changes in the outcome across the 1939 threshold. We also fit models to give more weight to observations closer to the 1939 threshold, which gave substantively similar results (triangular kernel weights, not shown).21
Ethics approval
This study received ethical approval from The University of British Columbia Behavioural Research Ethics Board.
Results
Cohort characteristics
After exclusions, our cohort consisted of 280 615 individuals who contributed 1 219 168 person-years of data (Appendix 1, available at www.cmaj.ca/lookup/suppl/doi:10.1503/cmaj.161119/-/DC1), or an average of 4.3 years. The cohort had roughly equal numbers of women and men (139 751 women, 49.8%), and the average age of individuals in their first year in the cohort was 66.7 years. We found no discontinuity in either sex or household size at the 1939 threshold (p = 0.51 and p = 0.17, respectively).
Public drug coverage
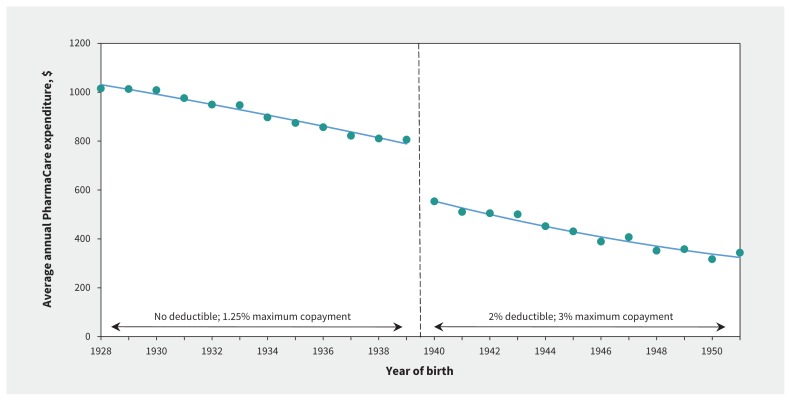
We found that the income-based deductible imposed on PharmaCare enrollees born after 1939 led to a sharp reduction in the proportion receiving public drug plan benefits. Our estimates showed that the 1939 threshold led to a 28.6% decrease in person-years with 1 or more claims where the public plan paid a portion (95% confidence Interval [CI] −29.7% to −27.5%; p < 0.001; Appendix 2, available at www.cmaj.ca/lookup/suppl/doi:10.1503/cmaj.161119/-/DC1). As shown in Figure 2, the average annual PharmaCare expenditure dropped by $205.59 per person per year at the 1939 threshold (95% CI −$247.81 to −$163.37; p < 0.001), which represented a 27.5% reduction.
Figure 2:
Average annual public expenditures by PharmaCare between 2003 and 2015, by year of birth. The discontinuity at the change in deductibles at the 1939 threshold led to a drop of −$205.59 in public expenditures (95% confidence interval −$247.81 to −$163.37), which represented a 27.5% reduction.
Prescription drug use and costs
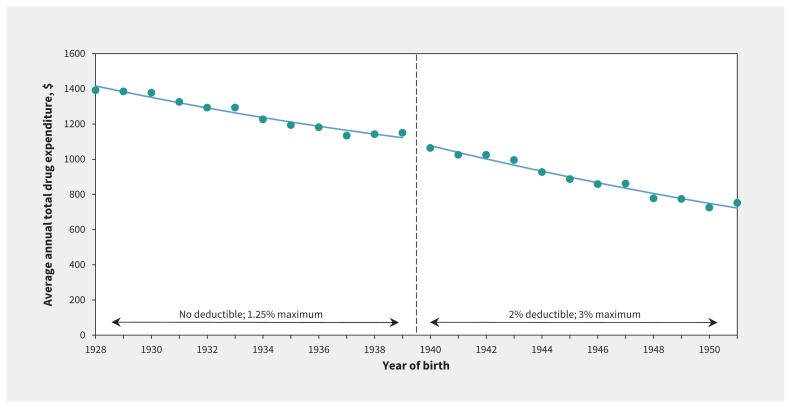
Despite the change in PharmaCare benefits, we found this did not translate into differences across the threshold in our overall measures of prescription drug use. Figure 3 shows the lack of change in overall drug spending, including both public and private sources (estimate −$6.60, 95% CI −$67.08 to $53.88; p = 0.8). We also found no clinically meaningful or statistically significant change in either the average annual number of prescriptions (estimate 0.54, 95% CI −0.89 to 1.97; p = 0.4; Appendix 3, available at www.cmaj.ca/lookup/suppl/doi:10.1503/cmaj.161119/-/DC1) or in the number of unique medicines (estimate −0.02, 95% CI −0.13 to 0.10; p = 0.7; Appendix 4, available at www.cmaj.ca/lookup/suppl/doi:10.1503/cmaj.161119/-/DC1).
Figure 3:
Average annual total drug expenditure (including public and private sources) between 2003 and 2015 in British Columbia, by year of birth. The discontinuity at the change in deductibles at the 1939 threshold led to a nonsignificant drop of $6.60 (95% confidence interval −$67.08 to $53.88), which represented a 2.4% reduction.
Physician visits and costs
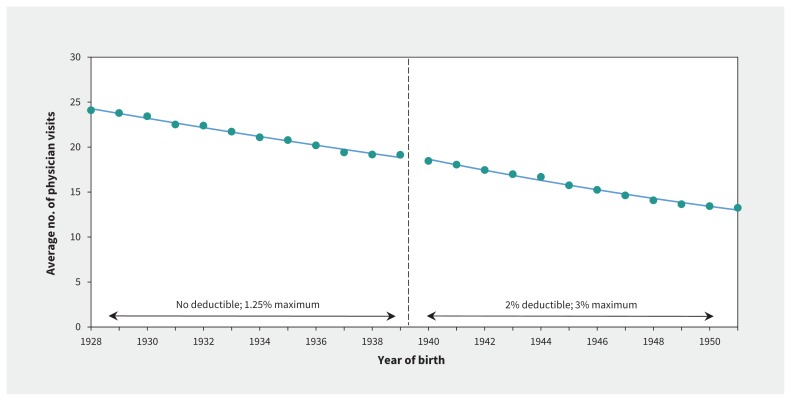
We observed only small changes in physician use across the 1939 threshold. As shown in Figure 4, we found no statistically significant change in the number of physician visits (estimate 0.44, 95% CI −0.11 to 0.99; p = 0.1). We did observe a statistically significant increase in physician expenditures of $45.87 per year (95% CI $10.77 to 80.97; p = 0.01; Appendix 5, available at www.cmaj.ca/lookup/suppl/doi:10.1503/cmaj.161119/-/DC1); this amount represented a 2.1% estimated increase across the threshold.
Figure 4:
Average annual number of physician visits between 2003 and 2015 in British Columbia, by year of birth. The discontinuity at the change in deductibles at the 1939 threshold led to a nonsignificant increase of 0.44 visits (95% confidence interval −0.11 to 0.99), which represented a 1.32% increase.
Hospital admissions and days
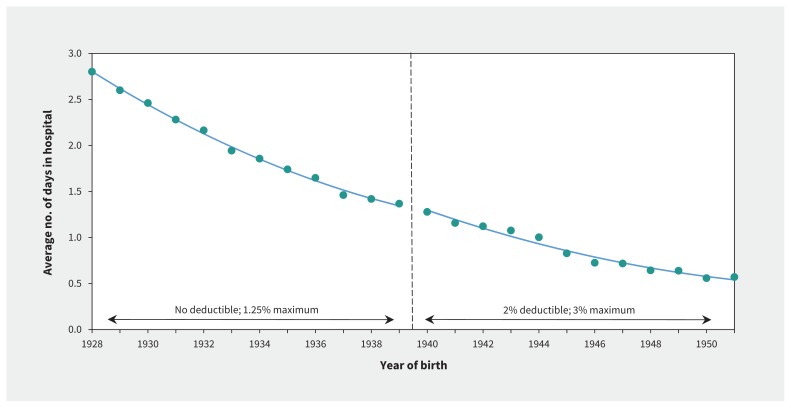
Our analysis found no meaningful changes in either the number of hospital admissions or the number of days spent in hospital. Figure 5 shows the average annual number of days in hospital across birth years, with no change evident at the 1939 threshold (estimate 0.06, 95% CI −0.04 to 0.16; p = 0.2). Similarly, we found no evidence of changes in the average number of unique hospital admissions (estimate 0.012, 95% CI −0.005 to 0.029; p = 0.2; Appendix 6, available at www.cmaj.ca/lookup/suppl/doi:10.1503/cmaj.161119/-/DC1).
Figure 5:
Average annual number of days in hospital between 2003 and 2015 in British Columbia, by year of birth. The discontinuity at the change in deductibles at the 1939 threshold led to a nonsignificant increase of 0.06 days (95% confidence interval –0.04 to 0.16), which represented a 1.87% increase.
Interpretation
We found that the imposition of a modest deductible of 2% of household income, in addition to coinsurance, on households earning between $15 000 and $30 000 reduced public drug expenditures and the proportion of people who qualified for public subsidy. At the same time, it did not reduce any of our measures of overall drug use, nor did it appear to affect the use of other health services, aside from a small increase in physician expenditures that was not accompanied by a rise in physician visit numbers. Given the limitations of prior research in this area, we think this represents the strongest evidence to date on the impact of income-based deductibles on the community-dwelling population of older adults in Canada.
Our results suggest that adding a modest deductible of 2% of household income in plans already requiring copayments was not associated with unintended consequences related to increased use of nonpharmaceutical health care in the older population we studied. This finding differs from the results of other Canadian studies, which showed that increased drug cost-sharing reduced drug use and increased use of other health services in at-risk groups (e.g., those on social assistance).3 These more vulnerable populations, including individuals on social assistance, those in long-term care facilities and people with a few specific health conditions, were not included in our analyses. One factor that may differ between these populations and the one we studied is the availability of private insurance, but data on the extent of retiree benefits in Canada are incomplete. Also, the scale of the deductible in question may also be a crucial factor in determining any impact on drug use. A recent study suggested that a different population — adults with cardiovascular-related chronic conditions spending at least 5% of their household income on drugs — were at elevated risk of cost-related nonadherence,22 whereas the deductible under review in our study was 2%.
Limitations
Although our study benefits from a strong quasi-experimental design, there are limitations worth noting. First, as with all regression discontinuity studies, we were able to estimate the impact of income-based deductibles only at the threshold, in this case for individuals born in 1939 and 1940. Thus, although our results likely extrapolate to other older adults, they may not apply to younger adults, children or specific vulnerable populations.
Second, the PharmaNet database does not contain data on the presence or lack of private drug insurance, so we could not study the degree to which that factor might insulate individuals from the PharmaCare deductibles. However, we think it is unlikely that rates of private coverage would have shown a break in trend at the 1939 threshold.
Third, we could not assess whether some households were intentionally lowering their incomes to obtain deductible-free coverage. Given the small financial reward for such changes, however, we think this is unlikely.
Finally, because of the structure of the Fair PharmaCare income bands, the lower limit of household income in the no-deductible group was $14 000, as compared with $15 000 in the deductibles group. Although this represents only a 6.7% lower income at the extreme, it may have resulted in bias in our results.
Conclusion
In recent years, there has been substantial debate in Canada over the role that income-based deductibles should play in public drug coverage. Our study showed that a modest income-based deductible had a considerable impact on the extent of public subsidy for prescription drugs. However, it had only a trivial impact on overall access to medicines and use of other health services. Our findings do not diminish the importance of coverage for more vulnerable populations, but rather they may increase the options available to policy-makers when considering health care financing reforms.
Acknowledgements
Michael Law received salary support through a Canada Research Chair and a Michael Smith Foundation for Health Research Scholar Award. Sumit Majumdar holds the Endowed Chair in Patient Health Management, supported by the Faculties of Medicine and Dentistry and of Pharmacy and Pharmaceutical Sciences, University of Alberta. Data for this study were obtained through Population Data BC, including data from the BC PharmaNet system. All inferences, opinions and conclusions drawn in this article are those of the authors and do not reflect the opinions of Population Data BC or the data steward(s).
See related article at www.cmaj.ca/lookup/doi/10.1503/cmaj.170169
Footnotes
Competing interests: Michael Law has consulted for Health Canada. Muhammad Mamdani has served as an advisory board member for AstraZeneca, Bristol-Myers Squibb Canada, Eli Lilly and Company, GlaxoSmithKline, Hoffmann–La Roche Limited, Novartis Phamarceuticals Canada Inc., Novo Nordisk and Pfizer Canada Inc. No other competing interests were declared.
This article has been peer reviewed.
Contributors: Michael Law conceived of and designed the study, acquired the data and interpreted the data. Lucy Cheng contributed to the study design, conducted the analyses and interpreted the data. Heather Worthington, Muhammad Mamdani, Kim McGrail, Fiona Chan and Sumit Majumdar contributed to the study conception and design, and the data interpretation. Michael Law drafted the manuscript, and Lucy Cheng, Heather Worthington, Muhammad Mamdani, Kim McGrail, Fiona Chan and Sumit Majumdar critically reviewed and revised it for intellectual content. All of the authors approved the final version of the manuscript to be published and agreed to act as guarantors of the work.
Disclaimer: Muhammad Mamdani is a member of CMAJ’s Editorial Board and was not involved in the editorial decision-making process for this article.
Funding: The study was funded by a research grant from the Institute for Health System Transformation and Sustainability (grant no. F15–00797).
References
- 1.Daw JR, Morgan SG. Stitching the gaps in the Canadian public drug coverage patchwork? A review of provincial pharmacare policy changes from 2000 to 2010. Health Policy 2012;104:19–26. [DOI] [PMC free article] [PubMed] [Google Scholar]
- 2.Radwanski A. Ontario Liberals mull means testing for provincial benefit programs. Globe and Mail [Toronto] 2013. March 7 Available: www.theglobeandmail.com/news/politics/ontario-liberals-mull-means-testing-for-provincial-benefit-programs/article9396879/ (accessed 2016 June 30).
- 3.Tamblyn R, Laprise R, Hanley JA, et al. Adverse events associated with prescription drug cost-sharing among poor and elderly persons. JAMA 2001;285:421–9. [DOI] [PubMed] [Google Scholar]
- 4.Goldman DP, Joyce GF, Zheng Y. Prescription drug cost sharing: associations with medication and medical utilization and spending and health. JAMA 2007;298:61–9. [DOI] [PMC free article] [PubMed] [Google Scholar]
- 5.Dormuth CR, Maclure M, Glynn RJ, et al. Emergency hospital admissions after income-based deductibles and prescription copayments in older users of inhaled medications. Clin Ther 2008;30:1038–50. [DOI] [PMC free article] [PubMed] [Google Scholar]
- 6.Law MR, Cheng L, Dhalla IA, et al. The effect of cost on adherence to prescription medications in Canada. CMAJ 2012;184:297–302. [DOI] [PMC free article] [PubMed] [Google Scholar]
- 7.Morgan S, Evans R, Hanley G, et al. Income-based drug coverage in British Columbia: lessons for BC and the rest of Canada. Healthc Policy 2006;2:115–27. [PMC free article] [PubMed] [Google Scholar]
- 8.Kozyrskyj AL, Mustard CA, Cheang MS, et al. Income-based drug benefit policy: impact on receipt of inhaled corticosteroid prescriptions by Manitoba children with asthma. CMAJ 2001;165:897–902. [PMC free article] [PubMed] [Google Scholar]
- 9.Kesselheim AS, Huybrechts KF, Choudhry NK, et al. Prescription drug insurance coverage and patient health outcomes: a systematic review. Am J Public Health 2015;105:e17–30. [DOI] [PMC free article] [PubMed] [Google Scholar]
- 10.Morgan SG, Daw JR, Law MR. Are income-based public drug benefit programs fit for an aging population? Montréal: Institute for Research on Public Policy; 2014. Available: http://irpp.org/research-studies/study-no50/ (accessed 2015 Jan. 19). [Google Scholar]
- 11.Busby C, Pedde J. Should public drug plans be based on age or income? Toronto: CD Howe Institute; 2014. Available: www.cdhowe.org/pdf/Commentary_417.pdf (accessed 2015 Jan. 19). [Google Scholar]
- 12.Understanding PharmaCare plans. Victoria: BC Ministry of Health, Medical Beneficiary and, Pharmaceutical Services Division; 2015. Available: http://www2.gov.bc.ca/assets/gov/health/health-drug-coverage/pharmacare/7-2.pdf (accessed 2016 Nov. 18). [Google Scholar]
- 13.PharmaNet. Data extract. Victoria: BC Ministry of Health, Data Stewardship Committee; 2014. Available: www.popdata.bc.ca/data/external/PharmaNet (accessed 2015 Oct. 29). [Google Scholar]
- 14.BC Ministry of Health. Medical Services Plan (MSP) payment information file. Data extract. Vancouver: Population Data BC; 2014. Available: www.popdata.bc.ca/data/internal/health/msp (accessed 2015 Oct. 29). [Google Scholar]
- 15.Canadian Institute for Health Information. Discharge Abstract Database (hospital separations). Data extract. Vancouver: Population Data BC; 2014. Available: www.popdata.bc.ca/data/internal/health/dad (accessed 2015 Oct. 29). [Google Scholar]
- 16.O’Keeffe AG, Geneletti S, Baio G, et al. Regression discontinuity designs: an approach to the evaluation of treatment efficacy in primary care using observational data. BMJ 2014;349:g5293. [DOI] [PubMed] [Google Scholar]
- 17.Moscoe E, Bor J, Bärnighausen T. Regression discontinuity designs are underutilized in medicine, epidemiology, and public health: a review of current and best practice. J Clin Epidemiol 2015;68:122–33. [DOI] [PubMed] [Google Scholar]
- 18.Venkataramani AS, Bor J, Jena AB. Regression discontinuity designs in healthcare research. BMJ 2016;352:i1216. [DOI] [PMC free article] [PubMed] [Google Scholar]
- 19.Bor J, Moscoe E, Mutevedzi P, et al. Regression discontinuity designs in epidemiology. Epidemiology 2014;25:729–37. [DOI] [PMC free article] [PubMed] [Google Scholar]
- 20.Smith LM, Kaufman JS, Strumpf EC, et al. Effect of human papillomavirus (HPV) vaccination on clinical indicators of sexual behaviour among adolescent girls: the Ontario Grade 8 HPV Vaccine Cohort Study. CMAJ 2015;187:E74–81. [DOI] [PMC free article] [PubMed] [Google Scholar]
- 21.Lee DS, Lemieux T. Regression discontinuity designs in economics. J Econ Lit 2010; 48:281–355. [Google Scholar]
- 22.Hennessy D, Sanmartin C, Ronksley P, et al. Out-of-pocket spending on drugs and pharmaceutical products and cost-related prescription non-adherence among Canadians with chronic disease. Health Rep 2016;27(6):3–8. [PubMed] [Google Scholar]


