

Abstract
Objectives
Late contrast enhancement visualizes myocardial infarction, but the contrast to noise ratio (CNR) is low using conventional CT. The aim of this study was to determine if spectral CT can improve imaging of myocardial infarction.
Materials and Methods
A canine model of myocardial infarction was produced in 8 animals (90-minute occlusion, reperfusion). Later, imaging was performed after contrast injection using CT at 90kVp/150kVpSn. The following reconstructions were evaluated: Single energy 90 kVp, mixed, iodine map, multiple monoenergetic conventional and monoenergetic noise optimized reconstructions. Regions of interest were measured in infarct and remote regions to calculate contrast to noise ratio (CNR) and Bhattacharya distance (a metric of the differentiation between regions). Blinded assessment of image quality was performed. The same reconstruction methods were applied to CT scans of four patients with known infarcts.
Results
For animal studies, the highest CNR for infarct vs. myocardium was achieved in the lowest keV (40 keV) VMo images (CNR 4.42, IQR 3.64–5.53), which was superior to 90 kVp, mixed and iodine map (p=0.008, p=0.002, p<0.001, respectively). Compared to 90 kVp and iodine map, the 40 keV VMo reconstructions showed significantly higher histogram separation (p=0.042 and p<0.0001, respectively). The VMo reconstructions showed the highest rate of excellent quality scores. A similar pattern was seen in human studies, with CNRs for infarct maximized at the lowest keV optimized reconstruction (CNR 4.44, IQR 2.86–5.94).
Conclusions
Dual energy in conjunction with noise-optimized monoenergetic post-processing improves CNR of myocardial infarct delineation by approximately 20 – 25%.
Keywords: Dual energy CT, Virtual monoenergetic, Infarct, delayed iodine CT
1. Introduction
Routine detection of myocardial scar by CT remains problematic due to the relatively low iodine concentrations found in scar tissue on late contrast enhancement (LCE) images. Low kV acquisitions, dual energy and spectral imaging have a potential for improving LCE CT of myocardial scar. In particular, low energy virtual monoenergetic reconstructions may be useful to increase the iodine signal; however, the involved complex calculations may lead to disproportionally high image noise, which is a disadvantage of low kV monoenergetic reconstructions. Novel algorithms mitigate this increase in noise by combining a low noise reconstruction with a high contrast reconstruction1.
The aim of this study was to determine if spectral CT can improve CNR for LCE CT imaging of infarction. We compared spectral CT monoenergetic images with conventional CT, mixed images (weighted linear blending of 60% low energy image and 40% high energy image) and iodine maps in a large animal model of chronic infarction. We evaluated image quality by expert readers and infarct delineation by histology. To determine clinical applicability of the animal results, we applied similar reconstructions to CT scans performed in a group of four patients with myocardial infarction.
2. Materials and Methods
2.1 Animal Model
All experiments were approved by our institution’s animal care and use committee and were performed under the care of a veterinarian. Adult male mongrel dogs (weight 26–30 kg) were included in the chronic myocardial infarction (MI) model2,3. Induction of MI was performed by vascular clamp occlusion of the left anterior descending (LAD) artery for 90 minutes followed by reperfusion. Imaging was performed at 6–8 weeks. All animals were anesthetized, intubated and ventilated in preparation for imaging studies. Propofol IV was given to allow intubation and anesthesia was maintained with isoflurane (0.5–2.5%) and oxygen (2 liter/min flow). MRI was performed with late gadolinium enhancement (0.2 mmol/kg Gd-DOTA meglumine) to confirm the presence of infarction.
2.2 Image Acquisition
Animal CT scans: A dual source dual-energy scanner was used (SOMATOM Force, Siemens Healthcare GmbH, Erlangen, Germany). A retrospectively ECG-gated spiral acquisition was performed with tube voltages set to 90/150kVpSN (150kv with tin filter applied). Electrocardiographically triggered x-ray tube modulation (ECG pulsing) was applied with a pulsing window of 40–90% of the cardiac cycle. Gantry rotation time was 250 msec. Tube currents and doses are listed in table 1. Images were acquired 12 minutes after a contrast bolus of iopamidol (Isovue 370 Bracco, Singen, Germany) at a dose of 1.5 ml/kg body weight. Up to 15 mg metoprolol IV was used for heart rate control. The kernel Qr36 was used to reconstruct images with 0.5 mm slice thickness and 0.5 mm increments.
Table 1.
Animal and human subject characteristics/CT scan parameters.
| Animal | Human | |
|---|---|---|
| N | 8 | 4 |
| Age (years, mean (sd)) | 1.35 (0.13) | 77.00 (8.12) |
| Sex = M (%) | 8 (100.0) | 3 (75.0) |
| Weight (kg, mean (sd)) | 27.61 (2.88) | 83.95 (21.70) |
| Height (m, mean (sd)) | NA | 1.65 (0.10) |
| Heart Rate (mean (sd)) | 94.12 (11.72) | 57.25 (3.77) |
| LV EF (%, mean (sd)) | 30.88 (10.26) | 52.50 (11.73) |
| Sinus rhythm (%) | 100 | 100 |
| mAs/rot 90kVp (mean (sd)) | 187.88 (25.10) | 281.75 (0.50) |
| mAs/rot 150kVp (mean (sd)) | 144.75 (19.09) | 196.00 (0.00) |
| Dose (mSv, mean (sd)) | 5.87 (2.03) | 4.01 (0.52) |
| DLP mGycm(mean (sd)) | 418.95 (145.35) | 286.62 (36.92) |
| CTDIvol mGy (mean (sd)) | 27.11 (8.05) | 18.46 (0.01) |
Patient CT scans: All patients were enrolled in an IRB-approved, HIPAA-compliant prospective study of cardiac dual energy CT. Informed consent was obtained. Patient scans were selected from a larger dual energy study which included patients who were evaluated for interventional treatment of severe aortic stenosis and did not have contraindications for iodine contrast. A subset of 4 patients with clearly identifiable myocardial scar (≥ 2 segments) and presence of coronary artery disease was selected for this analysis. Scan Protocol: A dual source dual-energy scanner was used (SOMATOM Force, Siemens Healthcare GmbH, Erlangen, Germany). Prospective gating was used at +300 msec after the R wave. The tube voltage was set to 90/150kVpSN. The care dose quality reference standard was set to 800 mAs. Gantry rotation time was 250 msec. Late contrast enhancement images were obtained 10 minutes after administration of 130 ± 31 ml intravenous iodinated contrast (iodixanol 320 mg/ml, GE Healthcare). No medication was given for heart rate control. The kernel Qr40 was used and images were reconstructed at a slice thickness of 1.5 mm.
2.3 Image reconstruction and post-processing
2.3.1 Virtual monoenergetic reconstructions (VMo)
The software syngo.via (Siemens Healthcare GmbH, Erlangen, Germany) was used to generate virtual monoenergetic reconstructions (termed “virtual monoenergetic conventional”, VMc). In addition, virtual monoenergetic noise optimized reconstructions (VMo) were generated with the advanced algorithm in syngo.via (referred to by the vendor as the “Mono+” setting1).
This novel algorithm mitigates noise in low keV images. Two sets of images are generated for this approach: First, a low keV (40 keV) reconstruction with high iodine contrast but high noise level and second, a low noise reconstruction at 70 keV (image noise is typically lowest in this reconstruction). Using a frequency split method from each image a high frequency and low frequency subset is generated. The low frequency 40 keV image and the high frequency 70 keV image are combined. This preserves the high iodine contrast of 40 keV images while still benefitting from low noise and high detail delineation of the 70 keV image.
2.3.2 Animal Scans
Twenty-seven different reconstructions were evaluated in each of the eight animals, including 1) single energy 90 kVp, 2) mixed (linear blending, weighting factor = 0.6: HUmixed = 0.6 · HU90kVp + 0.4·· HU150kVpSN), 3) iodine map reconstructions, 4) Virtual monoenergetic conventional (VMc) 40–150 keV and 5) virtual monoenergetic noise optimized (VMo) 40–150 keV (using syngo.via software, Siemens Healthcare GmbH, Erlangen, Germany).
2.3.3 Human scans
The same reconstructions described above for the animal scans were also applied to human data. However, the monoenergetic range of VMc and VMo reconstructions was from 40–100 keV (at 10 keV increments); reconstructions at energies more than 100 keV showed no visually apparent evidence of myocardial infarction and were thus not evaluated.
2.4 Image Analysis
Image analysis was performed using ImageJ (version 1.48v, NIH, Bethesda, MD). Carefully placed regions of interest (ROI) were positioned within the infarcted and non-infarcted myocardium as well as the LV blood pool, ensuring that all ROIs were within the correct tissue type. The median ROI area was 97 mm2. For each scan, each of the spectral CT reconstructions had identical positions because ROIs were copied from the first reconstruction to all others, and all reconstructions were spatially registered by their DICOM coordinates. Noise (the standard deviation of the non-infarcted myocardium), signal to noise (SNR) and contrast to noise (CNR) were calculated as previously described4. CNR was calculated as (mean HU infarct – mean HU remote myocardium)/standard deviation (remote myocardium). CNR was measured in up to 5 adjacent axial slices; mean values for each were used. Similarly, SNR was defined as mean HU infarct/standard deviation remote myocardium. In addition, we measured the HU attenuation of myocardium before iodine injection in the LV free wall.
2.4.1 Animal studies
Histopathologic analysis provided the location of each infarction. Corresponding images were blinded to spectral acquisition type by one member of the study team; image quality assessment was performed by a different observer (more than 5 years of experience in cardiac imaging) blinded to all technical parameters and in random order. Image quality was visually evaluated using a predetermined scoring scheme for infarct delineation (1: no infarct seen, 5: excellent infarct visualization) and overall image quality (1: non-diagnostic, 5: excellent). The reproducibility was excellent for infarct delineation assessment (ICC = 0.76) and good for overall image quality assessment (ICC = 0.68).
2.4.2 Human studies
Quantitative analysis was performed in an analogous manner to animal studies. Myocardial infarct territory was determined by visual inspection and correlation with clinical data, including ECG, wall motion abnormality and angiographic diseased coronary artery territory.
2.5 Statistical analysis
R (Version 3.2.1, https://www.r-project.org/) was used for statistical analysis. Measurements are reported as median and interquartile range or as mean ± standard deviation. Testing for group differences in multiple testing was performed using the Friedman test and the post-hoc Conover test. A p-value <0.05 was considered significant. As an additional metric of image quality, the separation between infarct and non-infarcted myocardial HU histograms (Bhattacharyya distance) was calculated using the R package fpc. This parameter takes into account the means and standard deviations of two HU histograms and has been shown to correlate well with the success of computer-based segmentation in imaging tasks5.
3 Results
3.1 Animal myocardial infarction model
The animal characteristics and CT scan parameters are shown in table 1. As expected in the infarct animal model, the LV function was decreased moderately. The heart rate was in the upper range despite treatment with metoprolol.
Spectral CT was performed 3–4 hours after the gadolinium procedure at which time non-contrast CT images showed uniform myocardial attenuation with HU values within the expected range for myocardium (measured: 43.9 ± 4.2 HU, expected: 46.0 ± 3 HU [separate measurements in canine without prior gadolinium exposure], p = 0.33).
3.1.1 CNR measurements
Table 2 shows mean CNR, SNR and HU separation for all spectral reconstructions. Figure 1a shows CNR between infarcted and non-infarcted myocardium and HU separation (Bhattacharyya) for all spectral reconstructions. A summary of each class of spectral image reconstruction follows:
Table 2.
CNR, SNR and HU separation for the tested reconstructions (bold = best result).
| Type | Reconstruction | CNR (IQR) | SNR (IQR) | HU Separation (IQR) |
|---|---|---|---|---|
| Single90kVp | 3.35 (2.83–4.43) | 10.8 (9.4–13.3) | 1.058 (0.672–1.40) | |
| Mixed | 3.47 (2.87–4.27) | 12.7 (11.5–15.0) | 1.070 (0.802–1.35) | |
| Iodine Map | 3.66 (2.15–4.44) | 6.1 (5.1–7.7) | 1.160 (0.495–1.39) | |
|
| ||||
| Conventional | Mono40keV | 2.53 (1.79–3.08) | 5.7 (4.8–6.8) | 0.605 (0.345–0.86) |
| Conventional | Mono50keV | 2.84 (2.24–3.66) | 7.5 (6.2–9.1) | 0.736 (0.494–1.09) |
| Conventional | Mono60keV | 3.31 (2.82–4.40) | 10.7 (9.2–13.0) | 0.976 (0.669–1.38) |
| Conventional | Mono70keV | 3.44 (2.86–4.24) | 12.6 (11.5–14.9) | 1.060 (0.806–1.34) |
| Conventional | Mono80keV | 2.47 (2.20–3.09) | 10.6 (9.8–11.9) | 0.731 (0.532–0.90) |
| Conventional | Mono90keV | 1.67 (1.39–2.17) | 8.3 (7.7–9.1) | 0.407 (0.240–0.57) |
| Conventional | Mono100keV | 1.20 (0.91–1.62) | 6.7 (6.3–7.3) | 0.243 (0.124–0.38) |
| Conventional | Mono110keV | 0.93 (0.65–1.30) | 5.8 (5.5–6.2) | 0.164 (0.076–0.26) |
| Conventional | Mono120keV | 0.75 (0.50–1.09) | 5.2 (4.9–5.5) | 0.123 (0.055–0.17) |
| Conventional | Mono130keV | 0.65 (0.37–0.95) | 4.8 (4.5–5.0) | 0.095 (0.045–0.13) |
| Conventional | Mono140keV | 0.59 (0.27–0.83) | 4.5 (4.2–4.6) | 0.076 (0.050–0.11) |
| Conventional | Mono150keV | 0.52 (0.20–0.75) | 4.3 (4.0–4.4) | 0.066 (0.051–0.10) |
|
| ||||
| Optimized | Mono40keV | 4.24 (3.64–5.53) | 11.7 (8.9–12.9) | 1.382 (0.871–1.70) |
| Optimized | Mono50keV | 4.05 (3.42–5.27) | 12.4 (9.6–13.9) | 1.256 (0.906–1.65) |
| Optimized | Mono60keV | 3.78 (3.08–4.84) | 12.6 (10.8–14.8) | 1.171 (0.779–1.54) |
| Optimized | Mono70keV | 3.46 (2.87–4.28) | 12.7 (11.4–15.1) | 1.069 (0.799–1.36) |
| Optimized | Mono80keV | 3.01 (2.65–3.57) | 12.3 (11.3–14.3) | 0.953 (0.750–1.11) |
| Optimized | Mono90keV | 2.42 (2.03–3.07) | 11.2 (10.4–12.7) | 0.734 (0.476–0.98) |
| Optimized | Mono100keV | 2.00 (1.58–2.66) | 10.4 (9.7–11.5) | 0.575 (0.316–0.85) |
| Optimized | Mono110keV | 1.71 (1.27–2.35) | 9.7 (9.1–10.6) | 0.468 (0.222–0.65) |
| Optimized | Mono120keV | 1.50 (1.09–2.12) | 9.2 (8.7–9.9) | 0.385 (0.168–0.52) |
| Optimized | Mono130keV | 1.34 (0.95–1.87) | 8.8 (8.4–9.3) | 0.313 (0.139–0.44) |
| Optimized | Mono140keV | 1.26 (0.80–1.66) | 8.5 (8.2–8.9) | 0.265 (0.120–0.38) |
| Optimized | Mono150keV | 1.15 (0.68–1.55) | 8.3 (8.0–8.6) | 0.232 (0.107–0.33) |
Figure 1.

Contrast-to-noise-ratio (CNR) (A) and HU separation (Bhattacharyya) values (B) for canine chronic myocardial infarction. Highest CNRs and HU separation are found in monoenergetic 40keV noise optimized reconstructions. VMc = virtual monoenergetic conventional reconstruction; VMo = virtual monoenergetic noise optimized reconstruction. VMo reconstructions combine low spatial frequency information from low keV images and high spatial frequency from low noise 70 keV images to provide a noise optimized high contrast image.
Single energy and linear mix dual energy
The standard reconstructions of 90 kVp and mixed achieved a CNR of 3.35 (IQR 2.83–4.43) and CNR 3.47 (IQR 2.87–4.27), respectively.
Non-linear spectral reconstructions
The highest CNR was achieved in the lowest keV (40 keV) VMo images (CNR 4.42, IQR 3.64–5.53). The optimized 40 keV VMo reconstruction showed significantly better CNR in comparison to the other non-linear post-processing methods including the iodine map (CNR 3.66, IQR 2.15–4.44) and 40 kV VMc (CNR 2.53, IQR 1.79–3.08, p<0.001 for both). There was also a significant advantage for 40 keV VMo compared to the standard 90 kVp and linear mixed dual energy, (p=0.008 and p=0.002, respectively). The relative improvement of CNR for 40 keV VMo was 26.5 % and 27.3%, respectively.
In comparison with conventional monoenergetic reconstructions (without advanced noise processing) the VMo reconstructions in general, showed higher CNRs across a wide range of keVs, except for 70 keV where CNRs were equal. For conventional monoenergetic, the CNR was highest at 70 keV (CNR 3.44, IQR 2.86–4.24) while for the VMo reconstructions the optimal CNR was achieved at 40 keV. Figure 2 shows examples of image quality for various monoenergetic keVs.
Figure 2.
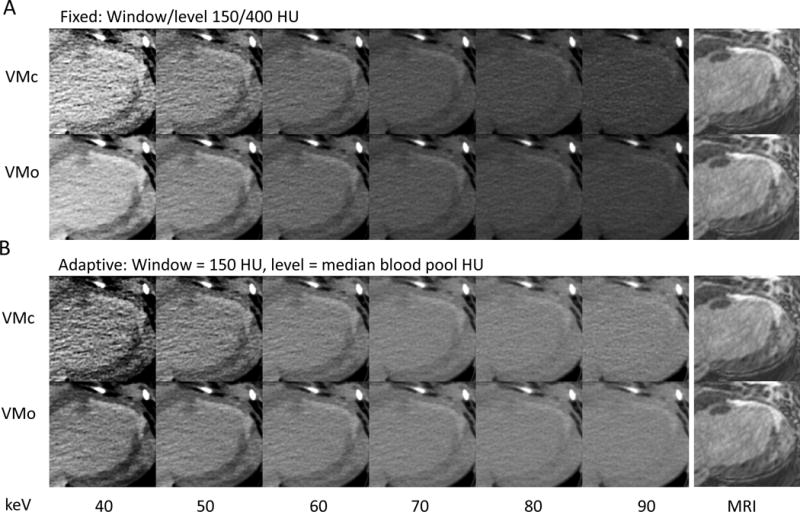
Visualization of chronic myocardial in a canine model. A long-axis delayed contrast CT reconstruction of the myocardium is shown; the far right column shows the late gadolinium enhancement MRI for comparison. CT reconstructions are shown for 40 to 90 keV monoenergetic reconstructions. VMc = virtual monoenergetic conventional reconstruction; VMo = virtual monoenergetic noise optimized reconstruction.
A) Images at fixed window/level settings. The upper row shows the conventional (VMc) and the lower row the optimized algorithm (VMo). HU increase in general from right to left (higher to lower keV).
B) Same data as (A), with fixed window 150 HU but level settings were set to the median HU of the blood pool for normalization. In both A and B, the excessive noise of the conventional algorithm (VMc) becomes apparent at 40 and 50 keV, while the optimized (VMo) images maintain acceptable noise levels and provide high contrast.
3.1.2 HU histogram separation
Image quality is a broadly defined property and CNR alone may not fully reflect the ability to detect infarcts because it does not incorporate the noise texture and resolution as well as size of the affected region and standard deviation of the infarcted region signal6, 7. We used the Bhattacharya distance as an additional measurement to evaluate the separation between HU in non-infarcted myocardium and infarct in the animal model. The metric describes the separation of two probabilistic distributions (higher distance implicated better ability to separate voxels). The results are shown in table 2 and figure 1b. In line with the CNR results, the highest separation was found in 40 keV monoenergetic noise optimized reconstructions. There was a significant difference for 40 keV VM+ compared with 90 kVp single energy and the iodine map (p=0.042 and p<0.0001, respectively) while the difference to the mixed image did not show statistical significance (p=0.079). Similar to the CNR results, the 40 keV monoenergetic conventional reconstruction showed significantly lower separation compared with 40 keV VMo (p<0.0001).
3.1.3 Image Noise
Figure 3 shows image noise in the myocardium for the various reconstructions in the animal scans. Noise levels for VMc reconstructions increase drastically below 60 keV while VMo has only a modest increase in noise at low kV (noise at 40 kV was 38.1 HU vs. 17.7 HU for VMc and VMo, respectively).
Figure 3.
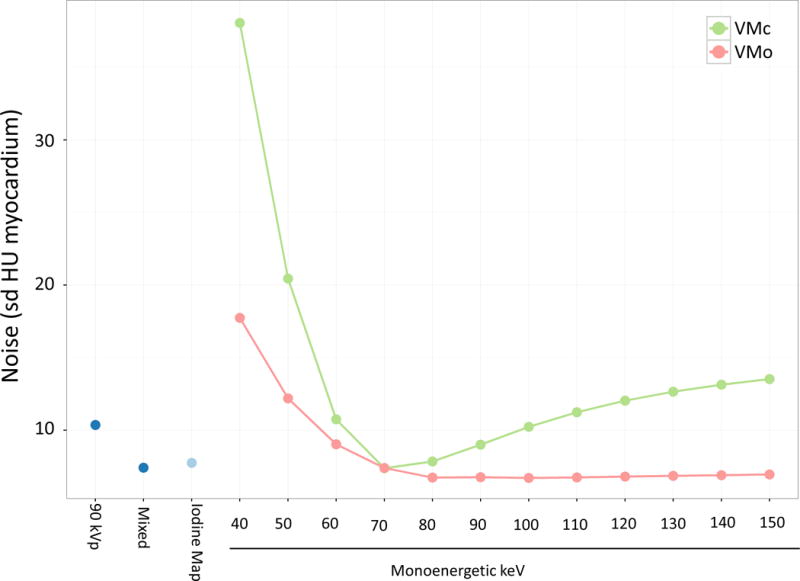
Noise measurements (defined as HU standard deviation of myocardium) obtained from a canine model of chronic myocardial infarction for 90 kVp, mixed 90/150kVp, iodine map and monoenergetic reconstructions. VMc = virtual monoenergetic conventional reconstruction; VMo = virtual monoenergetic “optimized” reconstruction (green: VMc, red: VMo). These results show excessive image noise particularly for monoenergetic conventional reconstructions at low keV (i.e., less than 70 keV). Noise levels are substantially lower in the monoenergetic “optimized” reconstruction.
3.1.4 Visual Assessment
For visual quantification of image quality in the animal studies, we assessed the standard 90 kVp and mixed reconstructions for comparison. In addition, we evaluated the reconstruction with the highest CNR (40 keV VMo) and its non-optimized counterpart (40 keV VMc).
Figure 4 shows the reader assessment of infarct delineation and overall image quality. Significant differences between the various acquisitions were seen (Friedman test, p < 0.001 for both, infarct delineation and overall image quality). The 40 keV VMo reconstruction had the highest rate of excellent quality scores for infarct delineation and overall image quality (25% and 12.5% respectively), while for 40 keV conventional reconstructions the number of excellent scores was 0. For infarct delineation, the higher quality of 40 keV VMo was statistically significant for mixed, 90 kVp and 40 keV VM conventional (Conover post hoc test p<0.0001). For overall image quality 40 keV VM conventional quality was significantly lower compared with 40 keV VMo, 90 kVp and mixed (p values <0.0001).
Figure 4.
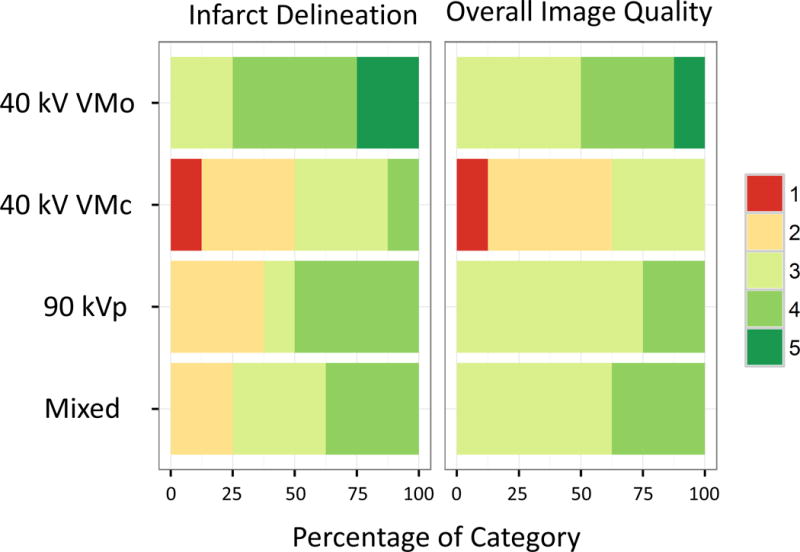
Subjective quality assessment of chronic canine myocardial infarction in relation to pathology findings (left panel) and overall image quality (right panel). Colored bars show the proportion of quality scores (1 lowest – 5 highest quality). The noise optimized reconstructions (VMo) at 40 keV have the highest number of excellent quality scores for infarct delineation and overall quality. VMc = virtual monoenergetic conventional reconstruction; VMo = virtual monoenergetic “optimized” reconstruction.
3.2 Human myocardial infarction
Figure 5 shows the CNRs for human CT scans. The results are similar to the measurements in the animal model. The highest CNR for infarct vs. myocardium was again seen in the optimized 40 keV VMo reconstruction (4.44) while the CNR in the 40 keV VMc reconstruction was significantly lower (1.79, p = 0.032). The CNR in 40 keV VMo was also significantly higher than in the mixed image (CNR 4.44 vs. 2.17, p = 0.003).
Figure 5.

Contrast-to-noise-ratio (CNR) for human chronic myocardial infarction. CNR between infarcted and non-infarcted myocardium is shown for 90 kVp, mixed 90 kVp/150kVp, iodine map and monoenergetic reconstructions. Highest CNRs are found in monoenergetic 40 keV optimized reconstructions while 40 keV monoenergetic conventional reconstructions had significantly lower CNR (green). VMc = virtual monoenergetic conventional reconstruction; VMo = virtual monoenergetic “optimized” reconstruction.
Figure 6 shows an example of an infarct in the lateral LV wall imaged with the conventional VMc and the optimized VMo algorithm at 40 keV illustrating the differences in noise and detail.
Figure 6.

The images show delayed contrast imaging of a 75-year-old male with a history of multiple coronary stentings and CABG who was evaluated for an interventional aortic valve implantation procedure. The left panel shows the conventional 40 keV monoenergetic reconstruction (VMc), while the right panel shows the 40 keV reconstructions with the optimized algorithm (VMo). The window/level was set to the same values. The VMo reconstruction has less noise and appears to show more detail. The infarct in the lateral wall is clearly seen.
4. Discussion
The identification of myocardial scar or infarction is challenging on CT due to relatively poor late contrast enhancement (LCE) relative to the normal myocardium. Our hypothesis was that spectral CT could be used to improve and optimize infarct visualization on late contrast enhancement images. We first studied an animal model because we had histopathologic confirmation of the presence and location of the infarcts. We found that noise-optimized virtual monoenergetic reconstructions at 40 keV showed the best image quality by both objective and subjective assessment. Reconstruction with these settings resulted in an improvement in CNR compared to conventional CT of approximately 27%. These animal results were confirmed in a small group of human CT datasets with myocardial scar, also showing the superiority of noise-optimized virtual monoenergetic reconstructions at low keV.
To our knowledge, the performance of advanced virtual monoenergetic post processing1, 8–10 for infarct detection has not been previously evaluated. However, several prior studies have evaluated different aspects of spectral CT, indicating a role for dual energy imaging. Deseive at al.11 used a dual source scanner at 100kVp/140kVp to obtain a colored iodine map overlaid on a greyscale anatomic image. The combined image showed slightly higher sensitivity for infarct detection compared to single energy images. Kartje et al. used 80kVp/140kVp and nonlinear blending of both low and high keV images to obtain higher signal differences between non-infarcted and infarcted myocardium12. Wichmann et. al also used nonlinear blending but employed 100kVp/140kVp tube voltages in a patient study13. The present study provides a more comprehensive assessment of spectral reconstruction methods, including conventional and noise optimized monoenergetic images. In addition, we used multiple quantitative methods to detect differences in image quality. Quantitative measurements were generally confirmed by blinded visual/subjective assessment. These various methods indicated that noise optimized virtual monoenergetic low keV images were superior to other methods for visualization of infarct on LCE CT images.
Data on novel post-processing techniques like virtual monoenergetic reconstructions is scarce. In addition there are several technological improvements in CT dual energy technology that merit further evaluation: The dual source CT scanner in this study supports a high tube voltage, therefore the setting we used (90kVp/150kVp, together with an increased thickness of the tin filter for the high kV spectrum) has a higher energy separation and is still applicable for most patient sizes14. In addition, the post-processing algorithms were significantly improved compared to prior studies in regard to noise management (virtual monoenergetic optimized, VMo)1. Despite these advances, the highest contrast to noise ratio achieved by CT in our study was 4.2. This CNR is still relatively low compared to that obtained with late gadolinium enhancement MRI (CNR for infarct imaging generally greater than 10). Since clear delineation of infarct lesions at CT is challenging, each possible increment in image quality is very important in order to obtain diagnostic image quality for LCE CT of myocardial infarction.
Iodine map images reflect the iodine attenuation in HU at each voxel. In theory, this technique is a promising alternative to monoenergetic reconstructions for infarct detection. However, CNR and HU separation was comparable to mixed 90/150 kVp images and inferior to the noise-optimized monoenergetic images.
A limitation of this study is that histologic proof was available only for animal studies, while the presence of infarct for human studies was based on clinical assessment. We focused our primary validation on the animal model since human infarct detection remains challenging. Optimized animal results were then applied to human infarcts that were relatively large and clinically verified. In addition, the standard deviations of our quantitative metrics were relatively large. This can be explained by the heterogeneity of infarcts, where some infarcts were very small and not well defined, while others were transmural and clearly demarcated.
4. Conclusion
In conclusion, visualization of late contrast enhancement CT imaging of chronic myocardial infarction was optimized in an animal models using low (40) keV noise optimized monoenergetic reconstructions; human infarcts showed similar CNR and SNR behavior as the animal study. CNR and SNR of LCE by CT remains marginal for clinical use so that further CT developments are likely needed in order to approach image quality routinely obtained using late gadolinium enhancement MRI.
Acknowledgments
This research was supported by the NIH intramural research program.
Funding:
Funding was provided by the NIH intramural research program.
Footnotes
Publisher's Disclaimer: This is a PDF file of an unedited manuscript that has been accepted for publication. As a service to our customers we are providing this early version of the manuscript. The manuscript will undergo copyediting, typesetting, and review of the resulting proof before it is published in its final citable form. Please note that during the production process errors may be discovered which could affect the content, and all legal disclaimers that apply to the journal pertain.
No conflicts of interest
References
- 1.Grant KL, Flohr TG, Krauss B, Sedlmair M, Thomas C, Schmidt B. Assessment of an advanced image-based technique to calculate virtual monoenergetic computed tomographic images from a dual-energy examination to improve contrast-to-noise ratio in examinations using iodinated contrast media. Invest Radiol. 2014;49:586–592. doi: 10.1097/RLI.0000000000000060. [DOI] [PubMed] [Google Scholar]
- 2.Nie SP, Wang X, Qiao SB, et al. Improved myocardial perfusion and cardiac function by controlled-release basic fibroblast growth factor using fibrin glue in a canine infarct model. Journal of Zhejiang University Science B. 2010;11:895–904. doi: 10.1631/jzus.B1000302. [DOI] [PMC free article] [PubMed] [Google Scholar]
- 3.Zhou D, Xiong L, Wu Q, et al. Effects of transmyocardial jet revascularization with chitosan hydrogel on channel patency and angiogenesis in canine infarcted hearts. Journal of biomedical materials research Part A. 2013;101:567–574. doi: 10.1002/jbm.a.34346. [DOI] [PubMed] [Google Scholar]
- 4.Nieman K, Shapiro MD, Ferencik M, et al. Reperfused myocardial infarction: contrast-enhanced 64-Section CT in comparison to MR imaging. Radiology. 2008;247:49–56. doi: 10.1148/radiol.2471070332. [DOI] [PubMed] [Google Scholar]
- 5.Goudail F, Refregier P, Delyon G. Bhattacharyya distance as a contrast parameter for statistical processing of noisy optical images. Journal of the Optical Society of America A, Optics, image science, and vision. 2004;21:1231–1240. doi: 10.1364/josaa.21.001231. [DOI] [PubMed] [Google Scholar]
- 6.Barnes JE. Characteristics and control of contrast in CT. Radiographics. 1992;12:825–837. doi: 10.1148/radiographics.12.4.1636042. [DOI] [PubMed] [Google Scholar]
- 7.Christianson O, Chen JJS, Yang Z, et al. An Improved Index of Image Quality for Task-based Performance of CT Iterative Reconstruction across Three Commercial Implementations. Radiology. 2015;275:725–734. doi: 10.1148/radiol.15132091. [DOI] [PubMed] [Google Scholar]
- 8.Wichmann JL, Gillott MR, De Cecco CN, et al. Dual-Energy Computed Tomography Angiography of the Lower Extremity Runoff: Impact of Noise-Optimized Virtual Monochromatic Imaging on Image Quality and Diagnostic Accuracy. Invest Radiol. 2016;51:139–146. doi: 10.1097/RLI.0000000000000216. [DOI] [PubMed] [Google Scholar]
- 9.Husarik DB, Gordic S, Desbiolles L, et al. Advanced virtual monoenergetic computed tomography of hyperattenuating and hypoattenuating liver lesions: ex-vivo and patient experience in various body sizes. Invest Radiol. 2015;50:695–702. doi: 10.1097/RLI.0000000000000171. [DOI] [PubMed] [Google Scholar]
- 10.Martin SS, Albrecht MH, Wichmann JL, et al. Value of a noise-optimized virtual monoenergetic reconstruction technique in dual-energy CT for planning of transcatheter aortic valve replacement. Eur Radiol. 2016 doi: 10.1007/s00330-016-4422-3. [DOI] [PubMed] [Google Scholar]
- 11.Deseive S, Bauer RW, Lehmann R, et al. Dual-energy computed tomography for the detection of late enhancement in reperfused chronic infarction: a comparison to magnetic resonance imaging and histopathology in a porcine model. Invest Radiol. 2011;46:450–456. doi: 10.1097/RLI.0b013e3182145b4f. [DOI] [PubMed] [Google Scholar]
- 12.Kartje JK, Schmidt B, Bruners P, Mahnken AH. Dual energy CT with nonlinear image blending improves visualization of delayed myocardial contrast enhancement in acute myocardial infarction. Invest Radiol. 2013;48:41–45. doi: 10.1097/RLI.0b013e3182749b38. [DOI] [PubMed] [Google Scholar]
- 13.Wichmann JL, Hu X, Kerl JM, et al. Non-linear blending of dual-energy CT data improves depiction of late iodine enhancement in chronic myocardial infarction. The international journal of cardiovascular imaging. 2014;30:1145–1150. doi: 10.1007/s10554-014-0440-x. [DOI] [PubMed] [Google Scholar]
- 14.Krauss B, Grant KL, Schmidt BT, Flohr TG. The importance of spectral separation: an assessment of dual-energy spectral separation for quantitative ability and dose efficiency. Invest Radiol. 2015;50:114–118. doi: 10.1097/RLI.0000000000000109. [DOI] [PubMed] [Google Scholar]