

Abstract
A diet high in phytochemical-rich plant foods is associated with reducing the risk of chronic diseases such as cardiovascular and neurodegenerative diseases, obesity, diabetes and cancer. Oxidative stress and inflammation (OSI) is the common component underlying these chronic diseases. Whilst the positive health effects of phytochemicals and their metabolites have been demonstrated to regulate OSI, the timing and absorption for best effect is not well understood. We developed a model to predict the time to achieve maximal plasma concentration (Tmax) of phytochemicals in fruits and vegetables. We used a training dataset containing 67 dietary phytochemicals from 31 clinical studies to develop the model and validated the model using three independent datasets comprising a total of 108 dietary phytochemicals and 98 pharmaceutical compounds. The developed model based on dietary intake forms and the physicochemical properties lipophilicity and molecular mass accurately predicts Tmax of dietary phytochemicals and pharmaceutical compounds over a broad range of chemical classes. This is the first direct model to predict Tmax of dietary phytochemicals in the human body. The model informs the clinical dosing frequency for optimising uptake and sustained presence of dietary phytochemicals in circulation, to maximise their bio-efficacy for positively affect human health and managing OSI in chronic diseases.
Introduction
Chronic diseases are the leading causes of mortality in the world, responsible for 68% of all deaths1. Current evidence strongly supports that diets rich in plant foods are associated with reduced risk of chronic diseases such as cardiovascular2 and neurodegenerative diseases3, obesity4, diabetes5 and cancer6. Oxidative stress and inflammation (OSI) are consistently high in people suffering from chronic diseases7. These transient elevated states of OSI can also be associated with daily cycles of activity including meal digestion8 and exercise9 in healthy individuals. Ingestion of a phytochemical-rich fruit juice or grape extracts can prevent post-prandial OSI induced by a high-fat meal challenge in healthy volunteers10–12. Similarly, positive health effects of phytochemicals have been demonstrated to attenuate the OSI associated with exercise in athletes13, 14.
Uptake of dietary phytochemicals in the human body and their bioavailability to target cells facilitate their bio-efficacy to protect our health15. However, phytochemicals have relatively low bioavailability as they are handled by the body as xenobiotics therefore the presence in the body is transient16. Following the ingestion of phytochemicals, some but not all components are absorbed into the circulatory system via the small intestine15. These phytochemicals may be subjected to metabolism in the liver and their hepatic metabolites are released back into the circulatory system15. The phytochemicals that are not absorbed in the small intestine reach the colon whereby substantial structural modification by the colonic microbiota occurs and their microbial metabolites are released back into the circulatory system16. The main factors affecting the bioavailability of phytochemicals include chemical structures and dietary intake forms15. The chemical heterogeneity of key bioactive phytochemicals within dietary plants results in a broad range of associated time required to reach maximal plasma concentration (Tmax) in the body17. For example, green tea flavan-3-ols peak in human plasma within 1–2 hour (h) post ingestion and cleared over the next few hours18 whilst maximal levels of tomato lycopene was observed between 15 and 33 h post-ingestion and completely cleared over the next few days19. Additionally, dietary intake forms of phytochemicals may also have an impact on their Tmax in the body20. Ellagic acid from a pomegranate extract was reported to have a Tmax of 0.5–1 h when ingested as liquid form, but 2–3 h when ingested in a solid form21. It is possible that previous studies have underestimated the OSI-reducing effects of dietary phytochemicals if blood sampling was performed outside the timespan of Tmax in the body. For example, no effects of vitamin C supplementation (1 g/d) on plasma biomarkers of OSI were reported after either 1 day or 2 week treatment durations22. However, bolus dose of vitamin C given 2 h before exercise prevented exercise-induced OSI23. The inconsistency in findings of bio-efficacy of vitamin C could be due to the time of blood sampling that mismatched the short Tmax of vitamin C (~3 h24). The timing of dietary phytochemical consumption relative to OSI challenges (e.g., meal or exercise) could be an important factor in understanding and optimising the health benefits of phytochemicals.
Oral bioavailability of phytochemicals can be informed by the application of in silico modelling widely used in pharmaceutical sciences25 and drug discovery26. These models correlate in vitro and/or in vivo passive absorption of drugs with their chemical structures described by physicochemical properties to predict the absorption of similar compounds27. Physicochemical properties of importance in drug absorption include molecular mass (Mr), lipophilicity (expressed as the logarithm of the partition coefficient between water and 1-octanol, log P), number of hydrogen (H) donors and acceptors28, polar surface area (PSA), number of freely-rotatable bonds29 and molecular volume30. Multiple models have been developed to predict absorption kinetics and bioavailability of pharmaceutical compounds27. However, there is currently no such model for predicting Tmax of dietary phytochemicals from physicochemical properties.
The aim of this study was to determine if Tmax of dietary phytochemicals in healthy individuals could be predicted from standard physicochemical properties and dietary intake forms. To develop the predictive model, we used a training dataset that modelled the Tmax of 67 dietary phytochemicals collected from 31 clinical studies of healthy volunteers18, 19, 21, 24, 31–57 to their calculated physicochemical properties. To validate the predictive model for dietary phytochemicals, we used an independent phytochemical validation dataset (PCv) containing 108 dietary phytochemicals collected from a further 34 clinical studies58–91. We validated the predictive model using pharmaceutical compounds and evaluated the effects of food on the prediction accuracy of the model by using two datasets containing 60 pharmaceutical compounds ingested without food (PHv-fasted)92–148 and 38 pharmaceutical compounds ingested with food (PHv-fed)92–95, 97, 98, 102–104, 106–111, 113, 116, 117, 121, 122, 126, 128, 130–133, 136, 138, 140, 143–146, 148–151. This study demonstrates that physicochemical properties and dietary intake forms can be used to predict Tmax of dietary phytochemicals and pharmaceutical compounds when ingested without food.
Results
Correlation analysis of the training dataset
The model training dataset contained 11 variables including Tmax, 8 physicochemical properties and 3 categories of dietary intake forms (Supplementary Table S1). The included physicochemical properties were Mr, log P, PSA, number of freely rotatable bonds, number of H donors, number of H acceptors and molecular volume. As there is a high correlation between variables, multi-collinearity affects the estimation of the coefficients and inflates the standard errors (SE). Therefore, to investigate the relationships between the physicochemical properties in the training dataset, Pearson correlation analyses were performed. Table 1 provides these Pearson’s correlation coefficients (r) with their associated P-values. Significantly high correlations (|r| > 0.75, P < 0.05) were observed between Mr and number of freely rotatable bonds (r = 0.772, P < 0.001), Mr and molecular volume (r = 0.949, P < 0.001), log P and number of H acceptors (r = −0.755, P < 0.001), number of freely rotatable bonds and molecular volume (r = 0.901, P < 0.001), number of H acceptors and H donors (r = 0.949, P < 0.001), number of H acceptors and PSA (r = 0.998, P < 0.001), number of H donors and PSA (r = 0.955, P < 0.001). For correlated variables, only one of the baseline variables was chosen to be included in the predictive model and were Mr, PSA and log P.
Table 1.
Pearson correlations between physicochemical properties of phytochemicals in the training dataset (N = 67).
| Physico-chemical properties | Mr | Log P | Freely rotatable bonds | H acceptors | H donors | PSA |
|---|---|---|---|---|---|---|
| Log P | r = 0.174 | |||||
| P = 0.159 | ||||||
| Freely rotatable bonds | r = 0.772 | r = 0.554 | ||||
| P < 0.001 | P < 0.001 | |||||
| H acceptors | r = 0.442 | −0.755 | r = −0.094 | |||
| P < 0.001 | P < 0.001 | P = 0.449 | ||||
| H donors | r = 0.424 | r = −0.712 | r = −0.127 | r = 0.949 | ||
| P < 0.001 | P < 0.001 | P = 0.306 | P < 0.001 | |||
| PSA | 0.435 | r = −0.748 | r = −0.110 | r = 0.998 | r = 0.955 | |
| P < 0.001 | P < 0.001 | P = 0.377 | P < 0.001 | P < 0.001 | ||
| Molecular volume | r = 0.949 | r = 0.445 | r = 0.901 | r = 0.413 | r = 0.141 | r = 0.135 |
| P < 0.001 | P < 0.001 | P < 0.001 | P = 247 | P = 0.254 | P = 0.277 |
Data reported as Pearson’s correlation coefficient (r) with P-values. Significantly high correlations (|r| > 0.75, P < 0.05) are highlighted with bold.
To test the effects of dietary intake forms, Pearson correlation analyses between Tmax, Mr, PSA and log P were performed with the inclusion of dietary intake forms (liquid, semi-solid and solid). Table 2 shows significantly high correlations between PSA and log P in the liquid intake form (r = −0.82, P < 0.001) and in the semi-solid intake form (r = −0.93, P < 0.001). Therefore, the predictive model of Tmax was developed including 2 separate models: the ‘log P model’ containing log P and Mr and the ‘PSA model’ containing PSA and Mr.
Table 2.
Pearson correlations between selected physicochemical properties and Tmax in the training dataset (N = 67).
| Dietary intake form | Variable | Tmax | Mr | Log P |
|---|---|---|---|---|
| Liquid | Mr | r = 0.48 | ||
| P = 0.01 | ||||
| Log P | r = 0.80 | r = 0.45 | ||
| P < 0.001 | P = 0.015 | |||
| PSA | r = −0.72 | r = −0.03 | r = −0.82 | |
| P < 0.001 | P = 0.88 | P < 0.001 | ||
| Semi-solid | Mr | r = 0.28 | ||
| P = 0.388 | ||||
| Log P | r = 0.75 | r = −0.07 | ||
| P = 0.005 | P = 0.832 | |||
| PSA | r = −0.64 | r = 0.30 | r = −0.93 | |
| P = 0.026 | P = 0.342 | P < 0.001 | ||
| Solid | Mr | r = 0.52 | ||
| P < 0.001 | ||||
| Log P | r = 0.65 | r = 0.19 | ||
| P < 0.001 | P = 0.332 | |||
| PSA | r = −0.13 | r = 0.66 | r = −0.56 | |
| P = 0.517 | P < 0.001 | P = 0.002 |
Data reported as Pearson’s correlation coefficient (r) with P-values. Significantly high correlations (|r| > 0.75, P < 0.05) are highlighted with bold.
Development of the predictive model
To develop the predictive model of Tmax for phytochemicals, we used regression modelling with a natural logarithm transformation of Tmax (ln (Tmax)) and standard error (SE) of Tmax as weights to account for the uncertainty of each data point. We used the training dataset containing 67 phytochemicals collected from 31 clinical studies with a total number of 384 healthy participants (Table 3). The predictive model included 2 mathematical models: the log P model and the PSA model that appeared to approximately equally well fit the data with coefficients depending on dietary intake forms (Fig. 1). All models had statistical power of >0.999.
Table 3.
Summary of datasets for development and validation of the predictive model.
| Dataset | Intake | No. of studies | No. of people | No. of PCs | Tmax rangea (h) | Mr rangeb | Log P rangeb | PSA rangeb (Å2) |
|---|---|---|---|---|---|---|---|---|
| Training | Liquid | 12 | 112 | 28 | 0.3–32.6 | 122–612 | −4.4–10 | 0–271 |
| Semi-solid | 5 | 29 | 12 | 0.6–14.8 | 302–728 | −4.7–9.8 | 0–309 | |
| Solid | 16 | 257 | 27 | 0.7–15.2 | 122–1270 | −3.4–9.4 | 29–465 | |
| Total | 31 | 384 | 67 | 0.3–32.6 | 122–1270 | −4.7–9.8 | 0–465 | |
| PCv | Liquid | 19 | 667 | 70 | 0.5–19 | 138–659 | −4.3–10 | 0–271 |
| Semi-solid | 5 | 129 | 12 | 1.0–4.0 | 176–758 | −4.7–−1.4 | 107–330 | |
| Solid | 14 | 354 | 26 | 0.8–37 | 176–569 | −2.8–9.8 | 0–197 | |
| Total | 34 | 1150 | 108 | 0.5–37 | 138–758 | −4.7–10 | 0–330 | |
| PHv-fasted | Solid | 59 | 963 | 60 | 0.8–3.6 | 123–552 | −1.7–5.2 | 3–146 |
| PHv-fed | Solid | 37 | 617 | 38 | 1.4–6.5 | 123–823 | −1.7–5.4 | 3–221 |
aTmax of phytochemicals were collected from clinical studies in the literature.
bPhysicochemical properties of phytochemicals including Mr, Log P and PSA were calculated using the Molinspiration Chemoinformatics calculator.
Figure 1.
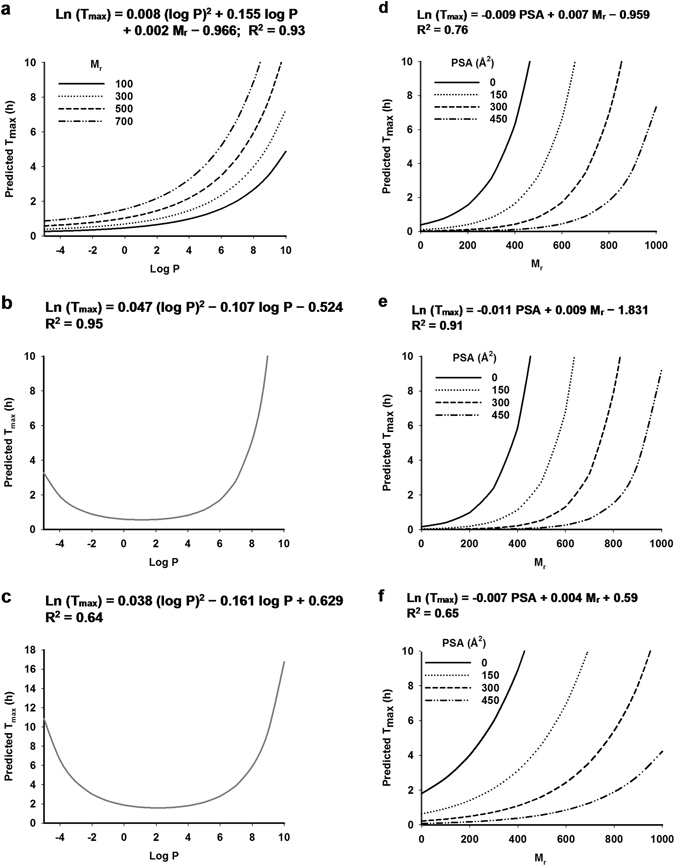
Prediction of Tmax by the predictive model. (a) The log P model in liquid, (b) semi-solid and (c) solid intakes. (d) The PSA model in liquid, (e) semi-solid and (f) solid intakes.
The log P model estimated Tmax based on log P and Mr (Fig. 1a–c). When phytochemicals were administered in liquid form, ln (Tmax) was positively associated with log P and Mr (Fig. 1a). When phytochemicals were administered in semi-solid (Fig. 1b) or solid (Fig. 1c) forms, ln (Tmax) was independent of Mr and followed a quadratic relationship with log P. The PSA model estimated Tmax based on PSA and Mr (Fig. 1d–f). In the PSA model, ln (Tmax) was positively associated with Mr and negatively associated with PSA. Overall, the predictive model covered a Mr range of 122–1270, a log P range of −4.7–9.8 and a PSA range of 0–465 Å2 corresponding a Tmax range of 0.3–32.6 h (Table 3). Distribution patterns of log P, Mr and PSA in the training dataset were demonstrated in Fig. 2. Log P was relatively evenly distributed across the range from −4.7–3 and 8.7–10 (Fig. 2a). Therefore, the log P model had to interpolate values between 3 and 8.5 because they were not represented in the training dataset. Mr and PSA of the training dataset were evenly distributed (Fig. 2b and c).
Figure 2.
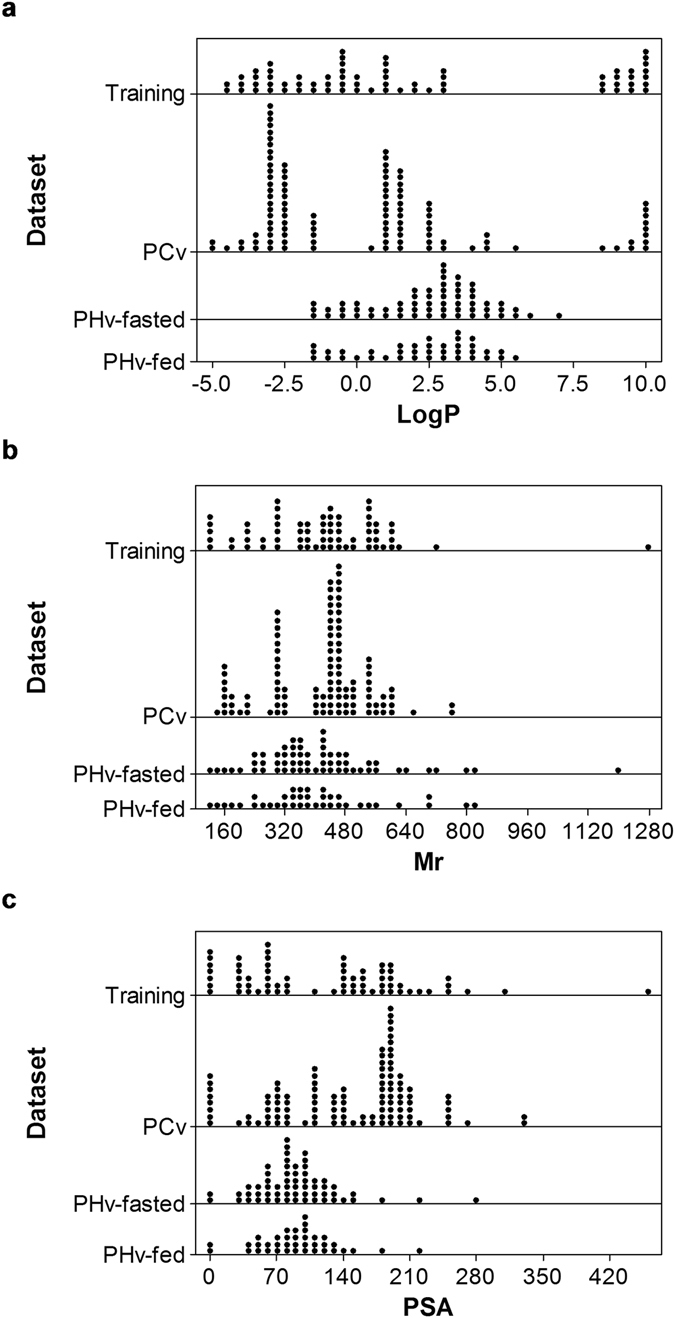
Summary of variables included in datasets for the development and validation of the predictive model. Dot plots demonstrate distributions of (a) log P, (b) Mr and (c) PSA of four datasets: training (N = 67), PCv (N = 108), PHv-fasted (N = 60) and PHv-fed (N = 38) datasets.
The prediction accuracy of the log P model and the PSA model in the training dataset was assessed by the root mean weighted square error normalized by the weights (RNMSWE) and the percentage relative error (%RE) of predictions (Table 4). Comparison of the measured versus predicted values of ln (Tmax) was plotted in Fig. 3a–c. The RNMSWE of prediction is an estimate of the standard deviation of the prediction normalized by the weights. As Tmax required a natural logarithm transformation, the RNMSWE in ln (hours) was transformed to %RE of prediction which is approximately average % error of Tmax (in hours) over the mean of Tmax (in hours). The %RE of prediction of the log P model was 18.27%, 19.13% and 47.08% for the liquid, semi-solid and solid intakes, respectively. The %RE of prediction of the PSA model was 37.46%, 25.43% and 45.8% for the liquid, semi-solid and solid intakes, respectively (Table 4). Overall, for the training dataset, despite the similar R2, the log P model had lower %RE of prediction across all three intakes and thus higher prediction accuracy.
Table 4.
Comparison of prediction accuracy of the predictive model for each dataset.
| Parameter | Log P model | PSA model | ||||||
|---|---|---|---|---|---|---|---|---|
| Training dataset | PCv dataset | PHv-fasted | PHv-fed | Training dataset | PCv dataset | PHv-fasted | PHv-fed | |
| Liquid intake | ||||||||
| NMSWE | 0.0282 | 0.1968 | NA | NA | 0.1012 | 0.2573 | NA | NA |
| RNMSWE | 0.1678 | 0.4436 | NA | NA | 0.3181 | 0.5072 | NA | NA |
| %RE | 18.27 | 55.84 | NA | NA | 37.46 | 66.07 | NA | NA |
| N | 28 | 70 | NA | NA | 28 | 70 | NA | NA |
| Semi-solid intake | ||||||||
| NMSWE | 0.0306 | 0.2039 | NA | NA | 0.0513 | 0.4320 | NA | NA |
| RNMSWE | 0.1750 | 0.4516 | NA | NA | 0.2266 | 0.6573 | NA | NA |
| %RE | 19.13 | 57.07 | NA | NA | 25.43 | 92.95 | NA | NA |
| N | 12 | 12 | NA | NA | 12 | 12 | NA | NA |
| Solid intake | ||||||||
| NMSWE | 0.1488 | 0.3241 | 0.1390 | 0.4349 | 0.1422 | 0.4079 | 0.9327 | 0.4256 |
| RNMSWE | 0.3858 | 0.5693 | 0.3728 | 0.6594 | 0.3771 | 0.6387 | 0.9658 | 0.6524 |
| %RE | 47.08 | 76.70 | 45.18 | 93.37 | 45.80 | 89.40 | 162.69 | 92.01 |
| N | 27 | 26 | 60 | 38 | 27 | 26 | 60 | 38 |
Figure 3.
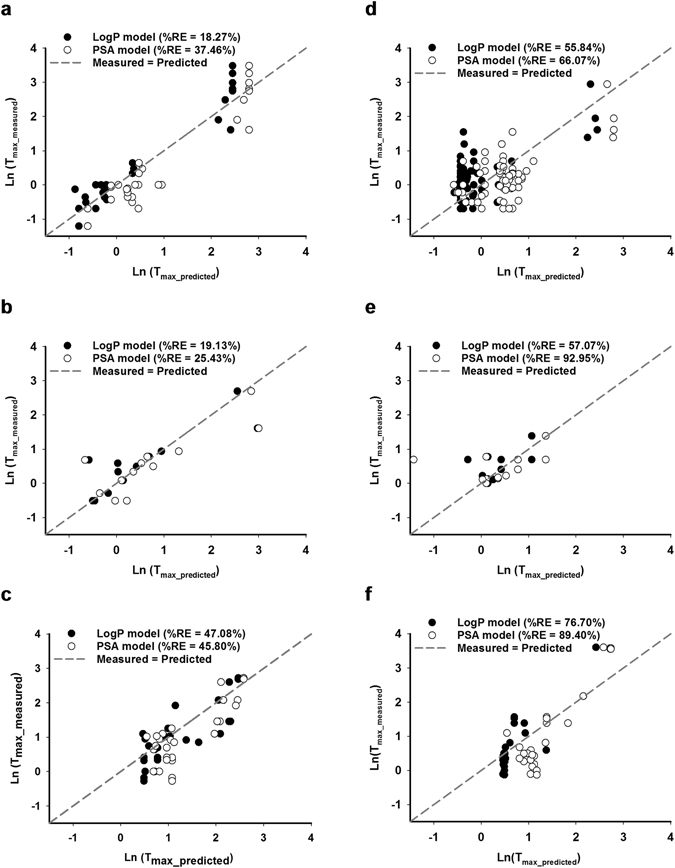
Comparison of measured versus predicted values of Tmax of the training dataset and the PCv dataset. Natural logarithm of Tmax measured from the training dataset (N = 67) were plotted against natural logarithm of predicted Tmax based on the log P model (black circle), the PSA model (clear circle) and compared to the regression of measured Tmax = predicted Tmax (dotted line) when intake as (a) liquid, (b) semi-solid and (c) solid forms. Similar comparison was plotted for the PCv dataset (N = 108) when intake as (d) liquid, (e) semi-solid and (f) solid forms.
Validation of the predictive model
To validate the predictive model, we used three independent datasets: the PCv, PHv-fasted and PHv-fed datasets. In comparison with the training dataset, all three validation datasets covered smaller ranges of log P, Mr and PSA (Table 3, Fig. 2). The PCv dataset contained phytochemicals of similar chemical classes to the training dataset whilst the PHv-fasted and the PHv-fed datasets contains pharmaceutical compounds. The PCv dataset contained 108 phytochemicals including anthocyanins, flavanols, flavonols, hydrobenzoic acids, hydroxycinnamic acids, stilbenes, carotenoids and vitamins (Supplementary Table S2). Comparing to the training dataset, the PCv dataset covered a similar range of log P of −4.7–10 and measured Tmax of 0.5–37 h (Table 3) with sparsely distributed data of log P (Fig. 2a). Log P values of the PCv dataset were more concentrated in the range of −2.8–−2.5 and 1.2–2.3. Similar to the training dataset, the PCv dataset lacked log P values from 5.6–8.4 (Fig. 2a). The PCv dataset covered a Mr range of 138–758 and a PSA range of 0–330 Å2 (Table 3, Fig. 2b and c). In comparison the training dataset, Mr and PSA of the PCv dataset were less evenly distributed (Fig. 2b and c).
To evaluate the prediction accuracy of the predictive model on the PCv dataset, we compared the measured versus predicted values of ln (Tmax) in Fig. 3d–f and calculated the %RE in Table 4. The %RE of prediction of the log P model was 55.84%, 57.07% and 76.7% for the liquid, semi-solid and solid intakes, respectively. The %RE of prediction of the PSA model was 66.07%, 92.95% and 89.4% for the liquid, semi-solid and solid intakes, respectively (Table 4). Overall, for the PCv dataset and in comparison with the PSA model, the log P model had lower %RE of prediction across three intakes and thus higher prediction accuracy. Comparing to the training dataset, the PCv dataset had higher %RE of prediction and thus lower prediction accuracy across all intake forms.
To validate the predictive model on pharmaceutical compounds, we used two pharmaceuticals validation datasets: PHv-fasted and PHv-fed. All pharmaceutical compounds in the two datasets were administered in the solid form (Table 3). The PHv-fasted dataset contains 60 compounds collected from 59 clinical studies and the PHv-fed dataset contains 38 compounds collected from 37 clinical studies (Table 3). The entire list of pharmaceutical compounds in the PHv-fasted dataset can be found as Supplementary Table S3 and the PHv-fed dataset as Supplementary Table S4. The two PHv datasets covered a similar range of log P −1.7–5.4 (Table 3) with a similar distribution pattern (Fig. 2a). Comparing to the PHv-fasted dataset, the PHv-fed dataset covered a slightly broader range of Mr of 123–823 and PSA of 3–221 Å2 while the PHv-fasted dataset covered Mr range of 123–552 and PSA of 3–146 Å2 (Table 3). Similar distribution patterns of Mr and PSA were observed in the two PHv datasets (Fig. 2b and c).
To evaluate the effects of food on the prediction accuracy of the model, we compared the measured versus predicted values of ln (Tmax) in Fig. 4 and calculated the %RE in Table 4. The %RE of prediction for the log P model was 45.18% for the PHv-fasted dataset and 93.37% for the PHv-fed dataset. The %RE of prediction for the PSA model was 162.69% for the PHv-fasted dataset and 92.01% for the PHv-fed dataset (Table 4). For the log P model, food increased the %RE of prediction and therefore reduced the prediction accuracy. By contrast, for the PSA model, food reduced the %RE of prediction and thus increased the prediction accuracy. Overall, the log P model and PSA model had similar %RE for the PHv-fed dataset. However, the log P model had substantially lower %RE for the PHv-fasted dataset and thus had higher prediction accuracy.
Figure 4.
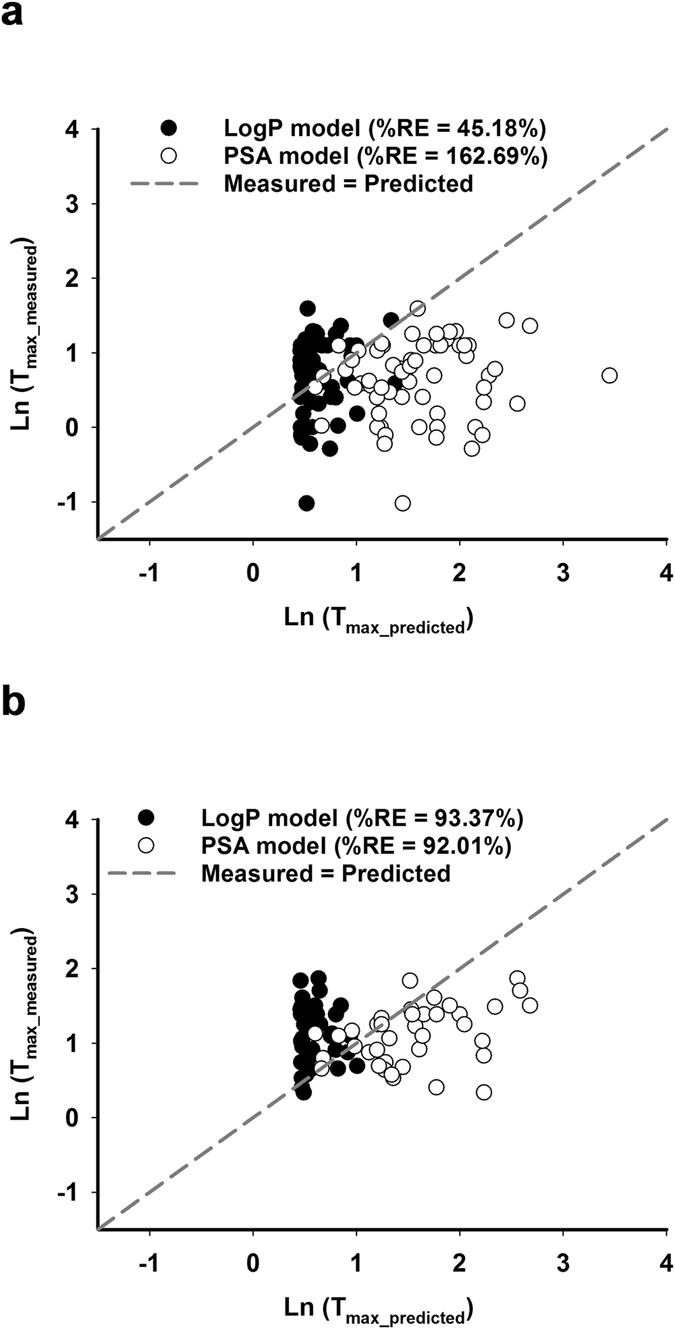
Comparison of measured versus predicted values of Tmax of the PHv datasets. Natural logarithm of Tmax measured from (a) the PHv-fasted (N = 60) dataset and (b) the PHv-fed (N = 38) dataset were plotted against natural logarithm of predicted Tmax based on the log P model (black circle), the PSA model (clear circle) and compared to the regression of measured Tmax = predicted Tmax (dotted line) when intake as solid forms.
Discussion
This is the first direct model to predict the time of maximal plasma concentration (Tmax) of dietary phytochemicals in the human body based on their physicochemical properties and dietary intake forms. The model was developed based on Tmax data from clinical studies of healthy individuals and therefore predicts the absorption of phytochemicals in the human body. To select the most important variables for the predictive model, we analysed the correlation between several physicochemical properties that are well known in pharmaceutical science to have significant impacts on oral bioavailability of drugs such as molecular mass, lipophilicity, polar surface area, molecular volume, number of freely rotatable bonds, number of hydrogen donors and acceptors28–30. We found significantly high correlation between some of the physicochemical properties and selected three independent physicochemical properties to use in the model including molecular mass, lipophilicity and polar surface area. These phytochemical properties were selected due to their well-known impacts on drug bioavailability as they are related to intestinal membrane permeability of a compound28, 29. In order for a drug to cross the membrane, the compound needs to break hydrogen bonds with its aqueous environment and partition through the membrane152. Polar surface area is related to the hydrogen-bonding potential of a compound whilst molecular mass and lipophilicity are related to the membrane permeability. Consistent with the literature28, 29, 152, we found that these physicochemical properties had significant impacts on the Tmax of dietary phytochemicals in the human body. Further, dietary intake forms were also identified to have a significant impact on absorption of dietary phytochemicals and were included in the model development. Similar to drug compounds, the effects of dietary intake forms on bioavailability of phytochemicals are related to the dissolution of phytochemicals within the gastrointestinal tract making them available for absorption153. Therefore, comparing to the liquid form, dietary phytochemicals consumed in the semi-solid or solid forms would require longer time to dissolve into the gastrointestinal environment before they are available for absorption.
The predictive model based on lipophilicity and molecular mass provides a quantitative and high-throughput tool for prediction of Tmax of dietary phytochemicals and also pharmaceutical compounds ingested without food. Tmax of a phytochemical or pharmaceutical compound that has not been studied in vivo can thereby be calculated from its molecular mass and log P for three different intake forms of liquid, semi-solid or solids using the equations reported in this predictive model (Fig. 1a–c). For example, phytochemical phloretin (Mr = 274.27, log P = 2.66) found in apple would be predicted to have Tmax of 1.05, 0.62 and 1.6 h when consumed in liquid, semi-solid and solid forms, respectively. The model covers a broad range of chemical classes from phenolic compounds to carotenoids, from very hydrophilic (log P ~ −4.7) to very lipophilic (log P ~ 10) with a wide molecular mass range of Mr ~ 122–1270. The prediction accuracy of the model was indicated by relative error of prediction from 18–77% for total 175 dietary phytochemicals tested and 45% for 60 pharmaceutical compounds ingested without food (Table 4). The relative error of prediction is an indication of the total error of prediction compared to the mean. Our literature searches show that published Tmax have a SE between 0 and 200% of the mean (Supplementary Tables S1–S4). Therefore, the prediction accuracy of our model was deemed adequately accurate for valid prediction of Tmax. Additionally, considering that a statistical power of 0.8 is the standard for adequacy154, our model with power of >0.999 had high statistical power for confidence in preduction accuracy.
The predictive model was of course limited by the literature reports of the experimental data. The Tmax variable was logarithmically transformed to alleviate the non-normality of the errors. However, there were gaps in the independent variables of log P from 3–8.5 and Mr from 750–1270 that the model had to overcome (Fig. 2). Therefore, further data covering a complete range of the parameter space would increase the rigour of the model. Additionally, we observed an increase of relative error of prediction for pharmaceutical compounds when ingested with food (Table 4). Mechanisms whereby food affects the bioavailability of drug absorption have been well studied. Food promotes absorption of lipophilic drugs due to improved drug solubilisation whilst reducing absorption of hydrophilic drugs due to delayed drug permeation155. Similar effects of food on absorption of dietary phytochemicals have been observed20. Increased absorption of the lipophilic compound lycopene in tomato was reported when consumed with olive oil156. Hydrophilic compounds such as phenolic acids and anthocyanins were observed to bind to fibre and compromised their absorption during stimulated gastric and small intestinal digestion157. Further, protein in food has been reported to reduce absorption of dietary phytochemicals in chocolate158. Our predictive model was developed based on dietary phytochemicals administered as single-source phytochemicals or phytochemical extracts and also phytochemicals consumed in their natural matrices of whole fruits and vegetables (Supplementary Table S1). Apart from the models for phytochemicals consumed in liquid (Fig. 1a) or solid (Fig. 1c) forms, mostly in isolation or extracts, a statistically valid model was also developed from consumption of phytochemicals mostly (75%) in whole fruits and vegetables and accounted for the effects of these matrices on phytochemical absorption in semi-solid form (Fig. 1b). Therefore, the effects of interactions of phytochemicals with macronutrients such as fibre and protein from the natural matrices were accounted for to a small extent. Accordingly, Conversely, the impact of macronutrients from food sources other than natural plant food matrices on Tmax of phytochemicals are not accounted for. Considering that macronutrients are known to interact with phytochemicals and thereby alter their Tmax 20, the developed model may less accurately predict the Tmax of phytochemicals when consumed in conjunction with other foods. Accordingly, the predictive model reported herein is most applicable for prediction of Tmax of dietary phytochemicals and pharmaceuticals ingested without foods.
In this study, the time of maximal plasma concentration (Tmax) was chosen as the most relevant molecular data for the predictive model due to its importance in understanding and optimising the health benefits of dietary phytochemicals. Phytochemicals are treated as xenobiotic species and therefore display transient presence in circulation16. Under this circumstance, the Tmax is of prime importance in predicting the presence of any phytochemicals with the expectation that it will be substantially eliminated after a few hours or a few days depending on the phytochemicals18, 19. The protective efficacy of dietary phytochemicals can mitigate oxidative stress and inflammation (OSI) associated with daily activity and found consistently elevated in chronic diseases7–9. Managing OSI associated with daily activity is likely an important strategy for reducing disease risk in both healthy and unhealthy people. The time of maximal plasma concentration of dietary phytochemicals has recently been reported to have an important impact on their ability to regulate OSI159. Consumption of a strawberry drink 2 h before a high fat meal maximises protection against OSI compared with having the drink with or 2 h after the meal159, supporting that the Tmax of dietary phytochemicals must be matched to the OSI challenge for optimal health protection159. The Tmax of strawberry phytochemicals were reported to be about 1–2 h therefore consumption of the strawberry drink 2 h before the meal allowed their presence at maximal plasma concentration to reduce the OSI burden stimulated by the high fat meal160. Here, we chose Tmax instead of maximal plasma concentration (Cmax) in the predictive model as Tmax seems to be less affected by dose. For example, Tmax of lycopene was reported to be about 5 h irrespective of the dose whilst Cmax increased with dose escalation65. Furthermore, the anti-OSI response of phytochemicals does not necessarily continue to increase with dose and higher concentrations of phytochemicals may become pro-oxidants and promote OSI161–163. Without good understanding of the target Cmax for maximising phytochemical efficacy, Cmax is less useful than Tmax.
Although the study is not concerned with post-primary absorption of phytochemicals formed during hepatic and microbial metabolism, it is acknowledged that these metabolites may also contribute to the regulation of OSI similarly to their parent compounds164–166. Therefore, it is important to consider the reported Tmax of these derived metabolites (not predicted by the model) together with Tmax of the parent compounds predicted by this model. The main hepatic metabolites of phytochemicals are glucuronide, sulphate and methylation derivatives with short Tmax values that range from 0.5 h to up to 2.5 h42, indicative of rapid clearance by the hepatic portal system. Colonic microbiota chemical transformations of phytochemicals include hydrolysation, reduction, ring-cleavage, demethylation and dihydroxylation of both parent compounds and their hepatic derivatives167, 168. Accordingly, metabolites with Tmax > 5 h are likely to be absorbed or transformed with the involvement of the colonic microbiota169.
The ability to predict Tmax of dietary phytochemicals offers a valuable tool for designing clinical studies to capture the time of maximal phytochemicals in the human body and to avoid underestimation of their impacts on regulation of OSI. We propose that by matching Tmax to the biological cycle of OSI, suppression of OSI is maximised and the associated tissue damage would be minimised. Therefore, the strategy for optimising the protective efficacy of dietary phytochemicals involves selection of phytochemical sources to achieve desirable Tmax that target different needs for OSI regulation. Using the unique approach of combining phytochemical-rich foods based on computable physicochemical properties, we can understand the absorption characteristics of dietary phytochemicals to achieve their full potential for protective health benefits.
Methods
Clinical data collection
Clinical measures of Tmax were obtained from the literature using the PubMed database. Information collected included compound name and family, sources, dose, intake forms and Tmax in hours (as mean ± SE, hours). When Tmax was given as median and range, conversion to mean and SE was performed as described in Hozo et al.170. The inclusion selection criteria for publications included: 1) randomised controlled clinical trials in healthy volunteers; 2) inclusion of a wash-out period when the study followed a cross over design; 3) PCs analysed were passively absorbed, i.e., compounds found in the plasma or serum were unchanged from those ingested; and 4) plasma analysed without enzymatic deconjugation.
The data collected here were included in the training dataset.
Physicochemical property data collection
Physicochemical properties of phytochemicals were calculated from the molecular structures using the Molinspiration Chemoinformatics calculator (www.molinspiration.com). The physicochemical properties calculated included Mr, log P, PSA, number of freely rotatable bonds, number of H acceptors, number of H donors and molecular volume.
Pearson correlation analysis between variables in the training dataset
Pearson correlation analyses of all variables included in the training dataset were performed using the statistical package R version 3.3.2171. Results were reported as Pearson’s correlation coefficient (r) and P-values.
Development of the predictive model
The predictive model was developed by a linear model framework using the statistical package R. The dependent variable Tmax required a natural logarithm transformation (ln(Tmax)) to capture the non-normality of errors in the variance across all observations of Tmax. The SE of each sample was used as weights during the regression modelling of Tmax. Because Tmax required a log normal distribution, and since:
| 1 |
where E(Y) = expected value of y = mean(y)
the calculated weights for the regression modelling were:
| 2 |
when SE was missing, the weight was set to 4 and when SE was zero the weight was set to 400. Significance testing between Tmax and the physicochemical properties of phytochemicals was carried out using multivariate regression.
Power analysis of the predictive model
Post hoc power analysis of the predictive model was performed using the power calculation program G*Power 3.1.9.2172, 173.
Validation of the predictive model
The prediction accuracy of the predictive model was validated using three independent datasets of measured Tmax obtained from clinical studies using the same selection criteria, including the PCv, PHv-fasted and PHv-fed datasets. Measured Tmax was collected as mean ± SE (hours). The prediction accuracy of the predictive model was evaluated by the normalised mean square weighted error (NMSWE) and % relative error of prediction for each dataset. The NMSWE of prediction was calculated:
| 3 |
where wi is the weights calculated as in Equation 1, Yi is ln(Tmax_measured), Ŷi is ln(Tmax_predicted) and N is the number of data points.
Root NMSWE (RNMSWE) was calculated:
| 4 |
Let Δ=RNMSWE of prediction. If ɛ is the error in predicted values of Tmax and ln(Tmax + ɛ) is predicted from the predictive model, then:
| 5 |
Converting Δ (ln hours) to hours:
| 6 |
The % relative error (RE) of prediction is an approximately averaged error over all data points in the dataset:
| 7 |
Electronic supplementary material
Acknowledgements
This project has been funded by Horticulture Innovation Australia Limited using the Vegetable levy and funds from the Australian Government.
Author Contributions
Initial idea: L.B. and S.S.-P. Data collection: S.S.-P. Statistical analysis: R.M., S.S.-P. Project coordination: L.B., K.H., F.D. Manuscript writing and review: S.S.-P., L.B., R.M., K.H. and F.D.
Competing Interests
The authors declare that they have no competing interests.
Footnotes
Electronic supplementary material
Supplementary information accompanies this paper at doi:10.1038/s41598-017-01888-w
Publisher's note: Springer Nature remains neutral with regard to jurisdictional claims in published maps and institutional affiliations.
References
- 1.Global status report on noncommunicable diseases. (World Health Organisation, Geneva; 2014).
- 2.Dauchet L, Amouyel P, Dallongeville J. Fruits, vegetables and coronary heart disease. Nat. Rev. Cardiol. 2009;6:599–608. doi: 10.1038/nrcardio.2009.131. [DOI] [PubMed] [Google Scholar]
- 3.D’Onofrio, G. et al. Phytochemicals in the treatment of Alzheimer’s disease: a systematic review. Curr. Drug Targets (2016). [DOI] [PubMed]
- 4.Jarzab, A. & Kukula-Koch, W. Recent advances in obesity: the role of turmeric tuber and its metabolites in the prophylaxis and therapeutical strategies. Curr. Med. Chem (2016). [DOI] [PubMed]
- 5.Stravodimos, G. A. et al. Phytogenic polyphenols as glycogen phosphorylase inhibitors: the potential of triterpenes and flavonoids for glycaemic control in type 2 diabetes. Curr. Med. Chem (2016). [DOI] [PubMed]
- 6.Key TJ. Fruit and vegetables and cancer risk. Br. J. Cancer. 2011;104:6–11. doi: 10.1038/sj.bjc.6606032. [DOI] [PMC free article] [PubMed] [Google Scholar]
- 7.Calder PC, et al. Inflammatory disease processes and interactions with nutrition. Br. J. Nutr. 2009;101(Suppl 1):S1–S45. doi: 10.1017/S0007114509377867. [DOI] [PubMed] [Google Scholar]
- 8.Burton-Freeman B. Postprandial metabolic events and fruit-derived phenolics: a review of the science. Br. J. Nutr. 2010;104(Suppl 3):S1–S14. doi: 10.1017/S0007114510003909. [DOI] [PubMed] [Google Scholar]
- 9.van der Merwe M, Bloomer RJ. The influence of methylsulfonylmethane on inflammation-associated cytokine release before and following strenuous exercise. J. Sports Med. (Hindawi Publ. Corp.) 2016;2016:7498359. doi: 10.1155/2016/7498359. [DOI] [PMC free article] [PubMed] [Google Scholar]
- 10.Miglio, C. et al. Fruit juice drinks prevent endogenous antioxidant response to high-fat meal ingestion. Br. J. Nutr. 1–7 (2013). [DOI] [PubMed]
- 11.Peluso, I. et al. Consumption of mixed fruit-juice drink and vitamin C reduces postprandial stress induced by a high fat meal in healthy overweight subjects. Curr. Pharm. Des., 1020–1024 (2013). [DOI] [PubMed]
- 12.Ghanim H, et al. A resveratrol and polyphenol preparation suppresses oxidative and inflammatory stress response to a high-fat, high-carbohydrate meal. J. Clin. Endocrinol. Metab. 2011;96:1409–1414. doi: 10.1210/jc.2010-1812. [DOI] [PMC free article] [PubMed] [Google Scholar]
- 13.Nieman DC, et al. Effects of quercetin and EGCG on mitochondrial biogenesis and immunity. Med. Sci. Sports Exerc. 2009;41:1467–1475. doi: 10.1249/MSS.0b013e318199491f. [DOI] [PubMed] [Google Scholar]
- 14.McAnulty LS, et al. Effect of resveratrol and quercetin supplementation on redox status and inflammation after exercise. Appl. Physiol. Nutr. Metab. 2013;38:760–765. doi: 10.1139/apnm-2012-0455. [DOI] [PubMed] [Google Scholar]
- 15.D’Archivio M, Filesi C, Varì R, Scazzocchio B, Masella R. Bioavailability of the polyphenols: status and controversies. Int. J. Mol. Sci. 2010;11:1321–1342. doi: 10.3390/ijms11041321. [DOI] [PMC free article] [PubMed] [Google Scholar]
- 16.Holst B, Williamson G. Nutrients and phytochemicals: from bioavailability to bioefficacy beyond antioxidants. Curr. Opin. Biotechnol. 2008;19:73–82. doi: 10.1016/j.copbio.2008.03.003. [DOI] [PubMed] [Google Scholar]
- 17.Crozier A, Jaganath IB, Clifford MN. Dietary phenolics: chemistry, bioavailability and effects on health. Nat. Prod. Rep. 2009;26:1001–1043. doi: 10.1039/b802662a. [DOI] [PubMed] [Google Scholar]
- 18.Stalmach A, Troufflard S, Serafini M, Crozier A. Absorption, metabolism and excretion of Choladi green tea flavan-3-ols by humans. Mol. Nutr. Food Res. 2009;53:S44–S53. doi: 10.1002/mnfr.200800169. [DOI] [PubMed] [Google Scholar]
- 19.Gustin DM, et al. Single-dose pharmacokinetic study of lycopene delivered in a well-defined food-based lycopene delivery system (tomato paste-oil mixture) in healthy adult male subjects. Cancer Epidemiol. Biomarkers Prev. 2004;13:850–860. [PubMed] [Google Scholar]
- 20.Parada J, Aguilera JM. Food microstructure affects the bioavailability of several nutrients. J. Food Sci. 2007;72:R21–32. doi: 10.1111/j.1750-3841.2007.00274.x. [DOI] [PubMed] [Google Scholar]
- 21.Seeram NP, et al. Pomegranate juice and extracts provide similar levels of plasma and urinary ellagitannin metabolites in human subjects. J. Med. Food. 2008;11:390–394. doi: 10.1089/jmf.2007.650. [DOI] [PMC free article] [PubMed] [Google Scholar]
- 22.Alessio HM, Goldfarb AH, Cao G. Exercise-induced oxidative stress before and after vitamin C supplementation. Int. J. Sport Nutr. 1997;7:1–9. doi: 10.1123/ijsn.7.1.1. [DOI] [PubMed] [Google Scholar]
- 23.Ashton T, et al. Electron spin resonance spectroscopy, exercise, and oxidative stress: an ascorbic acid intervention study. J. Appl. Physiol. 1999;87:2032–2036. doi: 10.1152/jappl.1999.87.6.2032. [DOI] [PubMed] [Google Scholar]
- 24.Zetler G, Seidel G, Siegers CP, Iven H. Pharmacokinetics of ascorbic acid in man. Eur. J. Clin. Pharmacol. 1976;10:273–282. doi: 10.1007/BF00558340. [DOI] [Google Scholar]
- 25.van de Waterbeemd H, Gifford E. ADMET in silico modelling: towards prediction paradise? Nat. Rev. Drug. Discov. 2003;2:192–204. doi: 10.1038/nrd1032. [DOI] [PubMed] [Google Scholar]
- 26.Camp D, Campitelli M, Carroll AR, Davis RA, Quinn RJ. Front-loading natural-product-screening libraries for log P: background, development, and implementation. Chem. Biodivers. 2013;10:524–537. doi: 10.1002/cbdv.201200302. [DOI] [PubMed] [Google Scholar]
- 27.Van de Waterbeemd H. From in vivo to in vitro/in silico ADME: progress and challenges. Expert Opin. Drug Metab. Toxicol. 2005;1:1–4. doi: 10.1517/17425255.1.1.1. [DOI] [PubMed] [Google Scholar]
- 28.Lipinski CA, Lombardo F, Dominy BW, Feeney PJ. Experimental and computational approaches to estimate solubility and permeability in drug discovery and development settings. Adv. Drug Deliv. Rev. 1997;23:3–26. doi: 10.1016/S0169-409X(96)00423-1. [DOI] [PubMed] [Google Scholar]
- 29.Veber DF, et al. Molecular properties that influence the oral bioavailability of drug candidates. J. Med. Chem. 2002;45:2615–2623. doi: 10.1021/jm020017n. [DOI] [PubMed] [Google Scholar]
- 30.Abraham MH, Chadha HS, Mitchell RC. Hydrogen bonding. 33. Factors that influence the distribution of solutes between blood and brain. J. Pharm. Sci. 1994;83:1257–1268. doi: 10.1002/jps.2600830915. [DOI] [PubMed] [Google Scholar]
- 31.Kay CD, Mazza G, Holub BJ. Anthocyanins exist in the circulation primarily as metabolites in adult men. J. Nutr. 2005;135:2582–2588. doi: 10.1093/jn/135.11.2582. [DOI] [PubMed] [Google Scholar]
- 32.Boocock DJ, et al. Phase I dose escalation pharmacokinetic study in healthy volunteers of resveratrol, a potential cancer chemopreventive agent. Cancer Epidemiol. Biomarkers Prev. 2007;16:1246–1252. doi: 10.1158/1055-9965.EPI-07-0022. [DOI] [PubMed] [Google Scholar]
- 33.Castelli MC, Wong DF, Friedman K, Riley MG. Pharmacokinetics of oral cyanocobalamin formulated with sodium N-[8-(2-hydroxybenzoyl)amino]caprylate (SNAC): an open-label, randomized, single-dose, parallel-group study in healthy male subjects. Clin. Ther. 2011;33:934–945. doi: 10.1016/j.clinthera.2011.05.088. [DOI] [PubMed] [Google Scholar]
- 34.Del Rio D, et al. Bioavailability and catabolism of green tea flavan-3-ols in humans. Nutrition. 2010;26:1110–1116. doi: 10.1016/j.nut.2009.09.021. [DOI] [PubMed] [Google Scholar]
- 35.Ferslew KE, Acuff RV, Daigneault EA, Woolley TW, Stanton PE. Pharmacokinetics and bioavailability of the RRR and all racemic stereoisomers of alpha-tocopherol in humans after single oral administration. J. Clin. Pharmacol. 1993;33:84–88. doi: 10.1002/j.1552-4604.1993.tb03909.x. [DOI] [PubMed] [Google Scholar]
- 36.Garcia-Alonso M, Minihane AM, Rimbach G, Rivas-Gonzalo JC, de Pascual-Teresa S. Red wine anthocyanins are rapidly absorbed in humans and affect monocyte chemoattractant protein 1 levels and antioxidant capacity of plasma. J. Nutr. Biochem. 2009;20:521–529. doi: 10.1016/j.jnutbio.2008.05.011. [DOI] [PubMed] [Google Scholar]
- 37.Hartmann D, et al. Plasma kinetics of zeaxanthin and 3′-dehydro-lutein after multiple oral doses of synthetic zeaxanthin. Am. J. Clin. Nutr. 2004;79:410–417. doi: 10.1093/ajcn/79.3.410. [DOI] [PubMed] [Google Scholar]
- 38.Jia, Y. et al. Pharmacokinetics of single-dose and multi-dose of lovastatin/niacin ER tablet in health volunteers. Chromatogr. Res. Int. 1–11 (2012).
- 39.Mascher H, Kikuta C. High-performance liquid chromatographic determination of total thiamine in human plasma for oral bioavailability studies. J. Pharm. Sci. 1993;82:56–59. doi: 10.1002/jps.2600820113. [DOI] [PubMed] [Google Scholar]
- 40.Mertens-Talcott SU, Jilma-Stohlawetz P, Rios J, Hingorani L, Derendorf H. Absorption, metabolism, and antioxidant effects of pomegranate (Punica granatum l.) polyphenols after ingestion of a standardized extract in healthy human volunteers. J. Agric. Food Chem. 2006;54:8956–8961. doi: 10.1021/jf061674h. [DOI] [PubMed] [Google Scholar]
- 41.Moon YJ, Wang L, DiCenzo R, Morris ME. Quercetin pharmacokinetics in humans. Biopharm. Drug Dispos. 2008;29:205–217. doi: 10.1002/bdd.605. [DOI] [PubMed] [Google Scholar]
- 42.Mullen W, Edwards CA, Crozier A. Absorption, excretion and metabolite profiling of methyl-, glucuronyl-, glucosyl-and sulpho-conjugates of quercetin in human plasma and urine after ingestion of onions. Br. J. Nutr. 2006;96:107–116. doi: 10.1079/BJN20061809. [DOI] [PubMed] [Google Scholar]
- 43.Novotny JA, Kurilich AC, Britz SJ, Baer DJ, Clevidence BA. Vitamin K absorption and kinetics in human subjects after consumption of 13C-labelled phylloquinone from kale. Br. J. Nutr. 2010;104:858–862. doi: 10.1017/S0007114510001182. [DOI] [PubMed] [Google Scholar]
- 44.Odeberg JM, Lignell A, Pettersson A, Hoglund P. Oral bioavailability of the antioxidant astaxanthin in humans is enhanced by incorporation of lipid based formulations. Eur. J. Pharm. Sci. 2003;19:299–304. doi: 10.1016/S0928-0987(03)00135-0. [DOI] [PubMed] [Google Scholar]
- 45.Østerlie M, Bjerkeng B, Liaaen-Jensen S. Plasma appearance and distribution of astaxanthin E/Z and R/S isomers in plasma lipoproteins of men after single dose administration of astaxanthin. J. Nutr. Biochem. 2000;11:482–490. doi: 10.1016/S0955-2863(00)00104-2. [DOI] [PubMed] [Google Scholar]
- 46.Paetau I, Chen H, Goh NM, White WS. Interactions in the postprandial appearance of beta-carotene and canthaxanthin in plasma triacylglycerol-rich lipoproteins in humans. Am. J. Clin. Nutr. 1997;66:1133–1143. doi: 10.1093/ajcn/66.5.1133. [DOI] [PubMed] [Google Scholar]
- 47.Parker, R. S., J., T. B., Swanson, J. E., Goodman, K. J. & Marmor, B. in Methods Enzymol. Vol. Volume 282. (eds Donald, J. W. S. C. W. & McCormick, B.) 130–140 (Academic Press, 1997). [DOI] [PubMed]
- 48.Petley A, Macklin B, Renwick AG, Wilkin TJ. The pharmacokinetics of nicotinamide in humans and rodents. Diabetes. 1995;44:152–155. doi: 10.2337/diab.44.2.152. [DOI] [PubMed] [Google Scholar]
- 49.Rechner AR, et al. The metabolism of dietary polyphenols and the relevance to circulating levels of conjugated metabolites. Free Radic. Res. 2002;36:1229–1241. doi: 10.1080/246-1071576021000016472. [DOI] [PubMed] [Google Scholar]
- 50.Seeram NP, et al. Pomegranate juice ellagitannin metabolites are present in human plasma and some persist in urine for up to 48 hours. J. Nutr. 2006;136:2481–2485. doi: 10.1093/jn/136.10.2481. [DOI] [PubMed] [Google Scholar]
- 51.Stalmach A, et al. Metabolite profiling of hydroxycinnamate derivatives in plasma and urine after the ingestion of coffee by humans: identification of biomarkers of coffee consumption. Drug Metab. Dispos. 2009;37:1749–1758. doi: 10.1124/dmd.109.028019. [DOI] [PubMed] [Google Scholar]
- 52.Stoner GD, et al. Pharmacokinetics of anthocyanins and ellagic acid in healthy volunteers fed freeze-dried black raspberries daily for 7 days. J. Clin. Pharmacol. 2005;45:1153–1164. doi: 10.1177/0091270005279636. [DOI] [PubMed] [Google Scholar]
- 53.Tallaksen CME, Sande A, Bøhmer T, Bell H, Karlsen J. Kinetics of thiamin and thiamin phosphate esters in human blood, plasma and urine after 50 mg intravenously or orally. Eur. J. Clin. Pharmacol. 1993;44:73–78. doi: 10.1007/BF00315284. [DOI] [PubMed] [Google Scholar]
- 54.Vitaglione P, et al. Protocatechuic acid is the major human metabolite of cyanidin-glucosides. J. Nutr. 2007;137:2043–2048. doi: 10.1093/jn/137.9.2043. [DOI] [PubMed] [Google Scholar]
- 55.Yao L, Liang Y, Trahanovsky WS, Serfass RE, White WS. Use of a 13C tracer to quantify the plasma appearance of a physiological dose of lutein in humans. Lipids. 2000;35:339–348. doi: 10.1007/s11745-000-0531-0. [DOI] [PubMed] [Google Scholar]
- 56.Yap SP, Yuen KH, Wong JW. Pharmacokinetics and bioavailability of alpha-, gamma- and delta-tocotrienols under different food status. J. Pharm. Pharmacol. 2001;53:67–71. doi: 10.1211/0022357011775208. [DOI] [PubMed] [Google Scholar]
- 57.Zempleni J, Galloway JR, McCormick DB. Pharmacokinetics of orally and intravenously administered riboflavin in healthy humans. Am. J. Clin. Nutr. 1996;63:54–66. doi: 10.1093/ajcn/63.1.54. [DOI] [PubMed] [Google Scholar]
- 58.Azachi M, Yatuv R, Katz A, Hagay Y, Danon A. A novel red grape cells complex: health effects and bioavailability of natural resveratrol. Int. J. Food Sci. Nutr. 2014;65:848–855. doi: 10.3109/09637486.2014.917152. [DOI] [PubMed] [Google Scholar]
- 59.Barnett CF, et al. Pharmacokinetic, partial pharmacodynamic and initial safety analysis of (−)-epicatechin in healthy volunteers. Food Funct. 2015;6:824–833. doi: 10.1039/C4FO00596A. [DOI] [PMC free article] [PubMed] [Google Scholar]
- 60.Bianchi ML, et al. No difference in intestinal strontium absorption after an oral or an intravenous 1,25(OH)2D3 bolus in normal subjects. For the European Study Group on Vitamin D in children with renal failure. J. Bone Miner. Res. 1999;14:1789–1795. doi: 10.1359/jbmr.1999.14.10.1789. [DOI] [PubMed] [Google Scholar]
- 61.Bowen PE, Herbst-Espinosa SM, Hussain EA, Stacewicz-Sapuntzakis M. Esterification does not impair lutein bioavailability in humans. J. Nutr. 2002;132:3668–3673. doi: 10.1093/jn/132.12.3668. [DOI] [PubMed] [Google Scholar]
- 62.Cao G, Muccitelli HU, Sanchez-Moreno C, Prior RL. Anthocyanins are absorbed in glycated forms in elderly women: a pharmacokinetic study. Am. J. Clin. Nutr. 2001;73:920–926. doi: 10.1093/ajcn/73.5.920. [DOI] [PubMed] [Google Scholar]
- 63.Carr AC, Bozonet SM, Vissers MC. A randomised cross-over pharmacokinetic bioavailability study of synthetic versus kiwifruit-derived vitamin C. Nutrients. 2013;5:4451–4461. doi: 10.3390/nu5114451. [DOI] [PMC free article] [PubMed] [Google Scholar]
- 64.Czank C, et al. Human metabolism and elimination of the anthocyanin, cyanidin-3-glucoside: a (13)C-tracer study. Am. J. Clin. Nutr. 2013;97:995–1003. doi: 10.3945/ajcn.112.049247. [DOI] [PubMed] [Google Scholar]
- 65.Diwadkar-Navsariwala V, et al. A physiological pharmacokinetic model describing the disposition of lycopene in healthy men. J. Lipid Res. 2003;44:1927–1939. doi: 10.1194/jlr.M300130-JLR200. [DOI] [PubMed] [Google Scholar]
- 66.Frank T, Netzel M, Strass G, Bitsch R, Bitsch I. Bioavailability of anthocyanidin-3-glucosides following consumption of red wine and red grape juice. Can. J. Physiol. Pharmacol. 2003;81:423–435. doi: 10.1139/y03-038. [DOI] [PubMed] [Google Scholar]
- 67.Frank T, et al. Pharmacokinetics of anthocyanidin-3-glycosides following consumption of Hibiscus sabdariffa L. extract. J. Clin. Pharmacol. 2005;45:203–210. doi: 10.1177/0091270004270561. [DOI] [PubMed] [Google Scholar]
- 68.González-Sarrías, A. et al. Identifying the limits for ellagic acid bioavailability: a crossover pharmacokinetic study in healthy volunteers after consumption of pomegranate extracts. J. Funct. Foods19, Part A, 225–235 (2015).
- 69.Hashimoto T, et al. Pharmacokinetics of fucoxanthinol in human plasma after the oral administration of kombu extract. Br. J. Nutr. 2012;107:1566–1569. doi: 10.1017/S0007114511004879. [DOI] [PubMed] [Google Scholar]
- 70.Haustein KO, Huller G. Pharmacokinetics of phenprocoumon. Int. J. Clin. Pharmacol. Ther. 1994;32:192–197. [PubMed] [Google Scholar]
- 71.Keane KM, et al. Phytochemical uptake following human consumption of Montmorency tart cherry (L. Prunus cerasus) and influence of phenolic acids on vascular smooth muscle cells in vitro. Eur. J. Nutr. 2016;55:1695–1705. doi: 10.1007/s00394-015-0988-9. [DOI] [PubMed] [Google Scholar]
- 72.Kostic D, White WS, Olson JA. Intestinal absorption, serum clearance, and interactions between lutein and beta-carotene when administered to human adults in separate or combined oral doses. Am. J. Clin. Nutr. 1995;62:604–610. doi: 10.1093/ajcn/62.3.604. [DOI] [PubMed] [Google Scholar]
- 73.Kuntz S, et al. Uptake and bioavailability of anthocyanins and phenolic acids from grape/blueberry juice and smoothie in vitro and in vivo. Br. J. Nutr. 2015;113:1044–1055. doi: 10.1017/S0007114515000161. [DOI] [PubMed] [Google Scholar]
- 74.Ludwig IA, et al. New insights into the bioavailability of red raspberry anthocyanins and ellagitannins. Free Radic. Biol. Med. 2015;89:758–769. doi: 10.1016/j.freeradbiomed.2015.10.400. [DOI] [PubMed] [Google Scholar]
- 75.Matsumoto H, et al. Orally administered delphinidin 3-rutinoside and cyanidin 3-rutinoside are directly absorbed in rats and humans and appear in the blood as the intact forms. J. Agric. Food. Chem. 2001;49:1546–1551. doi: 10.1021/jf001246q. [DOI] [PubMed] [Google Scholar]
- 76.McKay DL, Chen CY, Zampariello CA, Blumberg JB. Flavonoids and phenolic acids from cranberry juice are bioavailable and bioactive in healthy older adults. Food Chem. 2015;168:233–240. doi: 10.1016/j.foodchem.2014.07.062. [DOI] [PubMed] [Google Scholar]
- 77.Mertens-Talcott SU, et al. Pharmacokinetics of anthocyanins and antioxidant effects after the consumption of anthocyanin-rich acai juice and pulp (Euterpe oleracea Mart.) in human healthy volunteers. J. Agric. Food Chem. 2008;56:7796–7802. doi: 10.1021/jf8007037. [DOI] [PubMed] [Google Scholar]
- 78.Milbury PE, Vita JA, Blumberg JB. Anthocyanins are bioavailable in humans following an acute dose of cranberry juice. J. Nutr. 2010;140:1099–1104. doi: 10.3945/jn.109.117168. [DOI] [PubMed] [Google Scholar]
- 79.Miller RJ, et al. A preliminary investigation of the impact of catechol-O-methyltransferase genotype on the absorption and metabolism of green tea catechins. Eur. J. Nutr. 2012;51:47–55. doi: 10.1007/s00394-011-0189-0. [DOI] [PubMed] [Google Scholar]
- 80.Narumi K, et al. Simultaneous detection of green tea catechins and gallic acid in human serum after ingestion of green tea tablets using ion-pair high-performance liquid chromatography with electrochemical detection. J. Chromatogr. B Analyt. Technol. Biomed. Life Sci. 2014;945–946:147–153. doi: 10.1016/j.jchromb.2013.11.007. [DOI] [PubMed] [Google Scholar]
- 81.Nunes T, et al. Pharmacokinetics of trans-resveratrol following repeated administration in healthy elderly and young subjects. J. Clin. Pharmacol. 2009;49:1477–1482. doi: 10.1177/0091270009339191. [DOI] [PubMed] [Google Scholar]
- 82.Renouf M, et al. Plasma pharmacokinetics of catechin metabolite 4′-O-Me-EGC in healthy humans. Eur. J. Nutr. 2011;50:575–580. doi: 10.1007/s00394-010-0164-1. [DOI] [PubMed] [Google Scholar]
- 83.Rotches-Ribalta M, Andres-Lacueva C, Estruch R, Escribano E, Urpi-Sarda M. Pharmacokinetics of resveratrol metabolic profile in healthy humans after moderate consumption of red wine and grape extract tablets. Pharmacol. Res. 2012;66:375–382. doi: 10.1016/j.phrs.2012.08.001. [DOI] [PubMed] [Google Scholar]
- 84.Schramm DD, et al. Food effects on the absorption and pharmacokinetics of cocoa flavanols. Life Sci. 2003;73:857–869. doi: 10.1016/S0024-3205(03)00373-4. [DOI] [PubMed] [Google Scholar]
- 85.Seymour EM, et al. Anthocyanin pharmacokinetics and dose-dependent plasma antioxidant pharmacodynamics following whole tart cherry intake in healthy humans. J. Funct. Foods. 2014;11:509–516. doi: 10.1016/j.jff.2014.08.007. [DOI] [Google Scholar]
- 86.Song Q, et al. HPLC–APCI–MS for the determination of vitamin K1 in human plasma: method and clinical application. J. Chromatogr. B Analyt. Technol. Biomed. Life Sci. 2008;875:541–545. doi: 10.1016/j.jchromb.2008.10.009. [DOI] [PubMed] [Google Scholar]
- 87.Stalmach A, et al. Absorption, metabolism, and excretion of green tea flavan-3-ols in humans with an ileostomy. Mol. Nutr. Food Res. 2010;54:323–334. doi: 10.1002/mnfr.200900194. [DOI] [PubMed] [Google Scholar]
- 88.Stalmach A, Edwards CA, Wightman JD, Crozier A. Gastrointestinal stability and bioavailability of (poly)phenolic compounds following ingestion of Concord grape juice by humans. Mol. Nutr. Food Res. 2012;56:497–509. doi: 10.1002/mnfr.201100566. [DOI] [PubMed] [Google Scholar]
- 89.Steinberg FM, Holt RR, Schmitz HH, Keen CL. Cocoa procyanidin chain length does not determine ability to protect LDL from oxidation when monomer units are controlled. J. Nutr. Biochem. 2002;13:645–652. doi: 10.1016/S0955-2863(02)00215-2. [DOI] [PubMed] [Google Scholar]
- 90.Umigai N, et al. The pharmacokinetic profile of crocetin in healthy adult human volunteers after a single oral administration. Phytomedicine. 2011;18:575–578. doi: 10.1016/j.phymed.2010.10.019. [DOI] [PubMed] [Google Scholar]
- 91.Zhi J, Melia AT, Koss-Twardy SG, Arora S, Patel IH. The effect of orlistat, an inhibitor of dietary fat absorption, on the pharmacokinetics of β-carotene in healthy volunteers. J. Clin. Pharmacol. 1996;36:152–159. doi: 10.1002/j.1552-4604.1996.tb04180.x. [DOI] [PubMed] [Google Scholar]
- 92.Auclair B, Nix DE, Adam RD, James GT, Peloquin CA. Pharmacokinetics of ethionamide administered under fasting conditions or with orange juice, food, or antacids. Antimicrob. Agents Chemother. 2001;45:810–814. doi: 10.1128/AAC.45.3.810-814.2001. [DOI] [PMC free article] [PubMed] [Google Scholar]
- 93.Audet PR, Chiang S, Maroli A, Locniskar A, Morrison G. The effect of food on ciramadol bioavailability in normal subjects. Biopharm. Drug Dispos. 1987;8:299–304. doi: 10.1002/bdd.2510080310. [DOI] [PubMed] [Google Scholar]
- 94.Barbhaiya RH, Shukla UA, Gleason CR, Shyu WC, Pittman KA. Comparison of the effects of food on the pharmacokinetics of cefprozil and cefaclor. Antimicrob. Agents Chemother. 1990;34:1210–1213. doi: 10.1128/AAC.34.6.1210. [DOI] [PMC free article] [PubMed] [Google Scholar]
- 95.Barone JA, et al. Food interaction and steady-state pharmacokinetics of itraconazole capsules in healthy male volunteers. Antimicrob. Agents Chemother. 1993;37:778–784. doi: 10.1128/AAC.37.4.778. [DOI] [PMC free article] [PubMed] [Google Scholar]
- 96.Bastami S, et al. Pharmacogenetic aspects of tramadol pharmacokinetics and pharmacodynamics after a single oral dose. Forensic Sci. Int. 2014;238:125–132. doi: 10.1016/j.forsciint.2014.03.003. [DOI] [PubMed] [Google Scholar]
- 97.Bekersky I, Dressler D, Mekki QA. Effect of low- and high-fat meals on tacrolimus absorption following 5 mg single oral doses to healthy human subjects. J. Clin. Pharmacol. 2001;41:176–182. doi: 10.1177/00912700122009999. [DOI] [PubMed] [Google Scholar]
- 98.Bramer SL, Forbes WP. Relative bioavailability and effects of a high fat meal on single dose cilostazol pharmacokinetics. Clin. Pharmacokinet. 1999;37:13–23. doi: 10.2165/00003088-199937002-00002. [DOI] [PubMed] [Google Scholar]
- 99.Bu HZ, et al. Metabolism and excretion of capravirine, a new non-nucleoside reverse transcriptase inhibitor, alone and in combination with ritonavir in healthy volunteers. Drug Metab. Dispos. 2004;32:689–698. doi: 10.1124/dmd.32.7.689. [DOI] [PubMed] [Google Scholar]
- 100.Chang XY, Guo T, Xia DY. Pharmacokinetics of tinidazole in Chinese subjects: comparison of Mongolian, Korean, Hui, Uighur and Han nationalities. J. Pharm. Pharm. Sci. 2009;12:175–180. doi: 10.18433/J3KK50. [DOI] [PubMed] [Google Scholar]
- 101.Chen R, et al. A more rapid, sensitive, and specific HPLC-MS/MS method for nifedipine analysis in human plasma and application to a pharmacokinetic study. Drug Res. 2013;63:38–45. doi: 10.1055/s-0032-1331713. [DOI] [PubMed] [Google Scholar]
- 102.Cheng H, et al. Pharmacokinetics and food interaction of MK-462 in healthy males. Biopharm. Drug Dispos. 1996;17:17–24. doi: 10.1002/(SICI)1099-081X(199601)17:1<17::AID-BDD932>3.0.CO;2-F. [DOI] [PubMed] [Google Scholar]
- 103.de Campos DR, et al. Bioequivalence of two enteric coated formulations of pantoprazole in healthy volunteers under fasting and fed conditions. Arzneimittel-Forschung. 2007;57:309–314. doi: 10.1055/s-0031-1296624. [DOI] [PubMed] [Google Scholar]
- 104.Dingemanse J, Bodin F, Weidekamm E, Kutz K, van Giersbergen P. Influence of food intake and formulation on the pharmacokinetics and metabolism of bosentan, a dual endothelin receptor antagonist. J. Clin. Pharmacol. 2002;42:283–289. doi: 10.1177/00912700222011300. [DOI] [PubMed] [Google Scholar]
- 105.Doose DR, Walker SA, Gisclon LG, Nayak RK. Single-dose pharmacokinetics and effect of food on the bioavailability of topiramate, a novel antiepileptic drug. J. Clin. Pharmacol. 1996;36:884–891. doi: 10.1002/j.1552-4604.1996.tb04754.x. [DOI] [PubMed] [Google Scholar]
- 106.Eshelman FN, Spyker DA. Pharmacokinetics of amoxicillin and ampicillin: crossover study of the effect of food. Antimicrob. Agents Chemother. 1978;14:539–543. doi: 10.1128/AAC.14.4.539. [DOI] [PMC free article] [PubMed] [Google Scholar]
- 107.Francis RJ, Dixon JS, Lowe JR, Harris PA. The effects of food and of antacid on the single oral dose pharmacokinetics of tenoxicam. Eur. J. Drug Metab. Pharmacokinet. 1985;10:309–314. doi: 10.1007/BF03189758. [DOI] [PubMed] [Google Scholar]
- 108.Frost C, et al. Apixaban, an oral, direct factor Xa inhibitor: single dose safety, pharmacokinetics, pharmacodynamics and food effect in healthy subjects. Br. J. Clin. Pharmacol. 2013;75:476–487. doi: 10.1111/j.1365-2125.2012.04369.x. [DOI] [PMC free article] [PubMed] [Google Scholar]
- 109.Hamelin BA, et al. The effect of timing of a standard meal on the pharmacokinetics and pharmacodynamics of the novel atypical antipsychotic agent ziprasidone. Pharmacotherapy. 1998;18:9–15. [PubMed] [Google Scholar]
- 110.Herrstedt J, Jorgensen M, Angelo HR. The effect of food on serum concentrations of metopimazine. Br. J. Clin. Pharmacol. 1990;30:237–243. doi: 10.1111/j.1365-2125.1990.tb03770.x. [DOI] [PMC free article] [PubMed] [Google Scholar]
- 111.Jang, Y. J. et al. Prandial effect on the systemic exposure of amisulpride. Arch. Pharm. Res. 1325–1328 (2014). [DOI] [PubMed]
- 112.Kassahun K, et al. Disposition and biotransformation of the antipsychotic agent olanzapine in humans. Drug Metab. Dispos. 1997;25:81–93. [PubMed] [Google Scholar]
- 113.Khosravan R, Grabowski B, Wu JT, Joseph-Ridge N, Vernillet L. Effect of food or antacid on pharmacokinetics and pharmacodynamics of febuxostat in healthy subjects. Br. J. Clin. Pharmacol. 2008;65:355–363. doi: 10.1111/j.1365-2125.2007.03016.x. [DOI] [PMC free article] [PubMed] [Google Scholar]
- 114.Lee L, et al. The safety, tolerability, pharmacokinetics, and pharmacodynamics of single oral doses of RO5068760, an MEK inhibitor, in healthy volunteers: assessment of target suppression. J. Clin. Pharmacol. 2010;50:1397–1405. doi: 10.1177/0091270010361254. [DOI] [PubMed] [Google Scholar]
- 115.Lee L, et al. The safety, tolerability, pharmacokinetics, and pharmacodynamics of single oral doses of CH4987655 in healthy volunteers: target suppression using a biomarker. Clin. Cancer Res. 2009;15:7368–7374. doi: 10.1158/1078-0432.CCR-09-1696. [DOI] [PubMed] [Google Scholar]
- 116.Lettieri J, Vargas R, Agarwal V, Liu P. Effect of food on the pharmacokinetics of a single oral dose of moxifloxacin 400 mg in healthy male volunteers. Clin. Pharmacokinet. 2001;40(Suppl 1):19–25. doi: 10.2165/00003088-200140001-00003. [DOI] [PubMed] [Google Scholar]
- 117.Li Y, et al. Pharmacokinetic properties of rosuvastatin after single-dose, oral administration in Chinese volunteers: a randomized, open-label, three-way crossover study. Clin. Ther. 2007;29:2194–2203. doi: 10.1016/j.clinthera.2007.10.005. [DOI] [PubMed] [Google Scholar]
- 118.Lindholm A, Henricsson S, Dahlqvist R. The effect of food and bile acid administration on the relative bioavailability of cyclosporin. Br. J. Clin. Pharmacol. 1990;29:541–548. doi: 10.1111/j.1365-2125.1990.tb03677.x. [DOI] [PMC free article] [PubMed] [Google Scholar]
- 119.Liu MY, et al. Pharmacokinetic properties and bioequivalence of two formulations of arbidol: an open-label, single-dose, randomized-sequence, two-period crossover study in healthy Chinese male volunteers. Clin. Ther. 2009;31:784–792. doi: 10.1016/j.clinthera.2009.04.016. [DOI] [PMC free article] [PubMed] [Google Scholar]
- 120.Mahatthanatrakul W, et al. Effect of cytochrome P450 3A4 inhibitor ketoconazole on risperidone pharmacokinetics in healthy volunteers. J. Clin. Pharm. Ther. 2012;37:221–225. doi: 10.1111/j.1365-2710.2011.01271.x. [DOI] [PubMed] [Google Scholar]
- 121.Mannisto PT, Mantyla R, Nykanen S, Lamminsivu U, Ottoila P. Impairing effect of food on ketoconazole absorption. Antimicrob. Agents Chemother. 1982;21:730–733. doi: 10.1128/AAC.21.5.730. [DOI] [PMC free article] [PubMed] [Google Scholar]
- 122.Melander A, Wahlin E, Danielson K, Rerup C. On the influence of concomitant food intake on sulfonamide bioavailability. Acta Med. Scand. 1976;200:497–500. doi: 10.1111/j.0954-6820.1976.tb08272.x. [DOI] [PubMed] [Google Scholar]
- 123.Misaka S, et al. Green tea ingestion greatly reduces plasma concentrations of nadolol in healthy subjects. Clin. Pharmacol. Ther. 2014;95:432–438. doi: 10.1038/clpt.2013.241. [DOI] [PubMed] [Google Scholar]
- 124.Noh YH, et al. Assessment of the influence of severe renal impairment on the pharmacokinetics of mirodenafil in Korean male volunteers. Int. J. Clin. Pharmacol. Ther. 2012;50:880–888. doi: 10.5414/CP201721. [DOI] [PubMed] [Google Scholar]
- 125.Novalbos J, et al. Effects of CYP2D6 genotype on the pharmacokinetics, pharmacodynamics, and safety of risperidone in healthy volunteers. J. Clin. Psychopharmacol. 2010;30:504–511. doi: 10.1097/JCP.0b013e3181ee84c7. [DOI] [PubMed] [Google Scholar]
- 126.Ochs HR, Ramsch KD, Verburg-Ochs B, Greenblatt DJ, Gerloff J. Nifedipine: kinetics and dynamics after single oral doses. Klin. Wochenschr. 1984;62:427–429. doi: 10.1007/BF01742301. [DOI] [PubMed] [Google Scholar]
- 127.Ohmori S, Miura M, Toriumi C, Satoh Y, Ooie T. Absorption, metabolism, and excretion of [14C]imidafenacin, a new compound for treatment of overactive bladder, after oral administration to healthy male subjects. Drug Metab. Dispos. 2007;35:1624–1633. doi: 10.1124/dmd.107.016030. [DOI] [PubMed] [Google Scholar]
- 128.Overdiek HW, Merkus FW. Influence of food on the bioavailability of spironolactone. Clin. Pharmacol. Ther. 1986;40:531–536. doi: 10.1038/clpt.1986.219. [DOI] [PubMed] [Google Scholar]
- 129.Parrillo-Campiglia S, et al. Bioequivalence of two film-coated tablets of imatinib mesylate 400 mg: a randomized, open-label, single-dose, fasting, two-period, two-sequence crossover comparison in healthy male South American volunteers. Clin. Ther. 2009;31:2224–2232. doi: 10.1016/j.clinthera.2009.10.009. [DOI] [PubMed] [Google Scholar]
- 130.Paulson SK, et al. Pharmacokinetics of celecoxib after oral administration in dogs and humans: effect of food and site of absorption. J. Pharmacol. Exp. Ther. 2001;297:638–645. [PubMed] [Google Scholar]
- 131.Peloquin CA, et al. Pharmacokinetics of pyrazinamide under fasting conditions, with food, and with antacids. Pharmacotherapy. 1998;18:1205–1211. [PubMed] [Google Scholar]
- 132.Peloquin CA, Namdar R, Singleton MD, Nix DE. Pharmacokinetics of rifampin under fasting conditions, with food, and with antacids. Chest. 1999;115:12–18. doi: 10.1378/chest.115.1.12. [DOI] [PubMed] [Google Scholar]
- 133.Peloquin CA, et al. Pharmacokinetics of ethambutol under fasting conditions, with food, and with antacids. Antimicrob. Agents Chemother. 1999;43:568–572. doi: 10.1128/aac.43.3.568. [DOI] [PMC free article] [PubMed] [Google Scholar]
- 134.Shi JG, et al. The effect of CYP3A4 inhibition or induction on the pharmacokinetics and pharmacodynamics of orally administered ruxolitinib (INCB018424 phosphate) in healthy volunteers. J. Clin. Pharmacol. 2012;52:809–818. doi: 10.1177/0091270011405663. [DOI] [PubMed] [Google Scholar]
- 135.Soyinka JO, Onyeji CO. Alteration of pharmacokinetics of proguanil in healthy volunteers following concurrent administration of efavirenz. Eur. J. Pharm. Sci. 2010;39:213–218. doi: 10.1016/j.ejps.2009.11.012. [DOI] [PubMed] [Google Scholar]
- 136.Stoch SA, et al. Odanacatib, a selective cathepsin K inhibitor to treat osteoporosis: safety, tolerability, pharmacokinetics and pharmacodynamics–results from single oral dose studies in healthy volunteers. Br. J. Clin. Pharmacol. 2013;75:1240–1254. doi: 10.1111/j.1365-2125.2012.04471.x. [DOI] [PMC free article] [PubMed] [Google Scholar]
- 137.Sturm S, et al. Metabolism, excretion, and pharmacokinetics of [14c]-radiolabeled aleglitazar: a phase I, nonrandomized, open-label, single-center, single-dose study in healthy male volunteers. Clin. Ther. 2012;34:420–429. doi: 10.1016/j.clinthera.2011.12.009. [DOI] [PubMed] [Google Scholar]
- 138.Tenero D, et al. Pharmacokinetics of intravenously and orally administered eprosartan in healthy males: absolute bioavailability and effect of food. Biopharm. Drug Dispos. 1998;19:351–356. doi: 10.1002/(SICI)1099-081X(199809)19:6<351::AID-BDD115>3.0.CO;2-V. [DOI] [PubMed] [Google Scholar]
- 139.Usman M, et al. Comparative pharmacokinetics of levofloxacin in healthy volunteers and in patients suffering from typhoid fever. Iran J. Pharm. Res. 2013;12:147–154. [PMC free article] [PubMed] [Google Scholar]
- 140.van Marle S, van Vliet A, Sollie F, Kambayashi Y, Yamada-Sawada T. Safety, tolerability and pharmacokinetics of oral S-3304, a novel matrix metalloproteinase inhibitor, in single and multiple dose escalation studies in healthy volunteers. Int. J. Clin. Pharmacol. Ther. 2005;43:282–293. doi: 10.5414/CPP43282. [DOI] [PubMed] [Google Scholar]
- 141.O’Farrell AM, et al. Pharmacokinetic and pharmacodynamic assessments of the dipeptidyl peptidase-4 inhibitor PHX1149: double-blind, placebo-controlled, single- and multiple-dose studies in healthy subjects. Clin. Ther. 2007;29:1692–1705. doi: 10.1016/j.clinthera.2007.08.005. [DOI] [PubMed] [Google Scholar]
- 142.Yan M, et al. Lack of effect of continuous glycyrrhizin administration on the pharmacokinetics of the P-glycoprotein substrate talinolol in healthy volunteers. Eur. J. Clin. Pharmacol. 2013;69:515–521. doi: 10.1007/s00228-012-1391-6. [DOI] [PubMed] [Google Scholar]
- 143.Yeh KC, et al. Single-dose pharmacokinetics of indinavir and the effect of food. Antimicrob. Agents Chemother. 1998;42:332–338. doi: 10.1128/aac.42.2.332. [DOI] [PMC free article] [PubMed] [Google Scholar]
- 144.Zhang J, et al. The effects of food on the pharmacokinetics of mitiglinide tablets in healthy volunteers and a novel mass-spectrometric (UPLC-MS/MS) method for such studies. J. Clin. Pharm. Ther. 2012;37:95–99. doi: 10.1111/j.1365-2710.2011.01257.x. [DOI] [PubMed] [Google Scholar]
- 145.Zhou X, Lloyd DM, Chao GC, Brown NA. Absence of food effect on the pharmacokinetics of telbivudine following oral administration in healthy subjects. J. Clin. Pharmacol. 2006;46:275–281. doi: 10.1177/0091270005284849. [DOI] [PubMed] [Google Scholar]
- 146.Zimmermann T, Yeates RA, Laufen H, Pfaff G, Wildfeuer A. Influence of concomitant food intake on the oral absorption of two triazole antifungal agents, itraconazole and fluconazole. Eur. J. Clin. Pharmacol. 1994;46:147–150. doi: 10.1007/BF00199879. [DOI] [PubMed] [Google Scholar]
- 147.Zollinger, M. et al. Absorption, distribution, metabolism, and excretion (ADME) of C-sonidegib (LDE225) in healthy volunteers. Cancer Chemother. Pharmacol. 63–75 (2014). [DOI] [PubMed]
- 148.Peloquin CA, Namdar R, Dodge AA, Nix DE. Pharmacokinetics of isoniazid under fasting conditions, with food, and with antacids. Int. J. Tuberc. Lung Dis. 1999;3:703–710. [PubMed] [Google Scholar]
- 149.Courtney R, Wexler D, Radwanski E, Lim J, Laughlin M. Effect of food on the relative bioavailability of two oral formulations of posaconazole in healthy adults. Br. J. Clin. Pharmacol. 2004;57:218–222. doi: 10.1046/j.1365-2125.2003.01977.x. [DOI] [PMC free article] [PubMed] [Google Scholar]
- 150.Dien TK, et al. Effect of food intake on pharmacokinetics of oral artemisinin in healthy Vietnamese subjects. Antimicrob. Agents Chemother. 1997;41:1069–1072. doi: 10.1128/aac.41.5.1069. [DOI] [PMC free article] [PubMed] [Google Scholar]
- 151.Williams DD, et al. Effects of food and antacids on the pharmacokinetics of eltrombopag in healthy adult subjects: two single-dose, open-label, randomized-sequence, crossover studies. Clin. Ther. 2009;31:764–776. doi: 10.1016/j.clinthera.2009.04.010. [DOI] [PubMed] [Google Scholar]
- 152.van de Waterbeemd H, Smith DA, Jones BC. Lipophilicity in PK design: methyl, ethyl, futile. J. Comput. Aided Mol. Des. 2001;15:273–286. doi: 10.1023/A:1008192010023. [DOI] [PubMed] [Google Scholar]
- 153.Dressman JB, Amidon GL, Reppas C, Shah VP. Dissolution testing as a prognostic tool for oral drug absorption: immediate release dosage forms. Pharm. Res. 1998;15:11–22. doi: 10.1023/A:1011984216775. [DOI] [PubMed] [Google Scholar]
- 154.MacCallum RC, Browne MW, Sugawara HM. Power analysis and determination of sample size for covariance structure modeling. Psychol. Methods. 1996;1:130–149. doi: 10.1037/1082-989X.1.2.130. [DOI] [Google Scholar]
- 155.Gu CH, et al. Predicting effect of food on extent of drug absorption based on physicochemical properties. Pharm. Res. 2007;24:1118–1130. doi: 10.1007/s11095-007-9236-1. [DOI] [PubMed] [Google Scholar]
- 156.Fielding JM, Rowley KG, Cooper P, O’ Dea K. Increases in plasma lycopene concentration after consumption of tomatoes cooked with olive oil. Asia Pac. J. Clin. Nutr. 2005;14:131–136. [PubMed] [Google Scholar]
- 157.Padayachee A, et al. Lack of release of bound anthocyanins and phenolic acids from carrot plant cell walls and model composites during simulated gastric and small intestinal digestion. Food Funct. 2013;4:906–916. doi: 10.1039/c3fo60091b. [DOI] [PubMed] [Google Scholar]
- 158.Serafini M, et al. Plasma antioxidants from chocolate. Nature. 2003;424:1013–1013. doi: 10.1038/4241013a. [DOI] [PubMed] [Google Scholar]
- 159.Huang, Y., Park, E., Edirisinghe, I. & Burton-Freeman, B. M. Maximizing the health effects of strawberry anthocyanins: understanding the influence of the consumption timing variable. Food Funct (2016). [DOI] [PubMed]
- 160.Sandhu AK, et al. Pharmacokinetic characterization and bioavailability of strawberry anthocyanins relative to meal intake. J. Agric. Food Chem. 2016;64:4891–4899. doi: 10.1021/acs.jafc.6b00805. [DOI] [PubMed] [Google Scholar]
- 161.Azam S, Hadi N, Khan NU, Hadi SM. Prooxidant property of green tea polyphenols epicatechin and epigallocatechin-3-gallate: implications for anticancer properties. Toxicol. In Vitro. 2004;18:555–561. doi: 10.1016/j.tiv.2003.12.012. [DOI] [PubMed] [Google Scholar]
- 162.Raza H, John A. Green tea polyphenol epigallocatechin-3-gallate differentially modulates oxidative stress in PC12 cell compartments. Toxicol. Appl. Pharmacol. 2005;207:212–220. doi: 10.1016/j.taap.2005.01.004. [DOI] [PubMed] [Google Scholar]
- 163.Watjen W, et al. Low concentrations of flavonoids are protective in rat H4IIE cells whereas high concentrations cause DNA damage and apoptosis. J. Nutr. 2005;135:525–531. doi: 10.1093/jn/135.3.525. [DOI] [PubMed] [Google Scholar]
- 164.Donnini S, et al. Divergent effects of quercetin conjugates on angiogenesis. Br. J. Nutr. 2006;95:1016–1023. doi: 10.1079/BJN20061753. [DOI] [PubMed] [Google Scholar]
- 165.Koga T, Meydani M. Effect of plasma metabolites of (+)-catechin and quercetin on monocyte adhesion to human aortic endothelial cells. Am. J. Clin. Nutr. 2001;73:941–948. doi: 10.1093/ajcn/73.5.941. [DOI] [PubMed] [Google Scholar]
- 166.Forester SC, Waterhouse AL. Gut metabolites of anthocyanins, gallic acid, 3-O-methylgallic acid, and 2,4,6-trihydroxybenzaldehyde, inhibit cell proliferation of Caco-2 cells. J. Agric. Food Chem. 2010;58:5320–5327. doi: 10.1021/jf9040172. [DOI] [PubMed] [Google Scholar]
- 167.Jaganath IB, Mullen W, Edwards CA, Crozier A. The relative contribution of the small and large intestine to the absorption and metabolism of rutin in man. Free Radic. Res. 2006;40:1035–1046. doi: 10.1080/10715760600771400. [DOI] [PubMed] [Google Scholar]
- 168.Gonzalez-Barrio R, Edwards CA, Crozier A. Colonic catabolism of ellagitannins, ellagic acid, and raspberry anthocyanins: in vivo and in vitro studies. Drug Metab. Dispos. 2011;39:1680–1688. doi: 10.1124/dmd.111.039651. [DOI] [PubMed] [Google Scholar]
- 169.Del Rio D, et al. Dietary (poly)phenolics in human health: structures, bioavailability, and evidence of protective effects against chronic diseases. Antioxid. Redox Signal. 2013;18:1818–1892. doi: 10.1089/ars.2012.4581. [DOI] [PMC free article] [PubMed] [Google Scholar]
- 170.Hozo SP, Djulbegovic B, Hozo I. Estimating the mean and variance from the median, range, and the size of a sample. BMC Med. Res. Methodol. 2005;5:13. doi: 10.1186/1471-2288-5-13. [DOI] [PMC free article] [PubMed] [Google Scholar]
- 171.R Core Team (R Foundation for Statistical Computing, Vienna, Austria 2016).
- 172.Faul F, Erdfelder E, Lang AG, Buchner A. G*Power 3: a flexible statistical power analysis program for the social, behavioral, and biomedical sciences. Behav. Res. Methods. 2007;39:175–191. doi: 10.3758/BF03193146. [DOI] [PubMed] [Google Scholar]
- 173.Cohen, J. In statistical power analysis for the behavioral sciences (revised edition) 407–453 (Academic Press, 1977).
Associated Data
This section collects any data citations, data availability statements, or supplementary materials included in this article.