Abstract
The obstruction of ventricular catheters (VCs) is a major problem in the standard treatment of hydrocephalus, the flow pattern of the cerebrospinal fluid (CSF) being one important factor thereof. As a first approach to this problem, some of the authors studied previously the CSF flow through VCs under time-independent boundary conditions by means of computational fluid dynamics in three-dimensional models. This allowed us to derive a few basic principles which led to designs with improved flow patterns regarding the obstruction problem. However, the flow of the CSF has actually a pulsatile nature because of the heart beating and blood flow. To address this fact, here we extend our previous computational study to models with oscillatory boundary conditions. The new results will be compared with the results for constant flows and discussed. It turns out that the corrections due to the pulsatility of the CSF are quantitatively small, which reinforces our previous findings and conclusions.
This article is part of the themed issue ‘Mathematical methods in medicine: neuroscience, cardiology and pathology’.
Keywords: hydrocephalus, ventricular catheters, pulsatile flow, numerical simulations
1. Introduction
Hydrocephalus is a medical condition consisting of an abnormal accumulation of cerebrospinal fluid (CSF) in the ventricular cavities of the brain. There are four such cavities, or ventricles: the left and right (lateral) ventricles, together with the third and fourth ones; all of them are interconnected, thus allowing the CSF to circulate. The CSF is produced in the choroid plexus, which is a network of modified cells present in the four ventricles. Hydrocephalus is usually caused by a disturbance in the production, circulation and absorption processes of the CSF [1–5]. One of the prominent characteristics of hydrocephalus is the occurrence of expanded ventricles. To treat hydrocephalus, a catheter is inserted in one of the ventricles, therefore called a ventricular catheter (VC), which is then connected to an external valve to drain the excess CSF and divert it to another body cavity. The whole CSF extraction system is called a shunt.
A standard VC is a long tube made of a silicone elastomer, just a few millimetres across, with holes punctured equidistantly around some transversal sections which we call drainage segments or simply segments. These holes may be cylindrical or conical (with the outer diameter greater than the inner one), and their diameter is typically 0.5 mm. Furthermore, standard VCs have 12–32 holes, with usually four holes per segment, and segments located at the same distance from each other. For a given extraction pressure at the valve, the (volumetric) flow rate is determined by the total drainage area, i.e. by the number of holes and their cross sections.
The blockage of the VC, i.e. the obstruction of some of its holes and even of its interior (lumen) by cells and macromolecules present in the CSF, is the most common cause of shunt malfunction. This problem has, in turn, several potential factors, including a wrong placement of the catheter in the ventricle. In this work, we consider only obstruction factors related to the CSF flow characteristics in VCs, thus amenable to the methods of computational fluid dynamics (CFD). According to the literature, flow characteristics are one of the most important factors of VC obstruction [6–9]. To illustrate this point, let us mention that, in standard VCs, between 50% and 75% of the CSF volume flows through proximal holes, i.e. holes located on the segment closest to the valve (or furthest from the tip of the VC), therefore, downstream of the other segments. This fact increases the shear stress at the proximal segment (hence, the likelihood of obstruction there [10]) and, moreover, makes critical any obstruction at its interior.
Designing VCs less prone to obstruction (thus, with a longer expected lifetime) is crucial for the treatment of hydrocephalus. A first step towards the numerical study of the CSF flow in VCs was done in [6] using CFD in two dimensions. This work was generalized to three dimensions in [11–15], where some of the authors of this paper examined how variations of the hole geometry and configuration affect the flow rate distribution per segment and the shear stress at the holes. To this end, the geometry of manifold VCs was modelled in minute detail and the steady solution of the general Navier–Stokes equation was computed in a domain containing the VC under stationary boundary conditions. Based on these results, we formulated a number of basic VC design principles in [14].
However, owing to the heart beating and blood flow, both CSF pressure and volume act in a steady pulsatile manner onto the VC [16–22]. This raises the question as to what extent the time-dependent character of the real CSF flow modifies our previous results, in particular, our VC design principles. To answer this question, we have performed further numerical simulations, this time implementing more realistic boundary conditions. In this paper, we present an updated model whose novelty is a pulsatile flow at the inlet, and compare the new results to the results for a constant flow. It follows that the pulsatility of the CSF flow introduces small oscillatory corrections to the flow rates and shear stresses obtained with a constant flow. The latter coincide with the averages of the corresponding oscillatory quantities over one period.
Finally, let us emphasize that this paper is the result of a multidisciplinary collaboration between mathematicians and neurosurgeons. Since the intended readers are from the fields of natural sciences and engineering, we put the focus on the mathematical aspects while keeping the biomedical ones comprehensible to a general readership. In any case, the design of VCs for hydrocephalus is the main objective of our research.
The rest of this paper is organized as follows. Section 2 contains the details of the mathematical model used in the numerical simulations: CFD software, flow domain, governing equations, and initial and boundary conditions. For completion, §3 summarizes the previous work for stationary flows. The results for four different pulsatile inlet flows are then described in §4. The exposition finishes with a discussion of the biomedical consequences of the results in §5 and a summary in §6.
2. Material and methods
The physical problem we envisage in this paper is the flow of a simple, incompressible fluid (the CSF) through a catheter placed inside a cavity. The fluid flows into the cavity through an inlet and exits through the lumen of the catheter. To deal with this problem, we build a numerical model of the physical domain (i.e. catheter and cavity) and solve the Navier–Stokes equations numerically with appropriate initial and boundary conditions. In sum, our analysis tool is CFD in three dimensions.
(a). Computational fluid dynamics software
A numerical model consists of three basic steps: data pre-processing, solving process and data post-processing. In the pre-processing step, the computational domain and the meshing of the model are built, and the initial and boundary conditions are fixed. Next, a suitable numerical scheme is implemented to solve the governing equations of the model. Lastly, in the post-processing step, a correct analysis and visualization of the data are required to ensure a proper discussion of the results.
It is, therefore, customary in CFD to use numerous software tools to carry out a numerical experiment. The core of our simulations was OpenFOAM®, which is the acronym of Open Source Field Operation and Manipulation. OpenFOAM® is an open-source CFD software based on C++ that contains a toolbox for tailored numerical solvers. The algorithm implemented in OpenFOAM® uses the finite-volume method on unstructured meshes [23,24]. OpenFOAM® includes pre-processing and post-processing capabilities such as snappyHexMesh and ParaFoam for meshing and visualization, respectively. We also used other open-source software that provides pre-processing and post-processing tools for CFD such as Salome and ParaView. Salome (v. 7.3.0) was mainly used to build the geometry of the different models, and ParaView (v. 4.1.0) to display some of the images.
(b). Flow domain
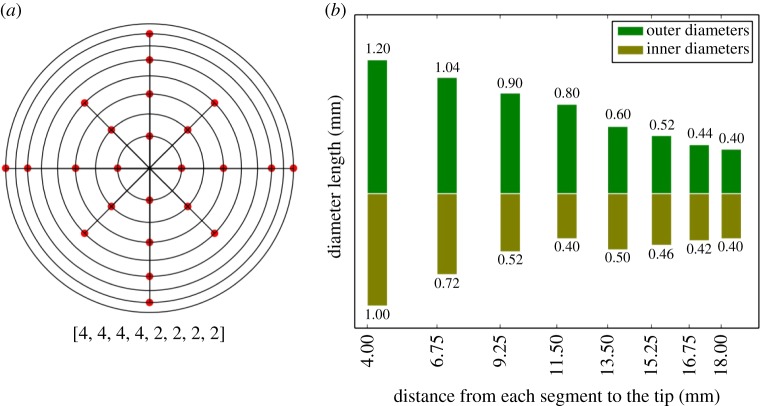
The real flow domain is a catheter along with the lateral ventricle in which the catheter is placed. However, our goal is just to compute the flow rate distribution and shear stress in a neighbourhood of the VC walls, so the influence that the geometry and volume of the ventricle might have on the results is negligible. In view of this fact, the lateral ventricle was modelled as a cylinder (figure 1) to facilitate the task of meshing and thus improving the accuracy and computational efficiency. The cylinder is 75 mm long and its diameter is 16 mm. The inner diameter and outer diameter of the catheter are 1.5 mm and 2.5 mm, respectively, and the part of the catheter inside the cylinder has a length of 60 mm. The configuration and dimensions of the VC holes are the same in all models; they are given in figure 2. In particular, the VC has eight drainage segments, numbered 1–8 from the distal to the proximal segment, along a perforated area whose length is 14 mm. Unless otherwise stated, holes are conical and, furthermore, all the holes belonging to the same segment have the same internal and external diameters (figures 1 and 2). For the purposes of this study, their geometric features were adjusted following the design principles established in [14,15], to obtain an approximately uniform flow rate distribution. The assumption that both the cylinder and the catheter are rigid and straight is a natural simplification that implies no significant differences in the results.
Figure 1.
Flow domain. (a) Computational domain used in all models. It comprises a VC inside a cylinder. (b) Enlarged image of the VC. It contains eight drainage segments which will be always numbered from the distal segment to the proximal segment (left-to-right). The holes of the first seven segments are conical, and the holes of the eighth segment (the last) are cylindrical. (Online version in colour.)
Figure 2.
Ventricular catheter design. (a) Two-dimensional diagram of the arrangement of the holes on the catheter. Rings from inside to outside correspond to segments from left to right. The points indicate the angular position of the hole inside the segment. All the holes in the same segment have the same measurements. (b) Distribution of the hole diameters in the same segment. We refer to the diameter of the hole cross section in the outside (inside) part of the catheter as outer (inner) diameter. In cylindrical holes, the outer and inner diameters coincide. (Online version in colour.)
Finally, let us underline that the grid must be fine because the flow rate distribution is very sensitive to changes in the hole diameters, especially in the proximal segments with small diameters. Therefore, we introduced by hand the coordinates of the VC holes with a high accuracy, the computational mesh being then automatically generated by snappyHexMesh, which is controlled by some meshing parameters. As a result, the grid is uniform over the whole computational domain, without refinements around the holes.
(c). Governing equations
Our model is governed by the incompressible Navier–Stokes equations given by
| 2.1 |
and
| 2.2 |
where u stands for the velocity field, t for time, p for pressure, and ν and ρ denote the kinematic viscosity and density of the CSF (ν=7.5×10⁻⁷ m2 s−1, ρ=1000 kg m−3), respectively. Equation (2.1) is the general Navier–Stokes equation. Fluids described by this equation are called simple (or Newtonian) because their stress tensor has a mathematically simple structure. The Navier–Stokes equation is thought to describe simple fluids even in the turbulent regime. Equation (2.2) is the incompressibility constraint, which entails in particular that the inlet flow is equal to the outlet flow. The most important simple, incompressible fluid is, of course, water. The CSF behaves to a high degree of accuracy as a simple fluid, which justifies the use of equations (2.1) and (2.2) in this case.
We integrated numerically the coupled system (2.1) and (2.2) by means of the icoFoam solver, which is based on the so-called PISO algorithm and implemented in OpenFOAM®. The icoFoam code is inherently transient, requiring an initial condition and boundary conditions.
(d). Initial and boundary conditions
In the literature, the pulsatile nature of the CSF flow is widely recognized [16–22]. In some of those studies, the CSF pulsatile behaviour in a ventricle is modelled mathematically by the periodic flow rate:
| 2.3 |
and
 |
2.4 |
where
— the quantity qbulk is the mean production flow (volume per unit time);
— the quantity qpuls(t) is the pulsatile flow related to the heart beat;
— the parameter α determines the amplitude of the flow rate qpuls(t) (the difference between the maximum value and the minimum value); and
— the parameter ω determines the period of the heart beat.
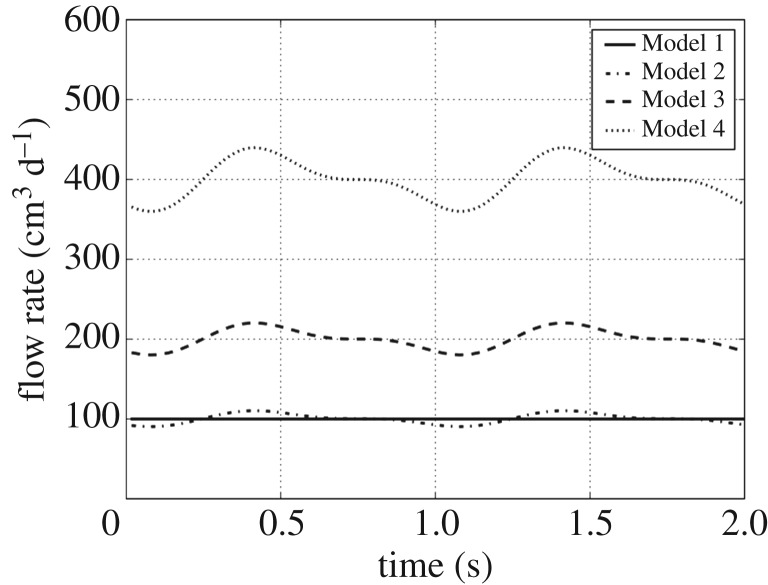
In our study, four different cases were considered according to the flow at the inlet boundary (the left cylinder base in figure 1). The parameter values of these inlet flows are collected in table 1 and their graphic representations are drawn in figure 3. The different values of qbulk reflect, and are commensurate with, the variability of CSF production from patient to patient.
Table 1.
Flow regimes and parameter values of the models (qbulk and α in cm3 d−1, and ω in rad s−1).
| regime | qbulk | α | ω | |
|---|---|---|---|---|
| Model 1 | steady | 100 | 0 | — |
| Model 2 | pulsatile | 100 | 7.7 | 2π |
| Model 3 | pulsatile | 200 | 15.4 | 2π |
| Model 4 | pulsatile | 400 | 30.8 | 2π |
Figure 3.
Inlet flow in cubic centimetres per day.
Thus, in Model 1 the inlet flow is steady and its volume rate is 100 cm3 d−1, which results in a fluid velocity at the outlet (lumen of the VC) of about 2.4 m h−1. With this velocity and the diameter of the cylindrical cavity (16 mm) as the characteristic dimension, the Reynolds number of the problem is about 15.
In Models 2–4, the inlet flow pulsates according to the mathematical model (2.3). The parameter α was adjusted to obtain approximately an inlet flow amplitude of 20% of the mean production flow qbulk. The parameter ω was taken to achieve a period of 1 s, which means 60 beats per minute. The runtime was also 2 s, thereby achieving two complete periods. The pressure was taken as zero gradient at the inlet boundary.
At the outlet boundary (the intersection of the VC lumen with the right cylinder base), the pressure was fixed to 15 cm H2O (=1471 Pa) and a zero gradient condition was set on the velocity. The conditions at the wall boundaries were no-slip for the velocity and zero gradient for the pressure (which is compatible with the no-slip condition for the velocity). On the rest of the computational domain, the initial velocity was taken to be zero and the pressure 15 cm H2O.
(e). Computer performance
OpenFOAM® allows parallel computation using the domain decomposition method, in which the mesh and its associated fields are partitioned into subdomains and allocated to separate processors. Thus, the program can run in parallel on separate subdomains by means of a communication protocol known as message passing interface (MPI). The number of subdomains should be equal to, or greater than, the number of processors.
The current numerical simulations were carried out with the following computer equipment: Dell PowerEdge R730, with two Intel® Xeon® Processors E5-2650 v3 (25M Cache, 2.30 GHz) and 64 GB RDIMM, 2133 MT s−1, Dual Rank. The total number of cells covering the whole computational domain were 10 854 360 divided into 20 subdomains through the Scotch decomposition method, which requires no geometric input from the user and attempts to minimize the number of processor boundaries. The total execution time in each model (considering both meshing and solver computations) was approximately 15 h when using 20 processors running in parallel.
3. Previous work
Before describing in §4 the results obtained with the new, more realistic model featuring a pulsatile flow, in this section, we review briefly previous work directly related to the present one. For a general account of the historical development of VCs for the treatment of hydrocephalus, the interested reader is referred to [25].
In 2003, Lin et al. published a landmark study [6] on the stationary flow in standard VCs by means of CFD. A standard VC is characterized by a constant inter-segment distance, holes of the same size and the same number of holes per segment, totalling 12–32 holes in general. Using a two-dimensional model, the authors reproduced numerically the experimental flow of water on the horizontal symmetry plane of a standard catheter. In particular, they obtained the typical increasing distribution of the flow rates through the drainage segments, the greatest rate occurring at the proximal segment. As already explained in §2, this distribution favours obstruction in standard VCs and, hence, shunt failure.
The numerical work of Lin et al. was generalized to a three-dimensional stationary flow by Galarza et al. [11–13]. The CFD software, flow domain and governing equations were the same as described above in §2a–c. Moreover, all the boundary conditions were time-independent, as corresponds to a stationary flow. Specifically, the velocity field at the inlet was adjusted to achieve a constant inflow of 100 cm3 d−1, as in Model 1. On the rest of the boundaries, the conditions were the same as in §2d.
The scope of [11–13] was to explore the dependence of the flow pattern on the geometrical configuration of a VC, which was basically given by the number of segments, inter-segment distances and drainage area per segment. The authors considered new designs beyond the standard VCs and compared them with the Rivulet design [26], which differs from a standard VC in that the hole size decreases from the distal to the proximal segment. The authors showed in [13] how to obtain uniform, increasing and decreasing flow rate distributions along the perforated area of a VC by varying the inter-segment distance and the drainage area per segment.
These explorations led to a more systematic study in [14]. As a result of a parametric study, the authors derived a number of general principles for the design of VCs. Moreover, they concretized those principles in several designs with uniform flow patterns and also showed that an additional perforation at the catheter’s tip has a negligible impact on the flow rates through the drainage segments. The same authors extended those principles in [15], where the influence of conical holes and their tilt angle was numerically analysed. All these principles allow obtaining flow rate distributions at will, thus constituting a set of guidelines for designing catheters theoretically less prone to obstruction.
4. The pulsatile flow
In this section, we describe the results of the numerical simulations performed with Models 1–4. We refer to figures 4–7 for a graphical representation of the flow characteristics under scrutiny for the different models.
Figure 4.
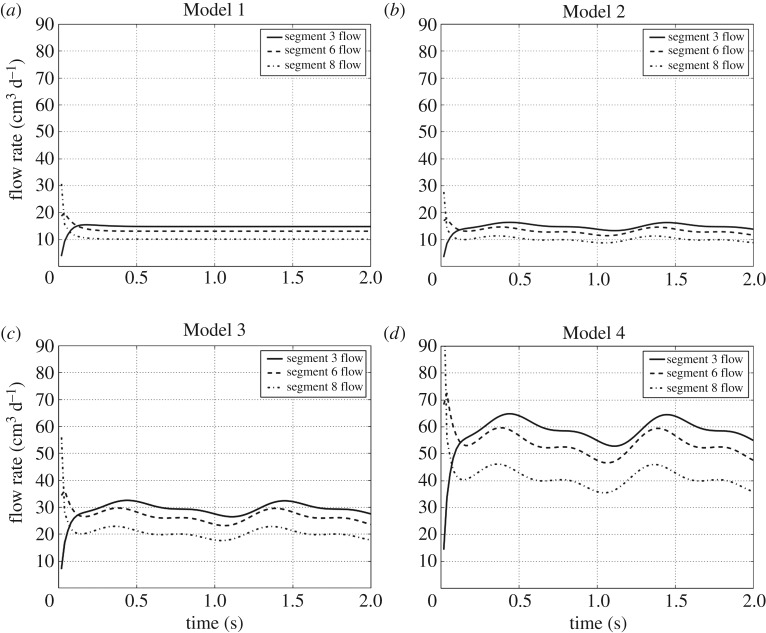
Flow time evolution per segment. (a–d) The periodic behaviour of the flow rate through some drainage segment corresponding to Models 1–4, respectively. For the sake of a better visualization, only the time evolution of the flow through the segments 3, 6 and 8 is shown; the flow evolution behaviour in the other segments is similar.
Figure 7.
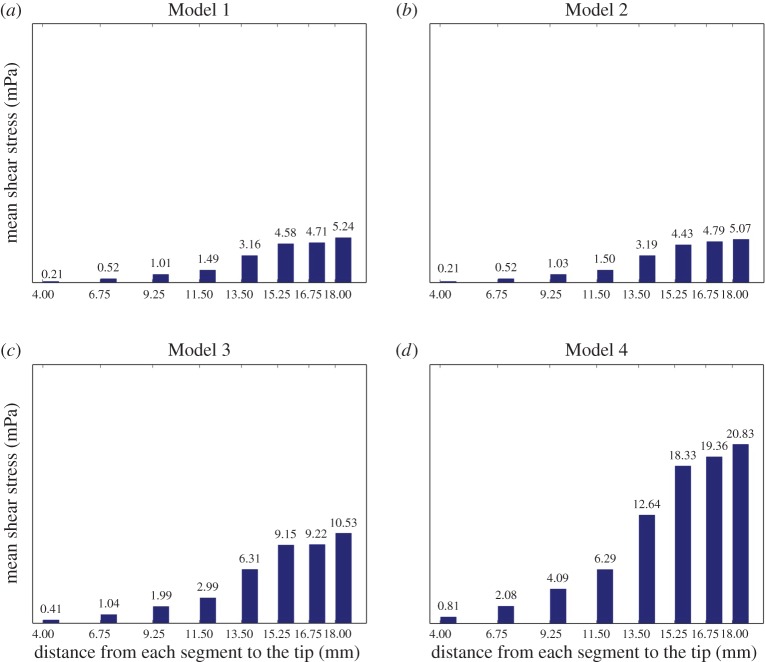
Mean shear stress distribution per segment on time average (in mPa). Bar diagrams (a–d) display the average in the second period (of 1 s) of the mean shear stress on the wall holes in each drainage segment corresponding to Models 1–4, respectively. (Online version in colour.)
Thus, figure 4 shows the time evolution of the flow rate for a selection of three drainage segments, namely, the two of them that have the highest and lowest flow rate (segments 3 and 8, respectively), along with a third segment having an intermediate flow rate (segment 6) (figure 1). This selection was made for a better visualization of the graphics.
A first conclusion when comparing Model 1 (steady flow model) with Model 2 (the pulsatile flow model with the same qbulk) in figure 4 is that the flow rate at each drainage segment of Model 2 oscillates around the steady flow rate at the corresponding drainage segment of Model 1. The same conclusion holds, of course, for Models 3 and 4 when comparing figure 4 with the results for a steady inlet flow with the corresponding rate q(t). Table 2 lists the amplitudes of the flow rates q(t) at the inlet (second column), at each of the eight drainage segments (intermediate columns), as well as the sum of the latter ones (last column) for the three pulsatile flow models. The amplitude was taken in the second interbeat period (of 1 s duration), i.e. between the first and the second heart beats, as the first interbeat period (up to t=1 s) is a transient period with a strong damping effect towards the limit periodic solution (a limit cycle). Indeed, the flow rates converge to their steady values already in the period 1≤t≤2.
Table 2.
Amplitudes of the inlet flow rates in cm3 d−1.
| inlet | S1 | S2 | S3 | S4 | S5 | S6 | S7 | S8 | |
|---|---|---|---|---|---|---|---|---|---|
| Model 2 | 20.005 | 1.341 | 2.452 | 2.974 | 3.093 | 3.103 | 3.144 | 2.679 | 2.569 |
| Model 3 | 40.01 | 2.63 | 4.845 | 5.908 | 6.201 | 6.205 | 6.404 | 5.228 | 5.225 |
| Model 4 | 80.02 | 5.074 | 9.455 | 11.703 | 12.279 | 12.435 | 12.819 | 10.675 | 10.527 |
Furthermore, the amplitude of the flow rate oscillations at each drainage segment increases with the amplitude of the inlet flow rate (see Models 2, 3 and 4 in figure 4).
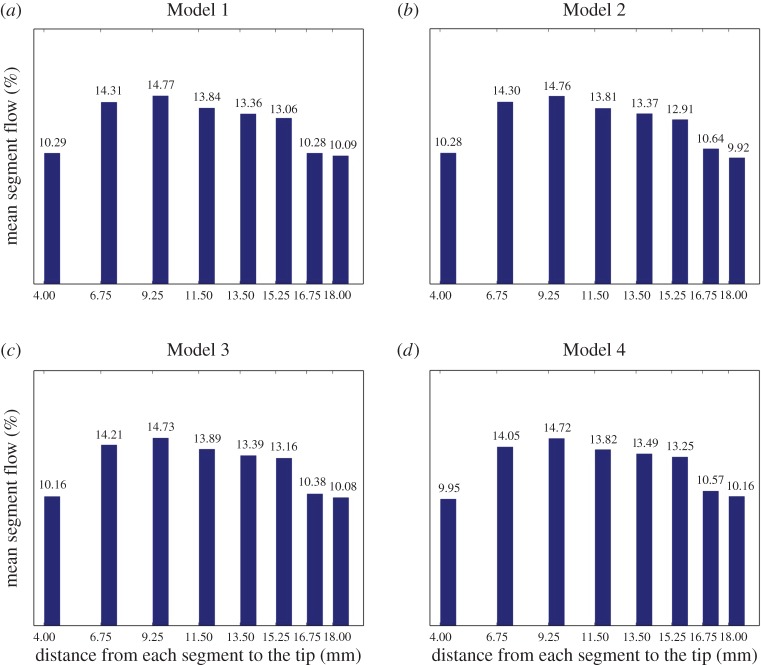
More revealing for our purposes is figure 5, which shows the percentage of CSF flow passing through each drainage segment during the second period. Importantly, this percentage remains invariant over all models, except for small, unavoidable fluctuations due to computational inaccuracy.
Figure 5.
Mean flow rate distribution per segment in per cent. Bar diagrams (a–d) display the average in the second period (of 1 s) of the flow rate per cent in each drainage segment corresponding to Models 1–4, respectively. (Online version in colour.)
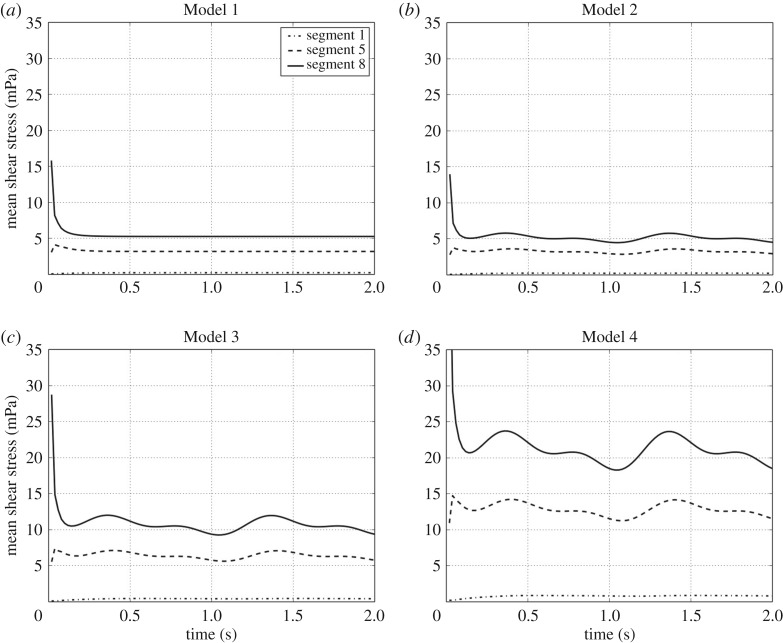
Figures 6 and 7 lead to similar conclusions with respect to the shear stress, the other fluid-mechanic property playing an important role in VC design. They show the time evolution of the mean shear stress and its time average over the second interbeat period at the eight different drainage segments, respectively. The shear stress was calculated on the walls of all holes of a given segment and then averaged to obtain the corresponding mean value. According to the plots in figure 6 for Models 1 and 2, the mean shear stress at each segment in the case of a pulsatile flow (Model 2) oscillates again around the value obtained for a steady inlet flow with the same rate q(t) (Model 2). The same conclusion translates mutatis mutandis to Models 3 and 4. In addition, figure 7 indicates that as the inlet flow increases, the shear stress also increases proportionally.
Figure 6.
Mean shear stress time evolution per segment (in mPa). (a–d) The periodic behaviour of the mean shear stress on the wall holes of some drainage segments corresponding to Models 1–4, respectively. For the sake of a better visualization, only the time evolution of the shear stress on the segments 1, 5 and 8 is shown; the shear stress evolution behaviour in the other segments is similar.
5. Discussion
The VCs used in shunt systems are exposed to many different conditions in clinical circumstances which are difficult to test experimentally. Among others, the ventricular pulsatile behaviour is a condition which needs to be incorporated in experimental set-ups in order to define optimal catheter flow and design, since a steady flow can only serve as a simplified, rather unrealistic, model for CSF diversion.
Briefly, the pulsatile flow within the CSF is the physiological condition which derives from the heart rate as well as the arterial blood pressure, which is transferred by the blood vessels and the brain tissue into the subarachnoid space and the ventricles. Under a pathological condition the pulse amplitude might be enlarged when the intracranial pressure is increased or the compliance is reduced [19]. This possibility enhances the relevance of investigating pulsatility of the CSF flow in VCs, and through the shunt system in general.
In our mathematical model, three different intensities of pulsatile flows are represented. As seen in the results, the flow rate distribution among the perforation holes in the catheter does not differ significantly under pulsatile conditions. However, the shear stress correlates positively with increased pulsatility. Since adhesion of small particles such as cells, debris or proteins is more likely to happen when the sheer stress is increased [10], this might indicate that pulsatility itself could be one promoting factor of particle adhesion to the catheter material. It has been shown that obstruction of VCs is at least partially initiated by adhesion of small particles to the material which then might lead to ingrowth of inflammatory cells and reactive tissue [27]. Given this, our data show that pulsatility must be further investigated in models of different catheter designs in order to better understand the flow within catheters.
Limitations of the model include the inherent complexity related to the pulsatile ventricle. Our model reproduces a simple cylinder rather than a complex anatomical lateral ventricle. Also, values related to volume, pressure and timing are not necessarily constant among study groups [18,19,28]. For example, pulsatility is not necessarily a free force in the CSF especially in conditions when the ventricles are small or in the case where the catheters are placed in close proximity to the ventricular wall. For this reason, it is also difficult to investigate different volumes of CSF which might cause different flow forces and pulsatility to the VC lumen and perforations. In these circumstances, particularly, it is important to mention the fact how precise VCs should be placed in the middle of the ventricle without contact to adjacent tissue. This situation is usually more difficult in cases with small ventricles compared those with large ones. In this context, the results given in this study disclosed that sheer stress is magnified in proximal catheter perforations compared with the more distal holes. We have shown in previous studies that the amount of catheter perforations might be better limited in order to place the holes exclusively inside the ventricle [29], which becomes more relevant in small ventricles. That might lead us to theoretically optimal conditions to limit the catheter perforations only to the tip of the catheter, thereby reducing the risk of perforations being close to the paraventricular tissue. However, the limitation of the catheter perforations should take into account the total drainage area (i.e. the sum of the cross sections of all the perforations) in order to keep the shear stress within an acceptable range. The difficulty of such an approach in daily neurosurgical practice was discussed in [14].
Further investigations will have to calculate this and other scenarios in order to be translated in further catheter designs to be tested. Diminishing the risk of catheter obstruction in shunted patients is the final purpose of these simulation studies.
6. Conclusion
The use of CFD to study the CSF circulation through a VC turns out to be a valuable tool to improve VC designs. Nevertheless, the CSF circulation has a very complex dynamics in which many factors are involved: ventricle shape and size, dynamics of the inlet flow, mechanical properties of the surrounding tissue, adhesion of particles in CSF, VC material or coating, etc. All this makes the dynamics of CSF extremely difficult to simulate under realistic conditions, thus calling for simplifications in the computational models to facilitate the task. However, we must take into consideration that further research including new features in the models could disclose new effects or variations with respect to the ones already stated. In particular, the introduction of pulsatile inlet flow could bring forth new results which could question the basic principles described in [14,15] for a steady inlet flow. This study confirms the validity of such studies, i.e. the principles of how the flow behaves when we vary the geometry of the catheter remain valid regardless of whether the inlet flow is pulsatile or steady, or whether the inlet mass flow is greater or lesser, of course, provided that the variation of the values are within a plausible data range.
Authors' contributions
All authors drafted, read and approved the manuscript.
Competing interests
The ventricular catheter modelled in this paper has been granted a Spanish patent [30].
Funding
J.M.A., A.G. and J.V. were supported by grant MTM2016-74921-P (AEI/FEDER, UE).
References
- 1.Cutler RW, Page L, Galicich J, Watters GV. 1968. Formation and absorption of cerebrospinal fluid in man. Brain 91, 707–720. ( 10.1093/brain/91.4.707) [DOI] [PubMed] [Google Scholar]
- 2.Milhorat TH. 1975. The third circulation revisited. J. Neurosurg. 42, 628–645. ( 10.3171/jns.1975.42.6.0628) [DOI] [PubMed] [Google Scholar]
- 3.Greitz D, Wirestam R, Franck A, Nordell B, Thomsen C, Ståhlberg F. 1992. Pulsatile brain movement and associated hydrodynamics studied by magnetic resonance phase imaging. The Monro-Kellie doctrine revisited. Neuroradiology 34, 370–380. ( 10.1007/BF00596493) [DOI] [PubMed] [Google Scholar]
- 4.Greitz D. 1993. Cerebrospinal fluid circulation and associated intracranial dynamics. A radiologic investigation using MR imaging and radionuclide cisternography. Acta Radiol. Suppl. 386, 1–23. [PubMed] [Google Scholar]
- 5.Brinker T, Stopa E, Morrison J, Klinge P. 2014. A new look at cerebrospinal fluid circulation. Fluids Barriers CNS 11, 10 ( 10.1186/2045-8118-11-10) [DOI] [PMC free article] [PubMed] [Google Scholar]
- 6.Lin J, Morris M, Olivero W, Boop F, Sanford RA. 2003. Computational and experimental study of proximal flow in ventricular catheters: technical note. J. Neurosurg. 99, 426–431. ( 10.3171/jns.2003.99.2.0426) [DOI] [PubMed] [Google Scholar]
- 7.Mukerji N, Cahill J, Rodrigues D, Prakash S, Strachan R. 2009. Flow dynamics in lumboperitoneal shunts and their implications in vivo. J. Neurosurg. 111, 632–637. ( 10.3171/2009.2.JNS08912) [DOI] [PubMed] [Google Scholar]
- 8.Harris CA, McAllister JP. 2012. What we should know about the cellular and tissue response causing catheter obstruction in the treatment of hydrocephalus. Neurosurgery 70, 1589–1601. ( 10.1227/NEU.0b013e318244695f) [DOI] [PubMed] [Google Scholar]
- 9.Cheatle JT, Bowder AN, Agrawal SK, Sather MD, Hellbusch LC. 2012. Flow characteristics of cerebrospinal fluid shunt tubing. J. Neurosurg. Pediatr. 9, 191–197. ( 10.3171/2011.11.PEDS11255) [DOI] [PubMed] [Google Scholar]
- 10.Harris CA, McAllister JP II. 2011. Does drainage hole size influence adhesion on ventricular catheters? Childs Nerv. Syst. 27, 1221–1232. ( 10.1007/s00381-011-1430-0) [DOI] [PubMed] [Google Scholar]
- 11.Galarza M, Giménez Á, Valero J, Pellicer O, Amigó JM. 2014. Computational fluid dynamics of ventricular catheters used for the treatment of hydrocephalus: a 3D analysis. Childs Nerv. Syst. 30, 105–116. ( 10.1007/s00381-013-2226-1) [DOI] [PubMed] [Google Scholar]
- 12.Galarza M, Giménez Á, Valero J, Pellicer O, Amigó JM. 2015. New designs of ventricular catheters for hydrocephalus by 3-D computational fluid dynamics. Childs Nerv. Syst. 31, 37–48. ( 10.1007/s00381-014-2477-5) [DOI] [PubMed] [Google Scholar]
- 13.Galarza M, Giménez Á, Valero J, Pellicer O, Martínez-Lage JF, Amigó JM. 2015. Basic cerebrospinal fluid flow patterns in ventricular catheters prototypes. Childs Nerv. Syst. 31, 873–884. ( 10.1007/s00381-015-2651-4) [DOI] [PubMed] [Google Scholar]
- 14.Galarza M, Giménez A, Pellicer O, Valero J, Amigó JM. 2016. Parametric study of ventricular catheters for hydrocephalus. Acta Neurochir. 158, 109–116. ( 10.1007/s00701-015-2618-y) [DOI] [PubMed] [Google Scholar]
- 15.Giménez Á, Galarza M, Pellicer O, Valero J, Amigó JM. 2016. Influence of the hole geometry on the flow distribution in ventricular catheters for hydrocephalus. Biomed. Eng. Online 15, 5–19. ( 10.1186/s12938-015-0116-3) [DOI] [PMC free article] [PubMed] [Google Scholar]
- 16.Egnor M, Rosiello A, Zheng L. 2001. A model of intracranial pulsations. Pediatr. Neurosurg. 35, 284–298. ( 10.1159/000050440) [DOI] [PubMed] [Google Scholar]
- 17.Egnor M, Zheng L, Rosiello A, Gutman F, Davis R. 2002. A model of pulsations in communicating hydrocephalus. Pediatr. Neurosurg. 36, 281–303. ( 10.1159/000063533) [DOI] [PubMed] [Google Scholar]
- 18.Linninger AA, Tsakiris C, Zhu DC, Xenos M, Roycewicz P, Danziger Z, Penn R. 2005. Pulsatile cerebrospinal fluid dynamics in the human brain. IEEE Trans. Biomed. Eng. 52, 557–565. ( 10.1109/TBME.2005.844021) [DOI] [PubMed] [Google Scholar]
- 19.Zhu DC, Xenos M, Linninger AA, Penn RD. 2006. Dynamics of lateral ventricle and cerebrospinal fluid in normal and hydrocephalic brains. J. Magn. Reson. Imaging 24, 756–770. ( 10.1002/jmri.20679) [DOI] [PubMed] [Google Scholar]
- 20.Linninger AA, Xenos M, Zhu DC, Somayaji MR, Kondapalli S, Penn RD. 2007. Cerebrospinal fluid flow in the normal and hydrocephalic human brain. IEEE Trans. Biomed. Eng. 54, 291–302. ( 10.1109/TBME.2006.886853) [DOI] [PubMed] [Google Scholar]
- 21.Tenti G, Sivaloganathan S, Drake JM. 2008. Mathematical modeling of the brain: principles and challenges. Neurosurgery 62, 1146–1157. ( 10.1227/01.neu.0000325877.67752.0f) [DOI] [PubMed] [Google Scholar]
- 22.Masoumii N, Bastani D, Najarian S, Farmanzad F, Seddighi AM. 2009. Cerebrospinal pulsation hydrodynamics in a 2D simulation of brain ventricles. Amirkabir Int. J. Elect. Electron. Eng. 41, 31–36. ( 10.22060/eej.2009.275) [DOI] [Google Scholar]
- 23.Ferziger JH, Peric M. 2013. Computational methods for fluid dynamics, 3rd edn Berlin, Germany: Springer. [Google Scholar]
- 24.Versteeg H, Malalasekra W. 2007. An introduction to computational fluid dynamics: the finite volume method, 2nd rev. edn. New York, NY: Prentice Hall. [Google Scholar]
- 25.Weisenberg SH, TerMaath SC, Seaver CE, Killeffer JA. 2016. Ventricular catheter development: past, present, and future. J. Neurosurg. 125, 1504–1512. ( 10.3171/2015.12.JNS151181) [DOI] [PubMed] [Google Scholar]
- 26.Medtronic Inc. 2006 Rivulet trademark. Serial no. 78887628.
- 27.Harris CA, Resau JH, Hudson EA, West RA, Moon C, McAllister JP II. 2010. Mechanical contributions to astrocyte adhesion using a novel in vitro model of catheter obstruction. Exp. Neurol. 222, 204–210. ( 10.1016/j.expneurol.2009.12.027) [DOI] [PubMed] [Google Scholar]
- 28.Wagshul ME, Chen JJ, Egnor MR, McCormack EJ, Roche PE. 2006. Amplitude and phase of cerebrospinal fluid pulsations: experimental studies and review of the literature. J. Neurosurg. 104, 810–819. ( 10.3171/jns.2006.104.5.810) [DOI] [PubMed] [Google Scholar]
- 29.Thomale UW, Hosch H, Koch A, Schulz M, Stoltenburg G, Haberl EJ, Sprung C. 2010. Perforation holes in ventricular catheters—is less more? Childs Nerv. Syst. 26, 781–789. ( 10.1007/s00381-009-1055-8) [DOI] [PubMed] [Google Scholar]
- 30.Spanish Patent. 2015 Catheter for hydrocephalus treatment. Patent no. 201400178.


