Abstract
In cancer bioassays, inhalation, but not drinking water exposure to ethyl tertiary‐butyl ether (ETBE), caused liver tumors in male rats, while tertiary‐butyl alcohol (TBA), an ETBE metabolite, caused kidney tumors in male rats following exposure via drinking water. To understand the contribution of ETBE and TBA kinetics under varying exposure scenarios to these tumor responses, a physiologically based pharmacokinetic model was developed based on a previously published model for methyl tertiary‐butyl ether, a structurally similar chemical, and verified against the literature and study report data. The model included ETBE and TBA binding to the male rat‐specific protein α2u–globulin, which plays a role in the ETBE and TBA kidney response observed in male rats. Metabolism of ETBE and TBA was described as a single, saturable pathway in the liver. The model predicted similar kidney AUC0–∞ for TBA for various exposure scenarios from ETBE and TBA cancer bioassays, supporting a male‐rat‐specific mode of action for TBA‐induced kidney tumors. The model also predicted nonlinear kinetics at ETBE inhalation exposure concentrations above ~2000 ppm, based on blood AUC0–∞ for ETBE and TBA. The shift from linear to nonlinear kinetics at exposure concentrations below the concentration associated with liver tumors in rats (5000 ppm) suggests the mode of action for liver tumors operates under nonlinear kinetics following chronic exposure and is not relevant for assessing human risk. Copyright © 2016 The Authors Journal of Applied Toxicology Published by John Wiley & Sons Ltd
Keywords: ethyl tertiary‐butyl ether, PBPK model, tertiary‐butyl alcohol, α2u–globulin nephropathy
Short abstract
Inhalation, but not drinking‐water exposure, to a high concentration of ethyl tertiary butyl ether was reported to cause liver tumors in male rats. Using a PBPK model for ethyl tertiary butyl ether and its metabolite tertiary butyl alcohol, under cancer bioassay exposure scenarios, showed a shift from linear to nonlinear kinetics at the exposure concentration associated with liver tumors. This suggests that a liver tumor mode of action that occurs under a high exposure concentration is not relevant for assessing human risk.
Introduction
Ethyl tertiary‐butyl ether (ETBE, CAS RN 637–92‐3) is used as a fuel oxygenate in unleaded gasoline to improve combustion efficiency, allowing the gasoline to burn more completely and thereby reducing exhaust emissions. The technical characteristics of ETBE suggest that it is comparable to methyl tertiary‐butyl ether (MTBE), a fuel oxygenate that had been more widely used until it was found to be mobile in groundwater. Based on concern for contamination of drinking‐water sources (Malveda et al., 2009), MTBE was removed from the US market. However, the much lower water solubility of ETBE (23.7 g l−1), compared to MTBE (42 g l−1), is considered an advantage, because its mobility in groundwater will be lower than that of MTBE in the event of leakage from an underground storage tank (McGregor, 2007).
In the past 15 years, ETBE has not been used significantly as a gasoline additive in the USA and Europe. The US Geological Survey (2006; USGS Circular, 1292) reported that ETBE was detected in less than 0.5% of public wells at concentrations of ~0.2 μg l−1, with less frequent detection in domestic wells. In Japan, ETBE‐blended gasoline has been used since 2007 (Eitaki et al., 2011). The maximum atmospheric concentration of ETBE in the general environment is estimated to be ~0.0091 ppm (JPEC, 2008a). Eitaki et al. (2011) reported that in Japan the geometric mean of 8 h time‐weighted average exposure (TWA‐8 h) to ETBE was 0.08 ppm (0.02–0.28 ppm) for 28 gas‐station workers and 0.04 ppm (0.01–0.21 ppm) in two gasoline tanker truck drivers. None of the examined workers had a TWA‐8 h exceeding the American Conference of Governmental Industrial Hygienists (ACGIH) threshold limit value (TLV) of 5 ppm, which was the threshold recommended by the ACGIH at the time the Eitaki et al. (2011) study was published. The current occupational ACGIH TLV established for ETBE is now 25 ppm (ACGIH, 2015), which is still significantly lower than the exposure concentrations used in animal toxicity and the cancer studies discussed below.
Considering that the metabolism of ETBE is similar in both rodents and humans and is mediated through cytochrome P450 oxidation to tertiary‐butyl alcohol (TBA) and acetaldehyde (McGregor, 2007), it is assumed that the internal dose metric may very well be the same in these two species. Cytochrome P450 metabolic oxidation is commonly associated with vulnerability to high‐dose metabolic saturation. Several lines of evidence support ETBE being metabolized by liver P450 enzymes in humans (CYP2A6) (Hong et al., 1999a; Le Gal et al., 2001) and rats (CYP2B1) (Turini et al., 1998) and a study in P450 2E1 knockout mice showed that this enzyme has a negligible contribution (Hong et al., 1999b). The two main metabolic products derived from the metabolism of ETBE's major metabolite, TBA, are 2‐methyl‐1,2‐propanediol and α‐hydroxyisobutyric acid (Bernauer et al., 1998), both of which have been detected in the urine of rats and humans exposed to ETBE (Amberg et al., 1999).
As with MTBE, ETBE is not considered genotoxic, nor is TBA, the major metabolite of both these chemicals (McGregor, 2007). ETBE has been found to be negative in bacterial mutation assays and chromosomal aberration assays in cultured mammalian cells (McGregor, 2007). It was also negative in two in vivo micronucleus assays, with one assay finding no micronucleus formation in the bone marrow following ETBE exposure of rats and mice via drinking water (Noguchi et al., 2013). However, two reliable ETBE cancer bioassays were conducted in male and female F344 rats via different routes of administration – inhalation (ETBE at 0, 400, 1500 and 5000 ppm, 6 h day−1, 5 days week−1 for 104 weeks) (Saito et al., 2013) and drinking‐water exposure (at estimated daily dose levels up to 560 mg kg−1 bodyweight (bw) day−1) (Suzuki et al., 2012). At the highest inhalation exposure concentration of 5000 ppm, male rats exhibited an increased incidence of hepatocellular adenomas (only one rat had a hepatocellular carcinoma), as well as an increased incidence of eosinophilic and basophilic cell foci, both of which are considered pre‐neoplastic lesions. No neoplastic lesions were observed in the chronic drinking‐water study, which was conducted at ETBE concentrations that resulted in estimated daily dose levels up to 560 mg kg−1 bw day−1 (Suzuki et al., 2012). In both the ETBE inhalation and drinking‐water chronic studies, there were increased severities of chronic progressive nephropathy in male and female rats, with an increase in urothelial hyperplasia of the renal pelvis and mineral deposition in the renal papilla in male rats exposed to the highest concentrations. In male Wistar rats initiated with N‐ethyl‐N‐(2‐hydroxyethyl)nitrosamine followed by oral gavage administration of ETBE at dose levels ranging from 0 to 1000 mg kg−1 bw day−1 for 19 weeks, hepatocellular adenomas were promoted only at the highest dose level of 1000 mg kg−1 bw day−1 (Hagiwara et al., 2015). In addition, chronic exposure to TBA, a major metabolite of ETBE, in drinking water resulted in renal tumors in male, but not female, rats (Cirvello et al., 1995; NTP, 1995). Study design information and summary results from all these cancer studies are provided in Table 1.
Table 1.
ETBE cancer study findings
| Reference | Species/ strain | Exposure | Non‐neoplastic and neoplastic lesions |
|---|---|---|---|
| Suzuki et al. (2012) | Rats/F344 | ETBE drinking water: 0, 625, 2500 or 10 000 ppm Males: 0, 28, 121, 542 mg kg−1 bw day−1 Females: 0, 46, 171, 560 mg kg−1 bw day−1 7 days week−1 for 104 weeks | Non‐neoplastic: Increase in severity of CPN at 10 000 ppm in male and female rats. Increased incidence of urothelial hyperplasia of the pelvis and mineral deposition in the renal papilla at ≥2500 ppm in male rats. Neoplastic: No increase in tumor incidence detected in any organ up to the highest daily dose, estimated to be 542–560 mg kg−1 bw day−1 |
| Saito et al. (2013) | Rats/F344 | ETBE inhalation: Males and females: 0, 500, 1500 or 5000 ppm Exposure 6 h day−1, 5 day week−1 Note: authors reported that exposure concentration of 5000 ppm corresponded to a daily uptake of 4222 mg kg−1 bw day−1 in rats, assuming a minute volume of 561 ml min−1 and lung absorption at 100%. However, this is an overestimate and assumes no exhalation of parent ETBE. | Non‐neoplastic: Increased incidence of eosinophilic and basophilic cell foci in male rats at 5000 ppm. Increase in severity of CPN at 5000 ppm in male and female rats. Increased incidence of urothelial hyperplasia of the pelvis at ≥1500 ppm and mineral deposition in the renal papilla at 5000 ppm in male rats. Neoplastic: Increased incidence of hepatocellular adenomas in male rats at 5000 ppm. |
| Hagiwara et al. (2015) | Rats/Wistar | Oral gavage: EHEN: 2 weeks initiation ETBE: 19 weeks promotion (0, 100, 300, 500 or 1000 mg kg−1 bw day−1, 5 days week−1 | Neoplastic: Increased incidence of hepatocellular adenomas and combined hepatocellular adenomas and carcinomas promoted with 1000 mg kg−1. Increased average number of atypical tubule hyperplasia (pre‐neoplastic lesion). |
| Cirvello et al. (1995); NTP (1995) | Rats/F344 | TBA drinking water: Males: 0, 1.25, 2.5 or 5 mg ml−1 (average daily doses 85, 195 or 420 mg kg−1 bw day−1) for 104 weeks. Females: 0, 2.5, 5 or 10 mg ml−1 (average daily doses 180, 330 or 650 mg kg−1 bw day−1) for 104 weeks. | Neoplastic: Increased incidence of renal tubule adenoma and carcinoma combined after extended evaluation in male rats at 2.5, but not 5 mg ml−1 concentration. Transitional epithelial hyperplasia (extended evaluation) of the kidney in male rats (25: 50, 32: 50, 36: 50, 40: 50 with increasing concentrations), with CPN severity ranging from 3.1 to 3.3, and in female rats (0: 50, 0: 50, 3: 50, 1: 50 with increasing concentrations), with CPN severity ranging from 1.6 to 2.9. |
CPN, chronic progressive nephropathy; EHEN, N‐ethyl‐N‐(2‐hydroxyethyl)nitrosamine; ETBE, ethyl tertiary‐butyl ether; TBA, tertiary‐butyl alcohol.
In a 90 day inhalation toxicity study carried out in male and female F344 rats at ETBE concentrations up to 5000 ppm, there was an increase in the liver weights in both male and female rats; in male rats only, there was a time‐ and concentration‐dependent increase in renal cell proliferation, along with increased protein droplet accumulation in the kidneys, with evidence of α2u–globulin immunoreactivity (Medinsky et al., 1999). TBA, a major metabolite of ETBE, has also been shown to cause α2u–globulin nephropathy following exposure in drinking water (NTP, 1995) and via inhalation (Borghoff et al., 2001; NTP, 1997) and has been shown to bind reversibly to α2u–globulin (Williams & Borghoff, 2001). Consequently, the changes in the kidney following ETBE exposure may be due in part to TBA.
Given these observations of kidney toxicity (ETBE and TBA), kidney tumors (TBA) and liver tumors (ETBE) in rats exposed to ETBE and TBA, this study aimed to elucidate how these responses are associated with the kinetics of ETBE and TBA under different exposure scenarios. To accomplish these goals, we developed a PBPK model that describes the kinetics of ETBE and its metabolite TBA in male and female rats, including the binding of both chemicals to α2u–globulin in the male rat kidney. Although, Salazar et al. (2015) has previously published an ETBE‐TBA PBPK model, this current model structure was developed based on the previously described PBPK model for MTBE and TBA (Leavens & Borghoff, 2009) and incorporates: (1) physiologic parameters with compiled literature values from Brown et al. (1997); (2) a description of ETBE and TBA binding to α2u–globulin; (3) induction of TBA metabolism following repeated exposures; and (4) a single oxidative pathway for ETBE. Data sets identified in the literature, as well as cited and available ETBE and TBA study reports, were used for the development and verification of this model.
Materials and methods
Data sets used for model development and verification
The studies and selected data sets used for model development and verification are listed in Table 2. If the data identified in peer‐reviewed publications were recalculated (i.e., units, background subtraction, etc.), the actual description of this recalculation for each data set is described in the Supporting information. If the data identified were from a cited study report, the study design, exposure and critical methods are described in the Supporting information, along with the actual data used for model verification. When available, the guidelines used to conduct the unpublished study reports were identified.
Table 2.
Data sets used for model development/verification and available in Supporting information
| Study type | Description of data collected | Summary of data sets available in Supporting information | Reference |
|---|---|---|---|
| Single IV dose of TBA (37.5, 75, 150 and 300 mg kg−1) to male and female F344 rats | TBA blood concentrations up to 24 h post‐dose administration | Data were captured from figures 1 and 2 of publication using Plot Digitizer version 2.6.3, http://plotdigitizer.sourceforge.net and converted from μm to mg l−1 using the molecular weight of TBA (74.12 g mol−1). | Poet et al., 1997 |
| Single oral gavage dose (1 or 500 mg kg−1 14C–TBA) to male SD rats | Equations reported for TBA equivalents in blood over time measured in blood/plasma at 0.5, 3, 6 and 12 h following administration | Data from the cited study (tables 11, 15 and figures 6 and 8) were extracted from this report and recalculated for use in the model based on the assumption that the distribution between blood and plasma =1. | ARCO Chemical Company (1983)* |
| Inhalation exposure to nominal TBA concentrations (250, 450 and 1750 ppm) for 6 h day−1 for 1 or 8 days to male and female F344 rats | TBA blood and kidney concentrations following a single 6 h exposure (1 day) at 2, 4 and 6 h post‐exposure | These data were available from conduct of the actual experiments and used in the MTBE‐TBA model. Ratio of the kidney/blood levels was calculated and data provided. | Leavens & Borghoff, 2009; Borghoff et al., 2001 |
| Inhalation exposure to ETBE nominal concentrations (4.0 or 40 ppm) for 4 h to male and female F344 rats | ETBE and TBA blood concentration at the end of the 4 h exposure, amount of TBA up to 34 h post‐exposure and cumulative metabolite excretion as percentage of dose. | ETBE and TBA blood concentrations from table 5 from the study cited. TBA blood concentrations from exposure were corrected for reported background concentrations. Urinary amounts of TBA (mean ± SD) versus post‐exposure time were digitized from figure 4 from the study cited and corrected for background amount per sample based on the mean total background amount reported in table 5 of the study cited and the number of sample points (5). Corrected cumulative amount or TBA per time was calculated from the amount in urine at each post‐exposure time point. | Amberg et al., 2000 |
| Single oral gavage dose (5 and 400 mg kg−1 bw [14C]‐ETBE) SD rats | Plasma and urine samples collected up to 168 h post‐administration. Metabolites in plasma and urine were analyzed to examine chemical structures. Metabolite P5 was identified as TBA. | Concentration of TBA in blood was calculated from total radioactivity in blood following administration of 14C–ETBE, and the amount of TBA identified in the sample by HPLC at 8 h post‐administration of 5 or 400 mg kg−1 bw. At the 24 h urine collection, a combination of the total radioactivity in the samples and the % of the radioactivity determined to be TBA was used to calculate the total mg of TBA. | Japan Petroleum Energy Center (JPEC) (2008b)a |
| Repeated (14 days) oral gavage dose (5 mg kg−1 bw day−1 [14C]‐ETBE) SD rats | Plasma and urine samples collected at 7 and 14 days post‐administration. Metabolites in plasma and urine were analyzed to examine chemical structures. Metabolite P5 was identified as TBA. | Concentration of TBA in blood was calculated from total radioactivity in blood following administration of 14C–ETBE and the amount of TBA identified in the sample by HPLC at 8 h post‐administration of 5 or 400 mg kg−1. At the 24 h urine collection, a combination of the total radioactivity in the samples and the % of the radioactivity determined to be TBA was used to calculate the total mg of TBA. | Japan Petroleum Energy Center (JPEC) (2008c)a |
| Single (nose only) and repeated (14 days) (whole body, 13 days/nose only, 1 day) inhalation exposure (500, 1750 and 5000 ppm) – 14C‐ETBE‐F344 rats | Exhaled breath samples collected up to 16 h post‐exposure to ETBE for a single day. ETBE and TBA were quantitated in samples collected. % of the total dose eliminated in urine and exhaled was also provided. | Cumulative amount of ETBE and TBA exhaled or eliminated in urine was calculated from the level quantitated at each time point collected. | Borghoff and Asgharian (1996)a |
ETBE, ethyl tertiary‐butyl ether; MTBE, methyl tertiary‐butyl ether; SD rats, Sprague–Dawley (rats); TBA, tertiary‐butyl alcohol.
Experimental design, methods and data sets used for model development and verification are presented in Supporting information.
Chemicals
For all studies, the source of ETBE and TBA is identified in the peer‐reviewed publication or, in the case of study reports, in the Supporting information.
PBPK model for ETBE‐TBA
This ETBE‐TBA PBPK model structure was based on the MTBE‐TBA model published by Leavens and Borghoff (2009) with minor modifications (Fig. 1). The parameter values used in this ETBE‐TBA PBPK model (Fig. 1) are listed in Table 3. The compartments in this ETBE‐TBA model included fat, gastrointestinal, kidney, liver, poorly perfused tissues and rapidly perfused tissues. Borghoff et al. (2010) provided data to show that there was little kinetic difference among Sprague–Dawley and F344 rats administered MTBE via oral gavage; therefore, the assumption of no significant strain‐specific differences in physiological or biochemical parameters was used for ETBE. The physiologic parameters were set to mean values reported for rats by Brown et al. (1997), except for alveolar ventilation, where the lower limit reported by these authors was used in this model to improve the fit to the data, and body weights were set to gender‐ and study‐specific values for the respective data sets. The volume of fat was calculated according to the empirical relationship for the F344 rat given in Brown et al. (1997). The metabolism of both ETBE and TBA was assumed the same in male rats as in female rats. In a change from the MTBE model, the metabolism of ETBE to TBA was modeled in the liver as Michaelis–Menten kinetics via one pathway rather than two, a model supported by selected in vitro studies (Hong et al., 1999a, 1999b; Le Gal et al., 2001; Turini et al., 1998). The V max and K m for the low‐affinity, high‐capacity pathway of MTBE metabolism were used for the single metabolic pathway for ETBE.
Figure 1.
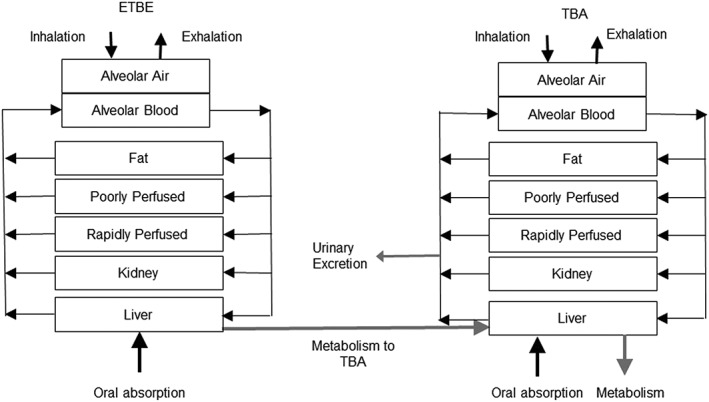
Schematic of the PBPK model for ETBE and its metabolite TBA in rats was adapted from Leavens and Borghoff (2009). Model equations, along with the schematic for the description of ETBE and TBA binding to α2u–globulin in the male rat kidney is described in Leavens and Borghoff (2009). Biochemical and physiological parameters and respective values are presented in Table 3. ETBE, ethyl tertiary‐butyl ether; TBA, tertiary‐butyl alcohol.
Table 3.
Model parameters
| Parameter | Description | Value | Units | Source | ||
|---|---|---|---|---|---|---|
| Qpc | Alveolar ventilation | 18.9a | l h−1 kg−1 | Brown et al. (1997) | ||
| Rv : co | Ventilation–perfusion ratio | 1.0 | Unitless | Calculated from Borghoff et al. (1996) | ||
| Compartment volumesb | ||||||
| BW | Body weight | 0.14–0.24 | kg | Measured | ||
| FVblood | Fraction of body weight as blood | 0.074 | Unitless | Brown et al. (1997) | ||
| FVf | Fraction of body weight as fat | 0.35·bw + 0.00205 | Unitless | Brown et al. (1997) | ||
| FVk | Fraction of body weight as kidney | 0.0073 | Unitless | Brown et al. (1997) | ||
| FVk | Fraction of kidney as blood | 0.16 | Unitless | Brown et al. (1997) | ||
| FVl | Fraction of body weight as liver | 0.037 | Unitless | Brown et al. (1997) | ||
|
|
Total fraction of body weight that is poorly perfused tissuesc | 0.757 | Unitless | Brown et al. (1997) | ||
| FVpp |
|
0.755–0.35·bw | Unitless | Brown et al. (1997) | ||
|
|
Total fraction of body weight that is richly perfused tissuesd | 0.165 | Unitless | Brown et al. (1997) | ||
| FVrp |
|
0.046 | Unitless | Brown et al. (1997) | ||
| FVrob | Fraction of rest of bodye | 0.078 | Unitless | Brown et al. (1997) | ||
| Blood flowsf | ||||||
| Qcc | Cardiac index | Qpc/Rv : co | l h−1 kg−1 | Calculated | ||
| FQf | Fraction cardiac output to fat | 0.07 | Unitless | Brown et al. (1997) | ||
| FQl | Fraction cardiac output to liver (hepatic and portal) | 0.174 | Unitless | Brown et al. (1997) | ||
| FQk | Fraction cardiac output to kidney | 0.14 | Unitless | Brown et al. (1997) | ||
|
|
Fraction cardiac output to poorly perfused tissues | 0.53 | Unitless | Brown et al. (1997) | ||
| FQpp |
|
0.46 | Unitless | Brown et al. (1997) | ||
|
|
Fraction cardiac output to richly perfused tissues | 0.47g | Unitless | Brown et al. (1997) | ||
| FQrp |
|
0.157 | Unitless | Brown et al. (1997) | ||
| Mass transfer coefficients | ||||||
|
|
ETBE blood/air partition coefficient | 11.6 | Unitless | Kaneko et al. (2000) | ||
|
|
ETBE fat/blood partition coefficient | 11.7 | Unitless | Kaneko et al. (2000) | ||
|
|
ETBE kidney/blood partition coefficient | 2.9h | Unitless | Kaneko et al. (2000) | ||
|
|
ETBE liver/blood partition coefficient | 2.9 | Unitless | Kaneko et al. (2000) | ||
|
|
ETBE poorly perfused/blood partition coefficient | 1.9 | Unitless | Kaneko et al. (2000); set equal to muscle | ||
|
|
ETBE richly perfused/blood partition coefficient | 2.9 | Unitless | Set equal to richly perfused | ||
|
|
TBA blood/air partition coefficient | 481 | Unitless | Borghoff et al. (1996) | ||
|
|
TBA fat/blood partition coefficient | 0.40 | Unitless | Borghoff et al. (1996) | ||
|
|
TBA kidney/blood partition coefficient | 0.83 | Unitless | Borghoff et al. (1996) | ||
|
|
TBA liver/blood partition coefficient | 0.83 | Unitless | Borghoff et al. (1996) | ||
|
|
TBA poorly perfused/blood partition coefficient | 1.0 | Unitless | Borghoff et al. (1996) | ||
|
|
TBA richly perfused/blood partition coefficient | 0.83 | Unitless | Set equal to liver | ||
|
|
ETBE first order absorption constant | 1.6 | h−1 | Leavens and Borghoff (2009) for MTBE | ||
|
|
TBA first order absorption constant | 5.0 | h−1 | Salazar et al. (2015) | ||
|
|
Fraction of TBA absorbed in alveolar region | 0.6 | Unitless | Medinsky et al. (1993) | ||
|
|
Urinary clearance of TBA | 0.015 | l h−1 kg–0 .75 | Estimated | ||
| Metabolic parameters | ||||||
|
|
Scaled maximum metabolic rate of ETBE | 499 | μmol h−1 kg–0 .75 | Rao and Ginsberg (1997) | ||
|
|
Michelis–Menten constant for ETBE | 1248 | μmol l−1 | Rao and Ginsberg (1997) | ||
|
|
Scaled maximum metabolic rate of TBA | 54 | μmol h−1 kg−1 | Borghoff et al. (1996); Rao and Ginsberg (1997) | ||
|
|
Michelis–Menten constant for ETBE | 379 | μmol l−1 | Borghoff et al. (1996); Rao and Ginsberg (1997) | ||
|
|
Maximum percentage increase in | 124.9 | unitless | Leavens and Borghoff (2009) | ||
|
|
Rate constant for ascent to | 0.3977 | day−1 | Leavens and Borghoff (2009) | ||
| α2u–globulin binding parameters | ||||||
|
|
Steady‐state concentration of free α2u–globulin in kidney | 550i | μmol l−1 | Leavens and Borghoff (2009) | ||
|
|
First order rate constant for hydrolysis of free α2u–globulin | 0.32 | h−1 | Leavens and Borghoff (2009) | ||
|
|
First order rate constant for hydrolysis of bound α2u–globulin | 0.11 | h−1 | Leavens and Borghoff (2009) | ||
|
|
Second order binding rate constant for TBA to α2u–globulin | 1.3 | l μmol− 1 h−1 | Leavens and Borghoff (2009) | ||
|
|
α2u–globulin dissociation constant for TBA | 120 | μmol l−1 | Leavens and Borghoff (2009) | ||
|
|
First order rate constant for unbinding of TBA from α2u–globulin |
|
h−1 | |||
|
|
Second order binding rate constant for ETBE to α2u–globulin | 0.15 | l μmol− 1 h−1 | Leavens and Borghoff (2009) | ||
|
|
α2u–globulin dissociation constant for ETBE | 1 | μmol l−1 | Leavens and Borghoff (2009) | ||
|
|
First order rate constant for unbinding of ETBE from α2u–globulin |
|
h−1 | Leavens and Borghoff (2009) | ||
ETBE, ethyl tertiary‐butyl ether; MTBE, methyl tertiary‐butyl ether; TBA, tertiary‐butyl alcohol.
Lower limit of of alveolar ventilation values for rat reported in Brown et al. (1997).
Total volume of the body weight of the rat was divided fractionally as follows:
Poorly perfused tissues were defined as those having relative flow rates <100 ml min−1 100 g, including muscle, skin, fat and bone.
Richly perfused tissues were defined as those having relative flow rates of ≥100 ml min−1 100 g, including adrenal, blood , brain, gastrointestinal tissues, heart, kidney, liver, lungs and thyroid.
Rest of body not perfused, including gut contents, hair, nails and urine.
Total cardiac output was divided between the total richly perfused and poorly perfused:
Brown et al. (1997) only accounted for 94% of cardiac output for fraction of flows. For this model, the unaccounted 6% was assumed to be in the richly perfused tissues.
ETBE kidney/blood ratio measured in male rats was reported to be 11 (Kaneko et al., 2000). For a rapidly perfused tissue, this is a high value that suggests that uptake into this tissue is most likely dependent on solubility and an active process such as binding, which was the case for MTBE by Poet and Borghoff (1997). As such, the partition coefficient in kidney was set to rapidly perfused tissues and binding of ETBE to α2u–globulin described within the male, but not female rat kidney.
The metabolism of TBA, as described in the Leavens and Borghoff (2009) model, was a single, low‐affinity pathway, inducible following repeated exposures. Values for the metabolic parameters for both ETBE and TBA metabolism were taken from Leavens and Borghoff (2009). The MTBE‐TBA model included urinary clearance of TBA, but it was modeled as a first‐order elimination rate from the kidney venous blood. For the ETBE‐TBA model, the model structure for urinary elimination was changed to a clearance rate from the central venous blood. The distribution of both ETBE and TBA was assumed to be blood‐flow limited, except in the kidney, where binding to α2u–globulin was simulated in the tissue.
For TBA, the blood/air and tissue/blood partition coefficients (PCs) were taken from Borghoff et al. (1996); for ETBE, the blood/air and tissue/blood PCs were those reported by Kaneko et al. (2000), except for the ETBE kidney/blood PC. Kaneko et al. (2000) showed a higher ETBE kidney/blood PC compared to liver/blood PC, suggesting that factors other than solubility were involved in the uptake of ETBE into the male rat kidney. A high kidney/blood PC compared to liver has been demonstrated for MTBE, a chemical that is structurally similar to ETBE and is shown to bind directly to α2u–globulin (Borghoff et al., 1996; Poet et al., 1997). Poet et al. (1997) demonstrated that the PC in the female rat kidney is very similar to the liver, which was not the case for the male rat kidney. Further analysis demonstrated that the increased uptake of MTBE into the male rat kidney was due to binding to α2u–globulin. Unlike MTBE, there is no direct evidence for ETBE binding to the male‐rat‐specific protein α2u–globulin. However, there is indirect evidence – including evidence that ETBE causes α2u–globulin accumulation in the male rat kidney following inhalation exposure to ETBE (Medinsky et al., 1999), as well as the reported high male rat kidney/air PC (Kaneko et al., 2000) – suggesting that, besides solubility in the male rat kidney, there is another process affecting the uptake of ETBE into the tissue. Based on this specific information on MTBE, which is structurally similar to ETBE, along with the fact that other chemicals such as methanol, ethanol, 2‐propanol and 2‐methyl‐2 propanol have similar PCs in the liver and kidney (Meulenberg & Viverberg, 2000), assigning the same value to the kidney/blood PC and the liver/blood PC is warranted. As far as TBA binding to α2u–globulin, there is evidence in the literature to support this description (Williams & Borghoff, 2001).
Given this evidence, the model included a description of both ETBE and TBA binding to α2u–globulin in the male rat kidney, identical to that used previously for MTBE‐TBA (Leavens & Borghoff, 2009). The schematic for this sub‐model, as well as the equations used, are as described by Leavens and Borghoff (2009). The same parameter values reported previously for MTBE were used for ETBE, keeping the TBA parameter values (Table 3) the same as those reported in Leavens and Borghoff (2009).
For simulations of drinking‐water exposure to either ETBE or TBA, the estimated daily dose (mg kg−1 bw day−1) was used with the animal body weight to calculate a constant infusion rate (mg h−1) into the gut lumen over a 12 h simulation period. The absorption from the lumen compartment was modeled identically for oral gavage of ETBE and TBA.
Model simulations and parameter estimation
The model was coded in acslXtreme® software (currently not commercially available; originally from AEgis Technologies Group, Huntsville, AL, USA). As described in “PBPK model for ETBE‐TBA,” the structure of the model (Fig. 1) and the parameters (Table 3) were taken from previous modeling for MTBE, due to the similarity in chemical structure (see Leavens & Borghoff, 2009, for model equations and more detailed model structure description). One parameter that was estimated for this model was the urinary clearance of TBA from the central venous blood. The value for Clurinary was estimated by visually comparing the model with plasma concentration of TBA after intravenous (IV) administration in rats (Poet et al., 1997).
Model evaluation and comparison
For a quantitative measure of the goodness of fit, the sum of squares of the standard error (SSE) of model predictions versus experimental data was used. For comparison, the SSE was calculated for both the current model and for a previously published PBPK model for ETBE (Salazar et al., 2015). The model code used for the Salazar et al. (2015) model was available in the HERO database (hero.epa.gov, accessed June 24, 2016). The quantitative goodness of fit measure was calculated using the following formula: in Excel (version 2013).
Results
The TBA sub‐model (Fig. 1) in this model for ETBE was adapted from previous modeling efforts for MTBE (Leavens & Borghoff, 2009), which presented model comparisons against data from single and repeated inhalation studies to TBA. One change from the previously published model was how urinary elimination was expressed, from a first‐order rate constant from the kidney venous blood to a clearance rate from the central venous blood. This allowed for more direct comparison of the scaled urinary clearance with the scaled metabolic clearance. TBA urinary clearance of 0.015 l h−1 kg–0 .75 was determined by visual comparison of model simulations versus measured data for TBA blood concentration in rats (Fig. 2A,B, for male and female rats, respectively) following a single IV administration of TBA at dose levels ranging from 37.5 to 300 mg kg−1 bw (Table 2; Supporting information; Poet et al., 1997). The value was chosen so that the simulations fell within the majority of the standard deviations of measured concentrations at each time point. As seen in Fig. 3, the change in the model structure for urinary elimination of TBA did not affect the model's ability to adequately simulate TBA blood concentrations in male (Fig. 3A) and female (Fig. 3B) rats following inhalation exposure, which was simulated previously in Leavens and Borghoff (2009).
Figure 2.
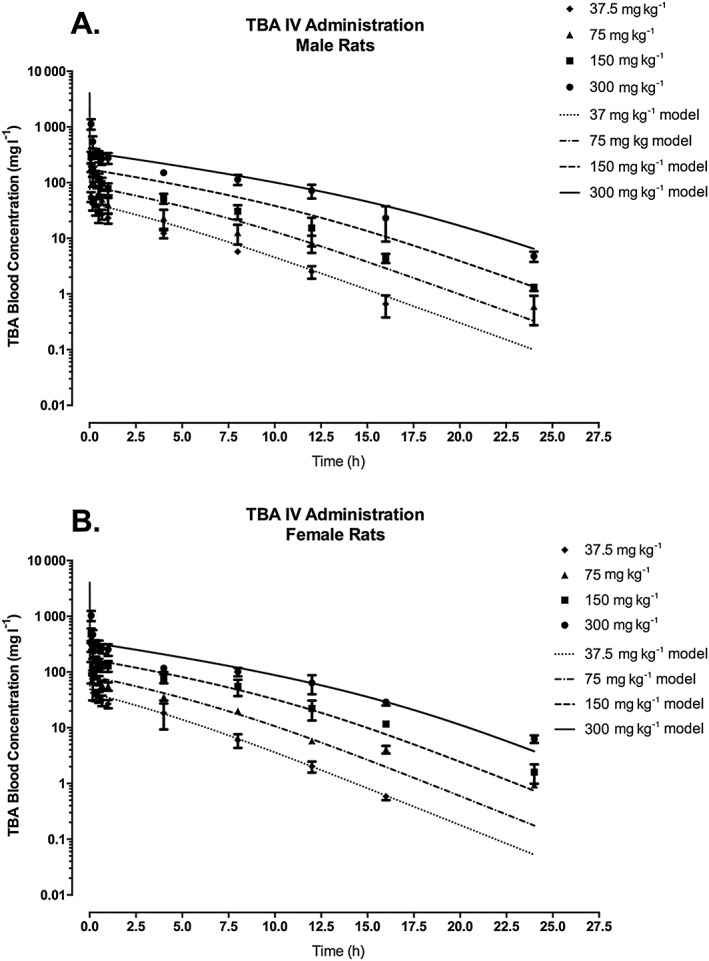
TBA blood concentration in male (A) and female (B) F344 rats following a single IV administration of TBA at dose levels of 37.5, 75, 150 or 300 mg kg−1 bw. Symbols represent the mean ± SD of the actual data collected (Poet et al., 1997; see Table 2 and Supporting information) with model simulations (lines) based on model parameter values provided in Table 3. IV, intravenous; TBA, tertiary‐butyl alcohol.
Figure 3.
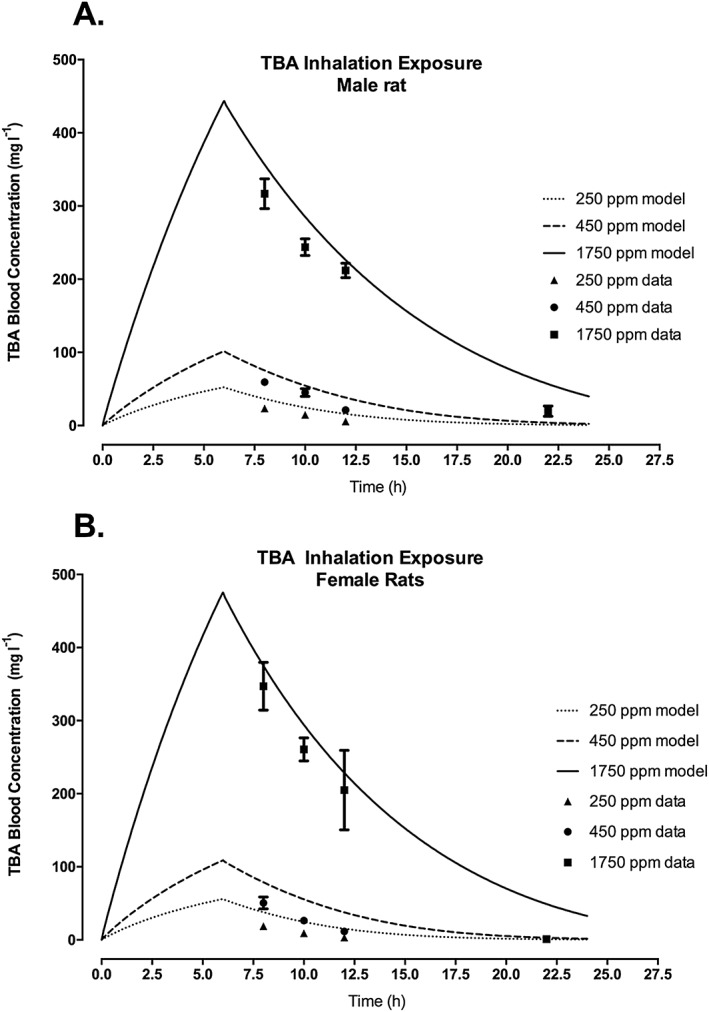
TBA blood concentration in male (A) and female (B) F344 rats following inhalation exposure of TBA at nominal concentrations of 250, 450 or 1750 ppm. Symbols represent the actual data collected (Leavens & Borghoff, 2009; see Table 2 and Supporting information), with model simulations (lines) based on model parameter values provided in Table 3. TBA, tertiary‐butyl alcohol.
To provide an additional assessment of the TBA sub‐model's ability to predict the in vivo kinetics of TBA, simulations were compared with oral gavage in rats from a study conducted by ARCO (1983) (Table 2; Supporting information) in which the toxicokinetics of TBA were evaluated following oral, inhalation or IV administration of 14C–TBA. The majority of the data reported in the study could not be used for modeling purposes, because blood and urine concentrations were reported either as a percentage of administered dose or as equivalents of TBA, which are not specific for TBA alone but include TBA and its metabolites. However, there were data from two oral experiments that, when merged, included adequate information to estimate blood concentrations of TBA following a single oral gavage of 1 or 500 mg kg−1 bw 14C–TBA (see Supporting information; Table 2). The TBA model was able to predict TBA blood levels following a very low TBA dose of 1 mg kg−1 bw (Fig. 4), but over‐predicted blood levels of TBA following a 500 mg kg−1 bw dose. The increase in blood TBA concentrations following the 500 mg kg−1 bw dose compared with the 1 mg kg−1 bw dose was less than would be predicted for either nonsaturable or saturable kinetics; therefore, there is uncertainty in the estimated blood concentrations from the ARCO study. Because the study report did not give information on potential differences in radioactivity in blood versus plasma, calculations of the blood concentrations of TBA from the study data assumed that the percentage radioactivity attributable to TBA would be the same in blood as in plasma; this assumption may not be accurate if there are significant differences in partitioning into blood cells between TBA and its metabolites. In addition, the total radioactivity in the plasma was not accounted for in the plasma samples in which TBA was separated from the metabolites. The ARCO report also noted loss of volatile radioactive species during analysis of urine samples, which may also have affected results of the blood and plasma samples.
Figure 4.
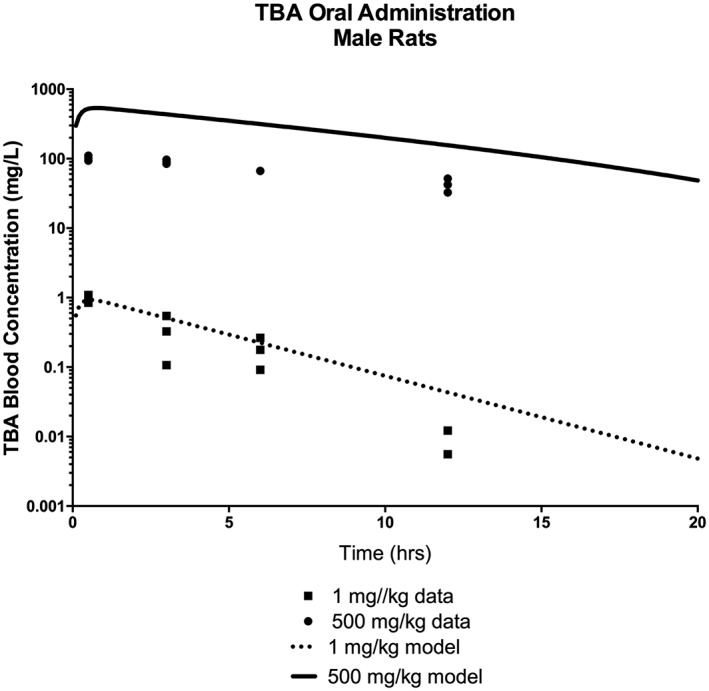
TBA blood concentration in male Sprague–Dawley rats following a single oral administration of 14C‐TBA at dose levels of 1 or 500 mg kg−1 bw. Symbols represent the actual data collected (ARCO, 1983; see Table 2 and Supporting information), with model simulations (lines) based on model parameter values provided in Table 3. TBA, tertiary‐butyl alcohol.
To evaluate the ETBE‐TBA PBPK model (Fig. 1), along with the literature values for physiological and biochemical parameters as identified in Table 3, the model was used to simulate studies that measured ETBE and TBA concentrations in various matrices, including blood, urine and exhaled breath, following ETBE oral administration and inhalation exposure (see Supporting information). As seen in Figs 6‐8 and 9, only very limited time‐course data are available for either ETBE or TBA during or following ETBE exposures. For a 14C–ETBE oral gavage study reported by JPEC (2008b), the model was able to predict the concentration of TBA in blood with time post‐administration at either 400 or 5 mg kg−1 bw (Fig. 5A); however; the model over‐predicted the cumulative TBA in the urine measured at 24 h post‐administration at both dose levels (Fig. 5B). The model predicted urinary concentrations following inhalation exposure to 40 ppm ETBE (Amberg et al., 2000) (Fig. 6C), although the predictions of the TBA blood concentrations after inhalation exposure (Fig. 6B) were not as close to the observed data as for oral gavage (compare Fig. 5A). The ETBE blood concentrations were well‐predicted for the 4 ppm ETBE exposure (Fig. 6A), but over‐predicted for 40 ppm.
Figure 5.
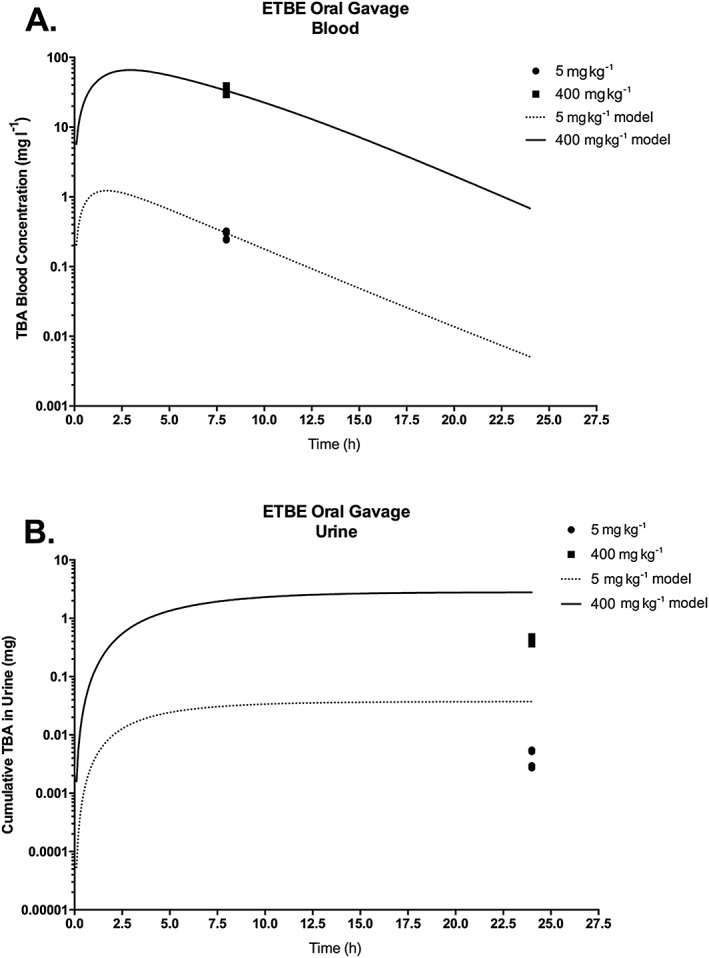
TBA blood concentration (A) and cumulative amount of TBA in urine (B) in male rats orally administered a single dose of 14C–ETBE (5 or 400 mg kg−1 bw). Symbols represent the actual data collected (JPEC, 2008b; see Table 2 and Supporting information), with model simulations (lines) based on model parameter values provided in Table 3. ETBE, ethyl tertiary‐butyl ether; TBA, tertiary‐butyl alcohol.
Figure 6.
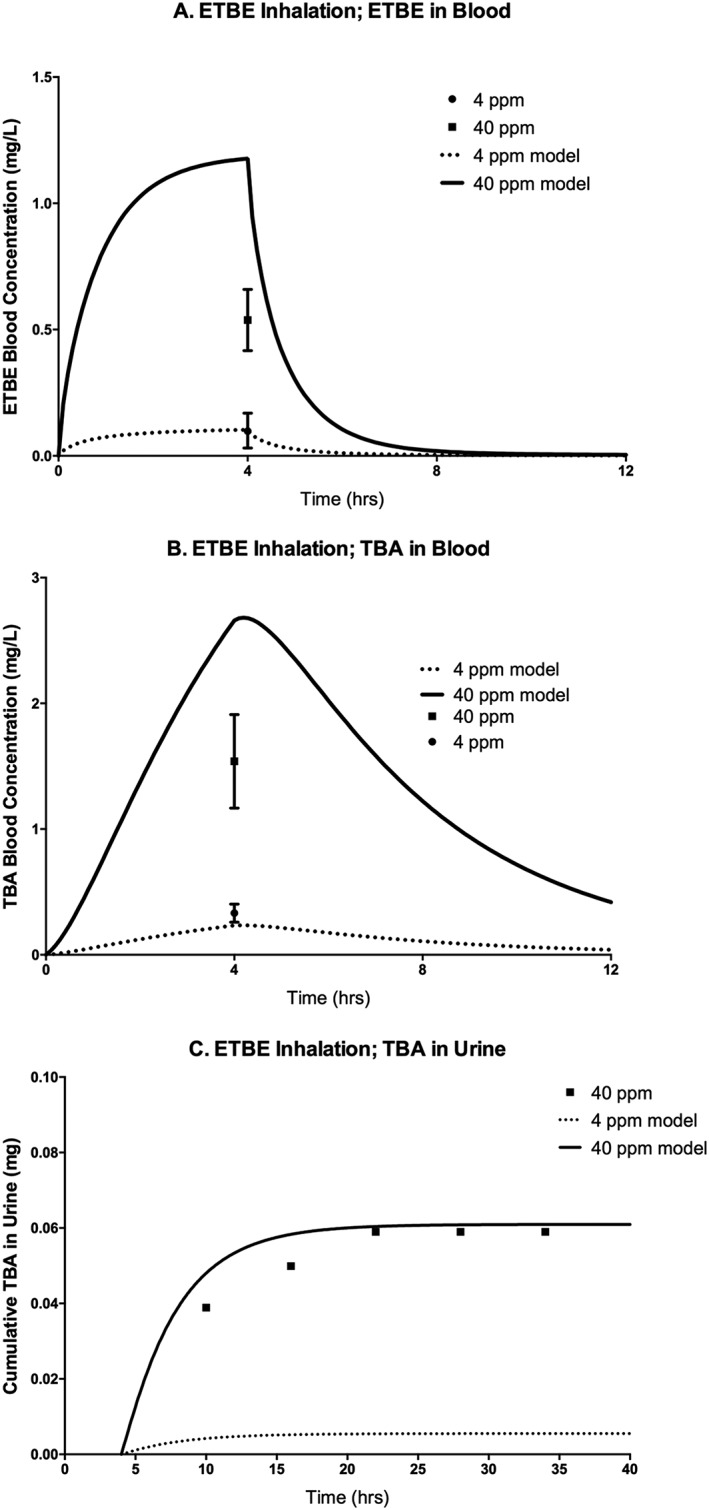
ETBE blood concentration (A), TBA blood concentration (B), and cumulative amount of TBA in urine (C) of F344 rats exposed to 4 or 40 ppm (nominal concentrations) ETBE following a single 4 h inhalation exposure. Symbols represent mean ± SD of the actual data collected (Amberg et al., 2000; see Table 2 and Supporting information), with model simulations (lines) based on model parameter values provided in Table 3. ETBE, ethyl tertiary‐butyl ether; TBA, tertiary‐butyl alcohol.
The model was also compared to data from a repeat exposure study (Fig. 7) in which 14C–ETBE was administered by oral gavage to rats at 5 mg kg−1 bw day−1 orally for 14 days, and TBA blood concentrations were measured 8 h after the seventh and 14th doses (JPEC, 2008c). The measured TBA blood concentration was higher at 8 h post‐exposure after repeated dosing than at 8 h following a single dose (JPEC, 2008b), due to accumulation. However, because the model included induction of TBA metabolism following repeat exposure, which decreases the half‐life of TBA, the predicted blood concentrations of TBA are similar at 8 h following the repeat doses and the single dose. Therefore, the model under‐predicted TBA blood concentrations after 7 and 14 days of repeat dosing (Fig. 7). As shown in Salazar et al. (2015), TBA blood concentrations after repeated exposures can be better predicted by a model that does not assume metabolic induction with repeated exposure to ETBE. For further evaluation, the model was also used to simulate the percentages of dose either exhaled or excreted in urine, for comparison with data from studies reported in the literature and available study reports (Fig. 8). The model simulated the trend of an increase in percentage exhaled and a decrease in percentage excreted in urine with an increase in dose (Fig. 8A) following a single oral gavage of 14C–ETBE (JPEC, 2008b) and the model also accurately simulated the percentage of dose excreted in the urine (Fig. 8B) following both 4 and 40 ppm ETBE inhalation exposures (Amberg et al., 2000). In another study in which rats were exposed by nose‐only inhalation to 14C–ETBE at 500, 1750 or 5000 ppm (Borghoff & Asgharian, 1996), the model simulated the increase in the percentage of dose exhaled and the decrease in the percentage of dose excreted in urine with increasing exposure concentrations for both male (Fig. 8C) and female (Fig. 8D) rats. When the composition of the exhaled breath was analyzed for ETBE and TBA, the model predicted the cumulative amount of ETBE exhaled over time in female rats (Fig. 9A), but over‐predicted the cumulative amounts of ETBE exhaled in male rats and the TBA exhaled in male and female rats, respectively (Fig. 9B–D). In contrast to the model‐predicted blood concentrations of ETBE and TBA, the model‐predicted cumulative exhaled amounts of ETBE and TBA were greater in the male versus female rat. This is due to the greater absolute ventilation in the male rat due to greater body weight. In the model, the exhaled amounts or ETBE and TBA are estimated according to the equation:
Figure 7.
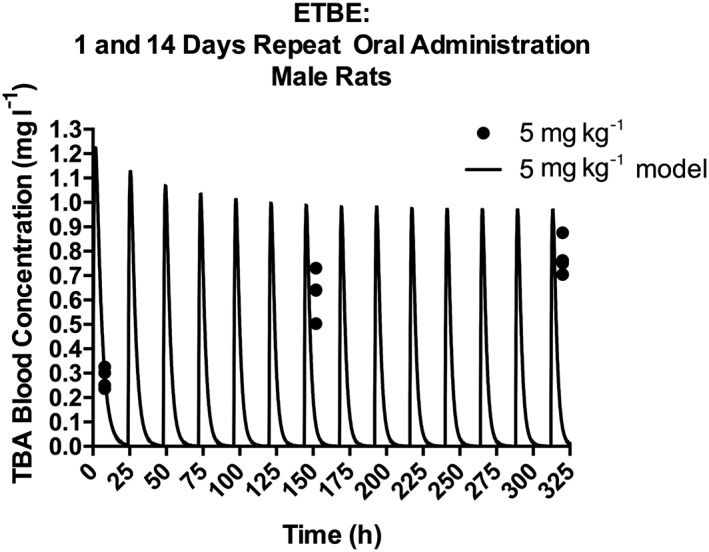
TBA blood concentration in male Sprague–Dawley rats orally administered 5 mg kg−1 bw day−1 14CETBE for 1 or 14 days. Symbols represent the actual data collected 8 h following dosing on days 1, 7 and 14 (JPEC, 2008a, 2008b; see Table 2 and Supporting information), with model simulations (lines) based on model parameter values provided in Table 3. ETBE, ethyl tertiary‐butyl ether; TBA, tertiary‐butyl alcohol.
Figure 8.
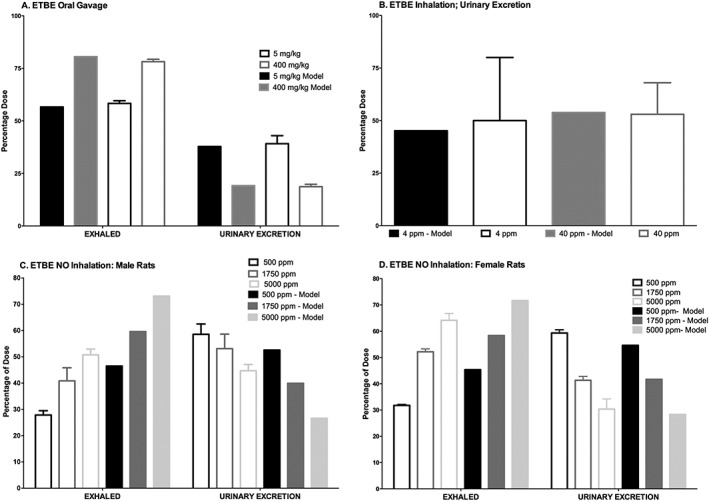
Percentage of dose exhaled or excreted in urine, (A) following a single oral dose (5 or 4000 mg kg−1) of 14C–ETBE to male rats (JPEC, 2008b). (B) Percentage of dose excreted in urine following a 4 h inhalation exposure to 4 or 40 ppm ETBE (Amberg et al., 2000). (C) Single 6 h NO exposure of male (C) or female (D) rats to 500, 1750 or 5000 ppm 14C–ETBE (Borghoff & Asgharian, 1996). Bars represent actual data collected (mean ± SD) from studies reported (Table 2 and Supporting information) or model simulation based on model parameter values provided in Table 3. ETBE, ethyl tertiary‐butyl ether; NO, nose‐only.
Figure 9.
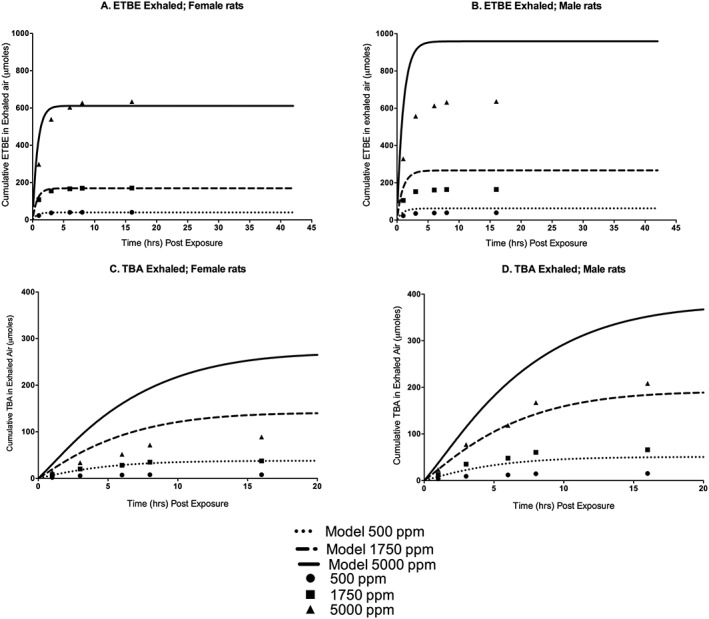
Cumulative ETBE (A, females; B, males) and TBA (C, females; D, males) exhaled following a single nose‐only exposure to 500, 1750 or 5000 ppm 14C–ETBE for 6 h. Symbols represent mean ± SD actual data collected (Borghoff & Asgharian, 1996; see Table 2 and Supporting information), with model simulations (lines) based on model parameter values provided in Table 3. ETBE, ethyl tertiary‐butyl ether; TBA, tertiary‐butyl alcohol.
where
Q pc is the scaled alveolar ventilation (l h−1 kg−1), bw is the body weight (kg), Q p is the absolute alveolar ventilation (l h−1), C venous is the venous blood concentrations of ETBE or TBA, and P blood/air is the blood/air PC for ETBE or TBA. Therefore, the amount exhaled of ETBE and TBA will increase proportionately to the increase in Q p Simulations of the observed values would be more predictive if the model parameters were adjusted to describe lower ventilation rates and possible absorption of TBA in airways on exhalation.
Overall, the agreement of model predictions with observed data was comparable between the model developed in this study and the model previously published by Salazar et al. (2015). When the SSE results (Table 4) were compared against the model reported in Salazar et al. (2015), this model had lower SSE for the majority of the simulations. One important distinction between this model and that of Salazar et al. is this model's incorporation of α2u–globulin, an important factor for predicting gender differences in the kidney concentrations of rats. Because the kidney is a target tissue for TBA, it is critical that the TBA model was able to predict TBA concentrations in the kidneys of exposed male and female rats. As mentioned in the Materials and methods section, the model included binding of both ETBE and TBA to α2u–globulin in the male, but not female, rat. The model structure for describing chemical binding to α2u–globulin was reported previously for the MTBE‐TBA model (Leavens & Borghoff, 2009). Figure 10 compares the model‐predicted versus observed kidney/blood TBA concentration ratios following single (Fig. 10A,B) or repeated (Fig. 10C,D) TBA inhalation exposure of male and female rats, respectively. Inclusion of binding in the model for male rats allowed prediction of the time‐ and dose‐dependent changes in the kidney/blood ratio observed specifically in male rats, confirming the importance of describing TBA binding to α2u–globulin. This feature of the model will be invaluable when relating kidney concentrations of ETBE and/or TBA following various exposure scenarios to either of these chemicals and comparing the different responses.
Table 4.
Comparison of model predictions in blood with observed data using Sum of Square Error (SSE)
| Study | SSEa | Ratio of SSE for current model compared with Salazar et al. (2015)b | |
|---|---|---|---|
| ETBE‐TBA model presented | Salazar et al. (2015) | ||
| TBA IV (Poet et al., 1997) | 1.24E + 06 | 3.89E + 06 | 0.3 |
| TBA inhalation (Leavens & Borghoff, 2009); includes both single and repeat | 7.14E + 04 | 7.74E + 04 | 0.9 |
| TBA gavage (ARCO, 1983; unpublished report); blood | 3.71E + 05 | 1.36E + 05 | 2.7 |
| TBA gavage (ARCO, 1983; unpublished report); urinary excretion percentage | 5.27E + 03 | 8.26E + 03 | 0.6 |
| TBA blood concentrations following ETBE gavage (JPEC, 2008b; single) | 6.42E + 01 | 2.17E + 03 | 0.03 |
| TBA blood concentrations following ETBE gavage (JPEC, 2008c; repeated) | 3.17E+00c | 2.3E+00c | 1.4 |
| TBA cumulative in urine following ETBE gavage (JPEC, 2008b; single) | 2.22E + 01 | 1.13E‐01d | 2.0E2 |
| Percentage dose exhaled versus excreted following ETBE gavage (JPEC, 2008b; single) | 9.94E + 01 | 2.85E + 04 | 0.004 |
| ETBE blood concentrations following ETBE inhalation study (Amberg et al., 2000) | 1.25E + 00 | 3.45E‐01 | 3.6 |
| TBA blood concentrations following ETBE inhalation study (Amberg et al., 2000) | 7.11E‐01 | 3.40E + 00 | 0.2 |
| Percentage dose excreted following ETBE inhalation study (Amberg et al., 2000) | 2.41E + 01 | 1.45E + 02 | 0.2 |
| Cumulative TBA in urine following ETBE inhalation study (Amberg et al., 2000) | 7.65E‐05 | 8.22E‐03 | 0.01 |
ETBE, ethyl tertiary‐butyl ether; TBA, tertiary‐butyl alcohol.
Estimated from square of difference between predicted value and observed data for study.
Ratios less than one indicate a better prediction of data with current model and are shaded for emphasis.
Fits for both models are improved if no induction is assumed for TBA metabolism.
Note that the TBA urine was closer to the measured because of lower urinary elimination, which results in TBA blood concentrations with a larger discrepancy compared to measured values.
Figure 10.
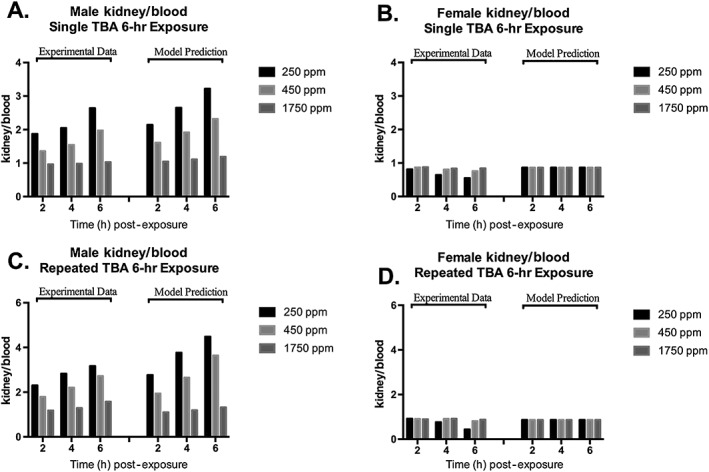
TBA kidney/blood ratio in male (A, single 6 h exposure; C, repeated exposure 6 h day−1 for 8 days) and female (B, single 6 h exposure; D, repeated exposure 6 h day−1 for 8 days) F344 rats at various time points following inhalation exposure to TBA at nominal concentrations of 250, 450 or 1750 ppm. Each bar represents the mean kidney/blood ratio calculated from the study data (Leavens & Borghoff, 2009; see Table 2 and Supporting information) with model simulations of these ratios based on model parameter values provided in Table 3. As described by Leavens and Borghoff (2009), TBA binding to α2u–globulin is described in the male, but not female rat kidney. TBA, tertiary‐butyl alcohol.
To determine exposure concentrations above which the kinetics of ETBE and TBA become nonlinear, the model was used to simulate ETBE blood AUC0–∞ following either single oral gavage administration or 6 h inhalation exposure to ETBE at the concentrations used in two separate cancer bioassays (Saito et al., 2013; Suzuki et al., 2012); the results are presented in Fig. 11. Following ETBE inhalation exposure in male rats, the kinetics of ETBE and TBA in blood begin to move from linear to nonlinear kinetics between exposure concentrations of 1800 and 2000 ppm (Fig. 11A,B). This corresponds to a daily inhaled dose of ~400–450 mg kg−1 bw day−1 estimated from using the model to simulate dose (mg kg−1) retained (Fig. 12). However, following oral administration by gavage of ETBE, the model shows a trend towards nonlinear kinetics of ETBE and TBA in blood with daily dose levels of ~200–300 mg kg−1 bw day−1 (Fig. 11C,D). The difference between these two exposure scenarios is likely caused by both first‐pass metabolism that would occur with oral, but not inhalation exposures and the rate of the administered dose. A transition from linear to nonlinear kinetics is also highlighted in model simulations of the maximum rate of ETBE metabolism following exposure to ETBE as presented in Fig. 13. The rate of ETBE and TBA metabolism is simulated following exposure to ETBE via inhalation exposure for 6 h (A), ETBE exposure via drinking water (B) and orally administration by gavage ETBE (C) showing that the metabolism of ETBE becomes saturated at greater than 800 mg kg−1 inhaled ETBE inhaled dose (~5000 ppm), a dose level that is higher than that predicted by the model to be achieved during the ETBE drinking water study. Further evidence for saturation of ETBE metabolism is provided in Fig. 8(A,B) in which the percentage of the administered dose of ETBE exhaled is increased with ETBE exposure concentration with a corresponding decrease in the percentage eliminated in urine.
Figure 11.
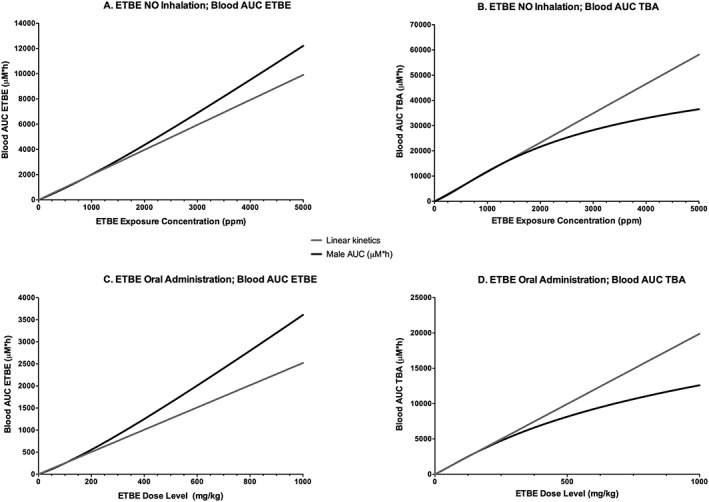
Model simulations of ETBE (A,C) or TBA (B,D) blood AUC following inhalation exposure of a male rat at concentrations up to 5000 ppm, or oral gavage administration up to 1000 mg kg−1 bw, to demonstrate the exposure concentration in which kinetics shifts from linear to nonlinear. ETBE, ethyl tertiary‐butyl ether; TBA, tertiary‐butyl alcohol.
Figure 12.
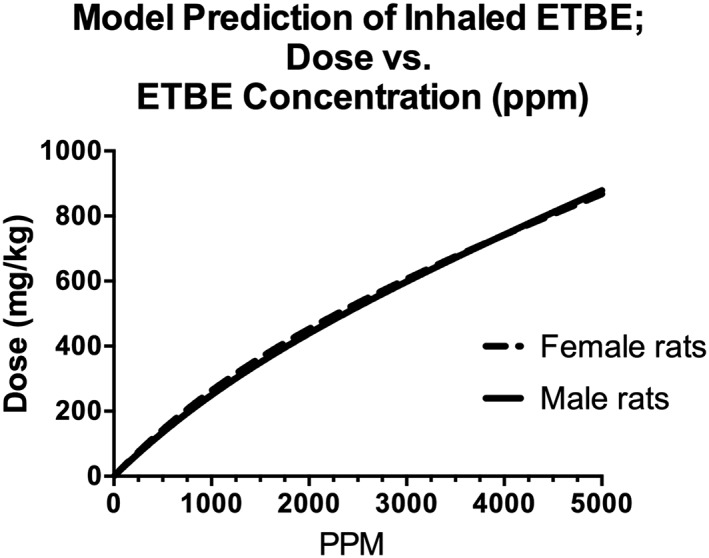
Model simulations of ETBE dose (mg kg−1) at ETBE exposure concentrations up to 5000 ppm for a 6 h inhalation exposure. Estimated dose is the amount of ETBE systemically retained (difference in inhaled and exhaled) over the 6 h exposure. Inhalation exposure concentration of 5000 ppm results in a dose of 869–878 mg kg−1 bw in female and male rats, respectively. ETBE, ethyl tertiary‐butyl ether.
Figure 13.
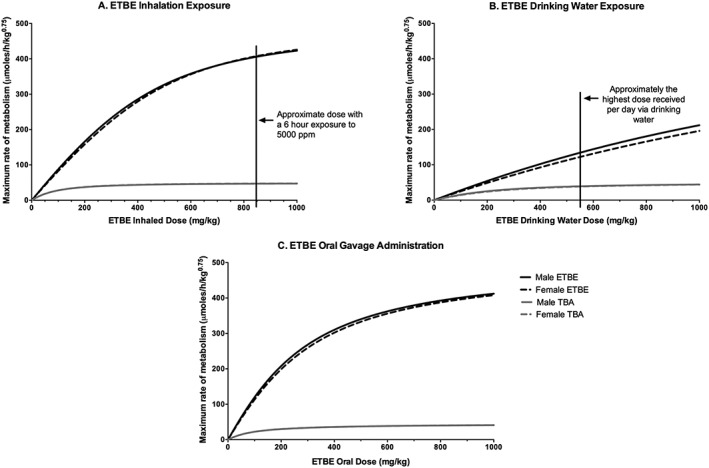
Model simulations of the maximum rate of metabolism of ETBE and TBA with ETBE inhalation exposure (A), ETBE drinking water exposure (B), and ETBE oral gavage administration (C) of dose levels up to 1000 mg kg−1. A 6 h inhalation exposure to 5000 ppm results in an estimated inhaled dose of ~850 mg kg−1 (A) with the highest ETBE dose level the animals received in the drinking water study ~550 mg kg−1 (B). ETBE, ethyl tertiary‐butyl ether; TBA, tertiary‐butyl alcohol.
Discussion
An ETBE‐TBA PBPK model was developed, verified and used to provide insight on how the kinetics under different exposure scenarios results in kidney toxicity (ETBE and TBA), kidney tumors (TBA), and liver tumors (ETBE) in exposed rats. Model inclusion of TBA binding to α2u–globulin in the male rat kidney was used to predict the kidney concentration of TBA under different exposure scenarios that have been observed to result in pathological features of α2u–globulin nephropathy (ETBE and TBA) and kidney tumors (TBA). This model was also used to determine whether the ETBE inhalation exposure concentrations associated with the liver tumor response in male rats result in nonlinear kinetics of ETBE and TBA. Although the data sets used to develop and verify this model were identical to the ones used by Salazar et al. (2015) for a recently reported ETBE‐TBA PBPK model in rats, for transparency proposes, these data sets are cited, and the actual data captured and recalculated are reported in the Supporting information. In addition, this model incorporates structural features and slightly different physiological and biochemical parameters and parameter values from the model of Salazar et al. (2015).
The structural features that differed between this model and the Salazar et al. (2015) model include: (1) omission of the TBA blood sequestration that Salazar noted was necessary to predict TBA blood concentrations specifically following IV administration of TBA (Poet et al., 1997); (2) ETBE metabolism via one oxidative pathway rather than two; and (3) modeling binding of ETBE and TBA to α2u–globulin in the kidney. In our TBA model, we found that TBA blood sequestration was not necessary to predict TBA in blood following exposure by IV, oral or inhalation routes. In addition, there are no experimental data to support plasma protein binding of TBA in the rat. Poet et al. (1997) reported the estimated volume of distribution at steady state (V dss), ranging from 0.67 to 1.3 l kg−1 after TBA IV administration, which indicates distribution outside the central compartment and is not consistent with protein binding. Unlike MTBE, there is in vitro evidence that ETBE is metabolized by CYP2B1 (Turini et al., 1998) with a study in P450 2E1 knockout mice showing that this enzyme has a negligible contribution (Hong et al., 1999b). As such, ETBE was modeled in the liver as Michaelis–Menten kinetics via one pathway rather than two. Salazar et al. (2015) did not include the binding of ETBE and TBA to the male rat‐specific protein α2u–globulin. In this model, ETBE and TBA binding to α2u–globulin was described in the male, but not female, rat kidney, because this protein is measured at high concentrations in male rats, with a lack of accumulation in female rats (Borghoff et al., 2001). As shown in Fig. 5, inclusion of binding in the male rat kidney is important for describing sex‐specific dose‐ and time‐dependent kidney/blood concentration ratios of TBA in rats.
The developed model contained structural features that enabled it to predict important characteristics in the observed kinetics of ETBE and TBA, such as gender differences in kidney concentrations, and dose‐dependent changes in the percentage of dose either excreted or exhaled. However, differing experiments produced some discrepancies between model‐predicted and observed values. Some of these discrepancies could be improved with changes in model parameters or assumptions. Model comparisons of the percentage of dose exhaled and excreted could be improved by reducing the alveolar ventilation rate during inhalation exposure, particularly when via nose‐only inhalation. Johanson and Filser (1992) reported that use of literature reference values for alveolar ventilation would likely over‐predict the inhalation uptake rate of most volatiles. Model predictions of TBA blood concentration following repeated dosing of ETBE could be improved if the model did not assume TBA metabolic induction with repeated ETBE exposure. As described in Leavens and Borghoff (2009), data from a mouse study (McComb and Goldstein, 1979) was used for estimating the extent of metabolic induction from repeated exposures to TBA. While TBA has been shown to induce metabolic enzymes in rats (Aarstad et al., 1985), literature data are not available to evaluate interspecies extrapolation; therefore, the mouse data from McComb and Goldstein (1979) were used for the rat. In addition to possible interspecies differences, the induction of metabolism would be expected to be concentration dependent (Aarstad et al., 1985); however, there are insufficient data in the literature to establish a correlation that could be incorporated into the model at this time. Other potential sources of discrepancies between model‐predicted and experimental values include uncertainty and error in experimentally observed data values extracted from the literature. For example, in the ARCO (1983) TBA toxicokinetics report, the final TBA blood concentrations were only 100‐fold higher following a dose of 500 mg kg−1 bw than following a dose of 1 mg kg−1 bw. This also appears to be the case with the data extracted from the Amberg et al. (2000) study: the concentrations are well below levels where metabolic saturation would occur, and yet the ETBE blood concentration following exposure to the high concentration of 40 ppm is not 10‐fold higher than the concentrations following 4 ppm exposure. In the Amberg et al. study, the data reported may not have captured the time collected and blood concentration analyzed immediately at the end of the exposure, because these factors would have contributed to lower‐than‐predicted blood concentrations based on the volatility of ETBE. In the ARCO (1983) study, because no information was provided on potential differences in radioactivity in blood versus plasma, calculations of the blood concentrations of TBA from the study data assumed that the percentage radioactivity attributable to TBA would be the same in blood as in plasma; this assumption may not be accurate if there are significant differences in partitioning into blood cells between TBA and its metabolites. In addition, the total radioactivity in the plasma was not accounted for in plasma samples where TBA was separated from the metabolites.
Challenges also are presented by data sets collected from nose‐only inhalation exposure; parameters such as ventilation rate may fluctuate during exposure (Alarie, 1973), and loss of volatile chemicals may occur during collection and extraction from charcoal traps or analysis of the compounds. Despite these potential sources of error, and considering the diversity of the data sets available, overall, the predictions of this ETBE‐TBA model compared well with experimental time–concentration profiles following exposure to ETBE or TBA in male and female rats under a number of different exposure scenarios.
As mentioned previously, this model incorporated ETBE and TBA binding to α2u–globulin in the male but not female rat, as described by Leavens and Borghoff (2009). There is evidence that TBA binds to α2u–globulin (Williams & Borghoff, 2001), but there is no direct evidence that ETBE binds to this protein. However, indirect evidence supports ETBE binding to α2u–globulin, from a study in which ETBE‐exposed male rats developed pathological features associated with α2u–globulin nephropathy (Medinsky et al., 1999). α2u–Globulin nephropathy is a syndrome associated with chemical binding to α2u–globulin, which results in decreased catabolism of this protein and its accumulation in the kidney in the form of protein droplets. With chronic exposure, exacerbation of protein droplets ensues, leading to necrosis, increased cell proliferation and kidney tumors in male rats (US EPA, 1991). In addition, Kaneko et al. (2000) showed a higher ETBE kidney/blood PC compared to liver/blood PC, suggesting that factors other than solubility were involved in the uptake of ETBE into the male rat kidney. A high kidney/blood PC compared to liver has been demonstrated for MTBE, a chemical structurally similar to ETBE and shown to bind to α2u–globulin (Borghoff et al., 1996; Poet et al., 1997).
Although no data sets were available to test the model's ability to predict ETBE levels in the male vs. female rat kidney following ETBE exposure, there was a comprehensive data set of TBA observations in rats exposed by inhalation to TBA that was used in the previous MTBE‐TBA model (Leavens & Borghoff, 2009). This model reproduced the time and concentration dependence of the ratio of TBA kidney/blood concentrations observed in the male rat, and the lack of time and concentration dependence observed in the female rat (Fig. 10). The ability to predict TBA in the kidney indicates that the model would be useful for simulating the cancer bioassay exposure scenarios for both ETBE and TBA, to determine whether differences exist in the dose in the target tissue that are associated with the different kidney tumor responses that occur with these two chemicals. In fact, when the model was used to predict TBA AUC in the kidney following exposure to ETBE or TBA by the route and exposure concentrations used in their respective cancer bioassays (Table 1), the results following exposure to ETBE were very similar to the results following exposure to TBA (Fig. 14). The similarity in kidney TBA AUCs predicted for ETBE and TBA exposures suggests that the kidney dose of TBA alone does not explain the different tumor responses observed following exposure to ETBE and TBA (Table 1), even though α2u–globulin nephropathy is observed following exposure to both chemicals. Rather, the different tumor responses are most likely influenced by other differences reported in these two bioassays, such as severity of chronic progressive nephropathy. Because the male rat‐specific renal tumors induced by TBA operate through modes of action (α2u–globulin nephropathy and chronic progressive nephropathy) that are not relevant in humans (Hard & Khan, 2004; Hard & Seely, 2005; Hard et al., 2009), the lesions associated with either of these syndromes should not be used to develop a point of departure in a risk assessment for either ETBE or TBA.
Figure 14.
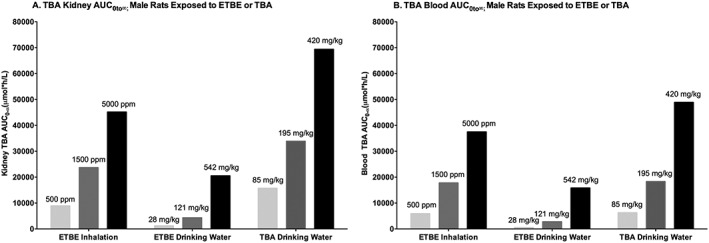
Model simulations of TBA AUC in kidney (A) or blood (B) following ETBE inhalation exposure to a male rat (500, 1500 or 5000 ppm) for 6 h, exposure to ETBE in drinking water modeled to reflect a 12 h drinking water period, with dose levels of 28, 121 or 542 mg kg−1 bw day−1, and exposure to TBA in drinking water modeled to reflect a 12 h drinking water period with dose levels of 85, 195 or 420 mg kg−1 bw day−1. ETBE, ethyl tertiary‐butyl ether; TBA, tertiary‐butyl alcohol.
In several studies that focused on the identification of the mode of action for the ETBE‐induced liver tumors in rats, Kakehashi et al. (2013, 2015) provided evidence to support a high‐dose mode of action similar to that of phenobarbital: induction of cell proliferation due to oxidative stress and DNA modification‐dependent activation of receptors, including constitutive androstane receptor, pregnane‐X‐receptor and peroxisome proliferator‐activated receptors. This mode of action for liver tumors in rats is considered not to be operative in humans (Kakehashi et al., 2013). Moreover, these tumors occur in rats only at a dose level of at least 1000 mg kg−1 bw day−1 following promotion with N‐ethyl‐N‐(2‐hydroxyethyl)nitrosamine, or 2 years of inhalation exposure to 5000 ppm ETBE, an exposure concentration in which this model predicts a inhaled dose of ~850 mg kg−1 day−1. Considering that the human kinetics of ETBE is similar to what has been shown in rodents and that the high ETBE inhalation exposure concentrations used in animal studies are not environmentally relevant (~200‐fold higher than the ACGIH TLV of 25 ppm), the evidence strongly supports a low risk.
As also noted in the model simulations presented using this PBPK ETBE‐TBA model, the high incidence of hepatocellular adenomas following exposure to 5000 ppm ETBE appears to correlate with nonlinear toxicokinetic behavior. Saito et al. (2013) estimated that an exposure concentration of 5000 ppm corresponded to a dose level of 4442 mg kg−1 bw day−1, assuming 100% absorption. However, as noted in Fig. 12, this model predicts that an inhalation exposure of 5000 ppm corresponds to an inhaled dose level of ~842–860 mg kg−1 bw day−1. This dose level is ~1.5‐fold higher than the oral dose in the ETBE drinking‐water study in which no liver tumors were observed (Suzuki et al., 2012), suggesting that tumors in the male rat develop an ETBE concentration at which the metabolism is saturated.
Some rodent tumor responses occur only at high test doses; therefore, their relevance to human health hazard may be questioned. Saturation of metabolic processes at high‐dose/exposure concentrations may result in transition to novel modes of action unique to those high‐dose levels, unrelated to modes of action that operate at lower doses also used in animal studies, and at substantially lower real‐world human exposures (Barton et al., 2006; Carmichael et al., 2006; Doe et al., 2006; Foran, 1997; Slikker et al., 2004a, 2004b). The high‐dose toxicity findings are observed only under exposure concentrations that exhibit saturation of metabolic processes, and this lack of human relevance has been recognized in OECD guidance for the dose selection process in animal bioassays (OECD, 2011 28 July 2011). Although the OECD guidance was provided for a reproduction study, this recommendation is also appropriate for dose selection in other animal studies, including carcinogenicity assays; it is particularly appropriate for substances that are not regarded as genotoxic, such as ETBE (McGregor, 2007; Noguchi et al., 2013).
Applying OECD guidance to select the top test concentration based “at, or just slightly above the inflection point for transition to nonlinear toxicokinetic behaviour” would likely have justified a top inhalation exposure concentration for ETBE well below 5000 ppm. If this strategy had been employed, it is most likely that 5000 ppm ETBE would not have been identified as a high exposure concentration to be used in the chronic 2‐year bioassay, a concentration that resulted in increased hepatocellular adenomas in male rats.
In conclusion, an important finding of this ETBE‐TBA PBPK model analysis is that the male rat liver tumor response that followed inhalation but not drinking‐water exposure to ETBE occurred under conditions of nonlinear kinetics and questioning its use for predicting human risk. Toxicity findings under high exposure conditions that exhibit these behaviors have limited human health hazard and risk implications, particularly if the inflection point for onset of nonlinear toxicokinetics is significantly above real‐world human exposures, as appears to be the case for ETBE.
Conflict of interest
The development of this PBPK model and the preparation of the manuscript was funded by Lyondell Chemical Company.
Supporting information
Table S1 Supporting info item
Acknowledgments
The authors thank Rick Nelson for editorial assistance. Copies of the acslXtreme model code as well as Excel file for SSE calculations for Figs 2, 4 and 6 can be provided on request to the corresponding author.
Borghoff, S. J. , Ring, C. , Banton, M. I. , and Leavens, T. L. (2017) Physiologically based pharmacokinetic model for ethyl tertiary‐butyl ether and tertiary‐butyl alcohol in rats: Contribution of binding to α2u–globulin in male rats and high‐exposure nonlinear kinetics to toxicity and cancer outcomes. J. Appl. Toxicol., 37: 621–640. doi: 10.1002/jat.3412.
References
- Aarstad K, Zahlsen K, Nilsen OG. 1985. Inhalation of butanols: Changes in the cytochrome P‐450 enzyme system. Arch. Toxicol. (Suppl. 8): 418–421. [DOI] [PubMed] [Google Scholar]
- ACGIH . 2015. Guide to Occupational Exposure Values. American Council of Governmental Industrial Hygienists. ISBN:978–1–607260‐78‐3. [Google Scholar]
- Alarie Y. 1973. Sensory irritation by airborne chemicals. CRC Crit. Rev. Toxicol. 2: 299–363. [DOI] [PubMed] [Google Scholar]
- Amberg A, Rosner E, Dekant W. 1999. Biotransformation and kinetics of excretion of methyl‐tert‐butyl ether in rats and humans. Toxicol. Sci. 51: 1–8. [DOI] [PubMed] [Google Scholar]
- Amberg A, Rosner E, Dekant W. 2000. Biotransformation and kinetics of excretion of ethyl‐tert‐butyl ether in rats and humans. Toxicol. Sci. 53: 194–201. [DOI] [PubMed] [Google Scholar]
- ARCO . 1983. Toxicology Report ARCO Chemical Company. Tertiary‐butyl alcohol metabolism & Pharmacokinetics. Toxicologist's report with cover letter dated 03/24/1994 (8EHQ86940000263). ARCO Chemical Company, Newton Square, PA.
- Barton HA, Pastoor TP, Baetcke K, Chambers JE, Diliberto J, Doerrer NG, Driver JH, Hastings CE, Iyengar S, Krieger R, Stahl B, Timchalk C. 2006. The acquisition and application of absorption, distribution, metabolism, and excretion (ADME) data in agricultural chemical safety assessments. Crit. Rev. Toxicol. 36: 9–35. [DOI] [PubMed] [Google Scholar]
- Bernauer U, Amberg A, Scheutzow D, Dekant W. 1998. Biotransformation of 12C‐ and 2‐13C‐labeled methyl tert‐butyl ether, ethyl tert‐butyl ether, and tert‐butyl alcohol in rats: Identification of metabolites in urine by 13C nuclear magnetic resonance and gas chromatography/mass spectrometry. Chem. Res. Toxicol. 11: 651–658. [DOI] [PubMed] [Google Scholar]
- Borghoff SJ, Asgharian B. 1996. Ethyl tertiary‐butyl ether (ETBE): Pharmacokinetic study in male and female CD‐1 mice after single inhalation exposure and male and female F‐344 rats after single and repeated inhalation exposure. CIIT Protocol 95026. Unpublished study for ARCO Chemical Company, 19 December 1996.
- Borghoff SJ, Murphy JE, Medinsky MA. 1996. Development of physiologically based pharmacokinetic model for methyl tertiary‐butyl ether and tertiary‐butanol in male Fisher‐344 rats. Fundam. Appl. Toxicol. 30: 264–275. [PubMed] [Google Scholar]
- Borghoff SJ, Prescott JS, Janszen DB, Wong BA, Everitt JI. 2001. Alpha 2u‐globulin nephropathy, renal cell proliferation, and dosimetry of inhaled tert‐butyl alcohol in male and female F‐344 rats. Toxicol. Sci. 61: 176–186. [DOI] [PubMed] [Google Scholar]
- Borghoff SJ, Parkinson H, Leavens TL. 2010. Physiologically based pharmacokinetic rat model for methyl tertiary‐butyl ether; comparison of selected dose metrics following various MTBE exposure scenarios used for toxicity and carcinogenicity evaluation. Toxicology 275(1–3): 79–91. [DOI] [PubMed] [Google Scholar]
- Brown RP, Delp MD, Lindstedt SL, Rhomberg LR, Beliles RP. 1997. Physiological parameter values for physiologically based pharmacokinetic models. Toxicol. Ind. Health 13: 407–484. [DOI] [PubMed] [Google Scholar]
- Carmichael NG, Barton HA, Boobis AR, Cooper RL, Dellarco VL, Doerrer NG, Fenner‐Crisp PA, Doe JE, Lamb JC, 4th , Pastoor TP. 2006. Agricultural chemical safety assessment: A multi‐sector approach to the modernization of human safety requirements. Crit. Rev. Toxicol. 36: 1–7. [DOI] [PubMed] [Google Scholar]
- Carruthers L, Reeves K, Paul M, Searle A, Templeton W, Paine AJ. 1987. The role of alpha 2u globulin synthesis in the production of renal hyaline droplets by iso‐octane. Biochem. Pharmacol. 36: 2577–2580. [DOI] [PubMed] [Google Scholar]
- Charbonneau M, Lock EA, Strasser J, Cox MG, Turner MJ, Bus JS. 1987. 2,2,4‐Trimethylpentane‐induced nephrotoxicity. I. Metabolic disposition of TMP in male and female Fischer 344 rats. Toxicol. Appl. Pharmacol. 91: 171–181. [DOI] [PubMed] [Google Scholar]
- Cirvello JD, Radovsky A, Heath JE, Farnell DR, Lindamood C, III . 1995. Toxicity and carcinogenicity of t‐butyl alcohol in rats and mice following chronic exposure in drinking water. Toxicol. Ind. Health 11: 151–165. [DOI] [PubMed] [Google Scholar]
- Doe JE, Boobis AR, Blacker A, Dellarco VL, Doerrer NG, Franklin C, Goodman JI, Kronenberg JM, Lewis R, McConnell EE, Mercier T, Moretto A, Nolan C, Padilla S, Phang W, Solecki R, Tilbury L, van Ravenzwaay B, Wolf DC. 2006. A tiered approach to systemic toxicity testing for agricultural chemical safety assessment. Crit. Rev. Toxicol. 36: 37–68. [DOI] [PubMed] [Google Scholar]
- Eitaki Y, Kawai T, Omae K. 2011. Exposure assessment of ETBE in gas station workers and gasoline tanker truck drivers. J. Occup. Health 53: 423–431. [DOI] [PubMed] [Google Scholar]
- Foran JA. 1997. Principles for the selection of doses in chronic rodent bioassays. ILSI Risk Science Working Group on Dose Selection. Environ. Health Perspect. 105: 18–20. [DOI] [PMC free article] [PubMed] [Google Scholar]
- Hagiwara A, Doi Y, Imai N, Suguro M, Kawabe M, Furukawa F, Tamano S, Nagano K, Fukushima S. 2015. Promotion of liver and kidney carcinogenesis by ethyl tertiary‐butyl ether (ETBE) in male Wistar rats. J. Toxicol. Pathol. 28: 189–195. [DOI] [PMC free article] [PubMed] [Google Scholar]
- Hard GC, Khan KN. 2004. A contemporary overview of chronic progressive nephropathy in the laboratory rat, and its significance for human risk assessment. Toxicol. Pathol. 32: 171–180. [DOI] [PubMed] [Google Scholar]
- Hard GC, Seely JC. 2005. Recommendations for the interpretation of renal tubule proliferative lesions occurring in rat kidneys with advanced chronic progressive nephropathy (CPN). Toxicol. Pathol. 33: 641–649. [DOI] [PubMed] [Google Scholar]
- Hard GC, Johnson KJ, Cohen SM. 2009. A comparison of rat chronic progressive nephropathy with human renal disease—Implications for human risk assessment. Crit. Rev. Toxicol. 39: 332–346. [DOI] [PubMed] [Google Scholar]
- Hong J‐Y, Want YY, Bondoc FY, Lee M, Yang CS, Hu W‐Y, Pan J. 1999a. Metabolism of methyl tert‐butyl ether and other gasoline ethers by human liver microsomes and heterologously expressed human cytochrome P450: Identification CYP2A6 as a major catalyst. Toxicol. Appl. Pharmacol. 160: 43–48. [DOI] [PubMed] [Google Scholar]
- Hong J‐Y, Wang Y‐Y, Bondoc FY, Yang CS, Gonzalez FJ, Pan Z, Cokonis C‐D, Hu W‐Y, Bao Z. 1999b. Metabolism of methyl tert‐butyl ether and other gasoline ethers in mouse liver microsomes lacking cytochrome P450 2E1. Toxicol. Lett. 105: 83–88. [DOI] [PubMed] [Google Scholar]
- Johanson G, Filser JG. 1992. Experimental data from closed chamber gas uptake studies in rodents suggest lower uptake rate of chemical than calculated from literature values on alveolar ventilation. Arch. Toxicol. 66: 291–295. [DOI] [PubMed] [Google Scholar]
- JPEC . 2008a. ETBE Risk Assessment Report. 1–108. In: Report of research in promotion of the use of nonfossil fuel (biomass in origin) introduction (PEC‐2007L‐06) (English). Japan Petroleum Energy Center, http://www.pecj.or.jp/english/news/pdf/b‐2‐8.pdf (accessed 5 July 2012).
- JPEC . 2008b. Final report – Pharmacokinetic study in rats treated with single dose of [14C]‐ETBE. Japan Petroleum Energy Center, Kumamoto Laboratory, Mitsubishi Chemical Safety Institute, Kumamoto, Japan. Report No. P070496.
- JPEC . 2008c. Final report – Pharmacokinetic study in rats treated with [14C]‐ETBE repeatedly for 14 days. Japan Petroleum Energy Center, Kumamoto Laboratory, Mitsubishi Chemical Safety Institute, Kumamoto, Japan. Report No. P070497.
- Kakehashi A, Hagiwara A, Imai N, Nagano K, Nishimaki F, Banton M, Wei W, Fukushima S, Wanibuchi H. 2013. Mode of action of ethyl tertiary‐butyl ether hepatotumorigenicity in the rat: Evidence for a role of oxidative stress via activation of CAR, PXR and PPAR signaling pathways. Toxicol. Appl. Pharmacol. 273: 390–400. [DOI] [PubMed] [Google Scholar]
- Kakehashi A, Hagiwara A, Imai N, Wei M, Fukushima S, Wanibuchi H. 2015. Induction of cell proliferation in the rat liver by the short‐term administration of ethyl tertiary‐butyl ether. J. Toxicol. Pathol. 28: 27–32. [DOI] [PMC free article] [PubMed] [Google Scholar]
- Kaneko T, Wang P‐Y, Sato A. 2000. Partition coefficients for gasoline additives and their metabolites. J. Occup. Health 42: 86–87. [Google Scholar]
- Le Gal A, Dreano Y, Gevasi PG, Berthou F. 2001. Human cytochrome P450 2A6 is the major enzyme involved in the metabolism of three alkoyxyethers used as oxyfuels. Toxicol. Lett. 124: 47–58. [DOI] [PubMed] [Google Scholar]
- Leavens T, Borghoff S. 2009. Physiologically based pharmacokinetic model of methyl tertiary 6 butyl ether and tertiary‐butyl alcohol dosimetry in male rats based on binding to 7 alpha2u‐globulin. Toxicol. Sci. 109: 321–335. [DOI] [PubMed] [Google Scholar]
- Malveda M, Janshekar H, Yoneyama M. 2009. Gasoline Octane Improvers/Oxygenates. SRI Consulting. Available from: http://www.sriconsulting.com/CEH/Public/Reports/543.7500/
- McComb JA, Goldstein DB. 1979. Quantitative comparison of physical dependence on tertiary butanol and ethanol in mice: correlation with lipid solubility. J. Pharmacol. Exp. Ther. 208: 113–117. [PubMed] [Google Scholar]
- McGregor D. 2007. Ethyl tertiary‐butyl ether: A toxicological review. Crit. Rev. Toxicol. 37: 287–312. [DOI] [PubMed] [Google Scholar]
- Medinsky MA, Kimbell JS, Morris JB, Gerde P, Overton JH. 1993. Advances in biologically based models for respiratory‐tract uptake of inhaled volatiles. Fundam. Appl. Toxicol. 20(3): 265–272. [DOI] [PubMed] [Google Scholar]
- Medinsky MA, Wolf DC, Cattley RC, Wong B, Janssen DB, Farris GM, Wright GA, Bond JA. 1999. Effects of a thirteen‐week inhalation exposure to ethyl tertiary‐butyl ether on Fischer‐344 rats and CD‐1 mice. Toxicol. Sci. 51: 108–118. [DOI] [PubMed] [Google Scholar]
- Meulenberg CJW, Viverberg HPM. 2000. Empirical relations predicting human and rat tissue: air partition coefficients of volatile organic compounds. Toxicol. Appl. Pharmacol. 165: 206–216. [DOI] [PubMed] [Google Scholar]
- Noguchi T, Kamigaito T, Katagiri T, Kondou H, Yamazaki K, Aiso S, Nishizawa T, Nagano K, Fukushima S. 2013. Lack of micronucleus induction activity of ethyl tertiary‐butyl ether in the bone marrow of F344 rats by sub‐chronic drinking‐water treatment, inhalation exposure, or acute intraperitoneal injection. J. Toxicol. Sci. 38(6): 913–914. [DOI] [PubMed] [Google Scholar]
- NTP 1995. Toxicology and carcinogenesis studies of t‐butyl alcohol (CAS no 75‐65‐0) in F344/N rats and B6C3F1 mice (drinking water studies) (NTPTR436). National Toxicology Program: Research Triangle Park, NC, 21–305. [PubMed]
- NTP . 1997. Toxicity studies of t‐butyl alcohol (CAS no 75‐65‐0) administered by inhalation to F344/N rats and B6C3F1 mice (A51‐D59). Research Triangle Park, NC, 1–56. [PubMed]
- OECD . 2011. OECD guideline for the testing of chemicals: Extended one‐generation reproductive toxicity study. Organization for Economic Co‐operation and Development, 28 July 2011.
- Olson MJ, Garg BD, Murty CV, Roy AK. 1987. Accumulation of alpha 2u‐globulin in the renal proximal tubules of male rats exposed to unleaded gasoline. Toxicol. Appl. Pharmacol. 90: 43–51. [DOI] [PubMed] [Google Scholar]
- Poet TS, Borghoff SJ. 1997. In vitro uptake of methyl tert‐butyl ether in male rat kidney: Use of a two‐compartment model to describe protein interactions. Toxicol. Appl. Pharmacol. 145: 340–348. [DOI] [PubMed] [Google Scholar]
- Poet TS, Valentine JL, Borghoff SJ. 1997. Pharmacokinetics of tertiary‐butyl alcohol in male and female Fischer 344 rats. Toxicol. Lett. 92: 179–186. [DOI] [PubMed] [Google Scholar]
- Rao HV, Ginsberg GL. 1997. A physiologically‐based pharmacokinetic model assessment of methyl t‐butyl ether in groundwater for a bathing and showering determination. Risk Anal. 17: 583–598. [DOI] [PubMed] [Google Scholar]
- Saito A, Sasaki T, Kasai T, Katagiri T, Nishizawa T, Noguchi T, Aiso S, Nagano K, Fukushima S. 2013. Hepatotumorigenicity of ethyl tertiary‐butyl ether with 2‐year inhalation exposure in F344 rats. Arch. Toxicol. 87(5): 905–914. [DOI] [PubMed] [Google Scholar]
- Salazar KD, Brinkerhoff CJ, Lee JS, Chiu WA. 2015. Development and application of a rat PBPK model to elucidate kidney and liver effects induced by ETBE and tert‐butanol. Toxicol. Appl. Pharmacol. 288(3): 439–452. [DOI] [PubMed] [Google Scholar]
- Slikker W, Jr , Andersen ME, Bogdanffy MS, Bus JS, Cohen SD, Conolly RB, David RM, Doerrer NG, Dorman DC, Gaylor DW, Hattis D, Rogers JM, Sletzer WR, Swenberg JA, Wallace K. 2004a. Dose‐dependent transitions in mechanisms of toxicity. Toxicol. Appl. Pharmacol. 201: 203–225. [DOI] [PubMed] [Google Scholar]
- Slikker W, Jr , Andersen ME, Bogdanffy MS, Bus JS, Cohen SD, Conolly RB, David RM, Doerrer NG, Dorman DC, Gaylor DW, Hattis D, Rogers JM, Sletzer WR, Swenberg JA, Wallace K. 2004b. Dose‐dependent transitions in mechanisms of toxicity: Case studies. Toxicol. Appl. Pharmacol. 201: 226–294. [DOI] [PubMed] [Google Scholar]
- Stonard MD, Phillips PG, Foster JR, Simpson MG, Lock EA. 1986. Alpha 2 U‐globulin: Measurement in rat kidney and relationship to hyaline droplets. Clin. Chim. Acta 160: 197–203. [DOI] [PubMed] [Google Scholar]
- Suzuki M, Yamazaki K, Kano H, Aiso S, Nagano K, Fukushima S. 2012. No carcinogenicity of ethyl tertiary‐butyl ether by 2‐year oral administration in rats. J. Toxicol. Sci. 37(6): 1239–1246. [DOI] [PubMed] [Google Scholar]
- Turini A, Amato G, Longo V, Gervasi PG. 1998. Oxidation of methyl‐ and ethyl‐tertiary butyl ethers in rat liver microsomes: role of the cytochrome P‐450 isoforms. Arch. Toxicol. 72: 207–214. [DOI] [PubMed] [Google Scholar]
- US EPA . 1991. Alpha‐2u‐globulin: Association with 36 chemically induced renal toxicity and neoplasia in the male rat. EPA/625/3‐91/019F. U.S. Environmental Protection Agency, National Center for Environmental Assessment, Washington, DC.
- USGS . 2006. Volatile organic compounds in the nation's ground water and drinking‐water supply wells. National Water‐Quality Assessment Program. U.S. Geological Survey Circular 1292. ISBN 1‐411‐30836‐0.
- Williams TM, Borghoff SJ. 2001. Characterization of tert‐butyl alcohol binding to alpha2u‐globulin in F‐344 rats. Toxicol. Sci. 62: 228–235. [DOI] [PubMed] [Google Scholar]
Associated Data
This section collects any data citations, data availability statements, or supplementary materials included in this article.
Supplementary Materials
Table S1 Supporting info item


