

Supplemental Digital Content is available in the text
Keywords: deep sequencing, EUS-FNA, IPMN, miRNA, pancreatic cancer, tumor marker
Abstract
Objective:
The aim of our study was to analyze the miRNome of pancreatic ductal adenocarcinoma (PDAC) and its preneoplastic lesion intraductal papillary mucinous neoplasm (IPMN), to find new microRNA (miRNA)-based biomarkers for early detection of pancreatic neoplasia.
Objective:
Effective early detection methods for PDAC are needed. miRNAs are good biomarker candidates.
Methods:
Pancreatic tissues (n = 165) were obtained from patients with PDAC, IPMN, or from control individuals (C), from Hospital Clínic of Barcelona. Biomarker discovery was done using next-generation sequencing in a discovery set of 18 surgical samples (11 PDAC, 4 IPMN, 3 C). MiRNA validation was carried out by quantitative reverse transcriptase PCR in 2 different set of samples. Set 1—52 surgical samples (24 PDAC, 7 IPMN, 6 chronic pancreatitis, 15 C), and set 2—95 endoscopic ultrasound-guided fine-needle aspirations (60 PDAC, 9 IPMN, 26 C).
Results:
In all, 607 and 396 miRNAs were significantly deregulated in PDAC and IPMN versus C. Of them, 40 miRNAs commonly overexpressed in both PDAC and IPMN were selected for further validation. Among them, significant up-regulation of 31 and 30 miRNAs was confirmed by quantitative reverse transcriptase PCR in samples from set 1 and set 2, respectively.
Conclusions:
miRNome analysis shows that PDAC and IPMN have differential miRNA profiles with respect to C, with a large number of deregulated miRNAs shared by both neoplastic lesions. Indeed, we have identified and validated 30 miRNAs whose expression is significantly increased in PDAC and IPMN lesions. The feasibility of detecting these miRNAs in endoscopic ultrasound-guided fine-needle aspiration samples makes them good biomarker candidates for early detection of pancreatic cancer.
Pancreatic ductal adenocarcinoma (PDAC) is the fourth leading cause of cancer death in occidental countries and has the worst prognosis of all major malignancies, with just a 5-year survival rate of 6%.1 By the time of diagnosis, most patients present with locally advanced or metastatic disease that precludes curative resection and have a mean survival of less than 1 year.2,3 These dire statistics are due to the high aggressiveness of this tumor, limited response to available treatments because of resistance to chemotherapy and radiation in most cases, and lack of methods for early detection.4,5
Currently, the best available diagnostic tests include computed tomography, magnetic resonance imaging, and endoscopic ultrasound.6 Along with an increasing use of these imaging techniques, the diagnosis of intraductal papillary mucinous neoplasm (IPMN), the most common cystic precursor lesion of PDAC, has risen incessantly, representing up to 25% of resected pancreatic neoplasms.7 However, they are not sensitive enough to assess for the malignity of an IPMN or to detect pancreatic cancer at an early stage of dysplasia.8 Therefore, a deeper knowledge of molecular carcinogenesis of PDAC, novel early diagnostic biomarkers, and effective therapeutic targets are urgently required to improve the outcome of this malignant disease.
MicroRNAs (miRNAs) are small endogenous noncoding RNAs of 19 to 25 nucleotides that negatively regulate gene expression at the posttranscriptional level by either repressing mRNA translation or targeting mRNAs for degradation.9 miRNAs are estimated to modulate the translation of more than 60% of protein-coding genes and are involved in regulating a wide range of biological processes such as cellular proliferation, differentiation, apoptosis, and development.10,11 Their dysregulation plays an essential role in the development and progression of cancer, and they can act as tumor suppressors or oncogenes by targeting 1 or even hundreds of mRNAs.12
Aberrant expression of miRNAs has been widely reported in human cancers including PDAC and its precursor lesions.13,14 The differential expression of miRNAs between normal and malignant tissues can arise from chromosomal alterations of the miRNA genes, many of which are located at cancer-associated genomic regions, DNA point mutations, epigenetic mechanisms, or alterations in the miRNA processing machinery.15 Several studies of miRNA expression profiling have defined miRNA signatures for PDAC that are associated with diagnosis, staging, progression, prognosis, and response to treatment.16–19 In our study, we have focused on those miRNAs commonly deregulated in both IPMN and PDAC, with the aim of finding good candidate biomarkers for detection of both neoplastic lesions, due to the high risk of malignancy that IPMN lesions present. The results obtained could be further explored to identify new noninvasive biomarkers in biological fluids capable of detecting IPMN and PDAC in a common way. Ours is one of the first studies to investigate the miRNome of PDAC and IPMN using next-generation sequencing (NGS) techniques. We have identified here new candidate miRNAs as biomarkers for early detection of pancreatic neoplasms, and these results have been validated in 2 independent sets of samples, one of them obtained by endoscopic ultrasound-guided fine-needle aspiration (EUS-FNA).
METHODS
Patients and Sample Collection
A flow diagram of the study design is given in Figure 1. The study was conducted in 3 main steps: a genome-wide miRNA profiling to discover new potential biomarkers and 2 validations of the most significant results by quantitative reverse transcriptase PCR (qRT-PCR) in 2 independent groups of samples.
FIGURE 1.
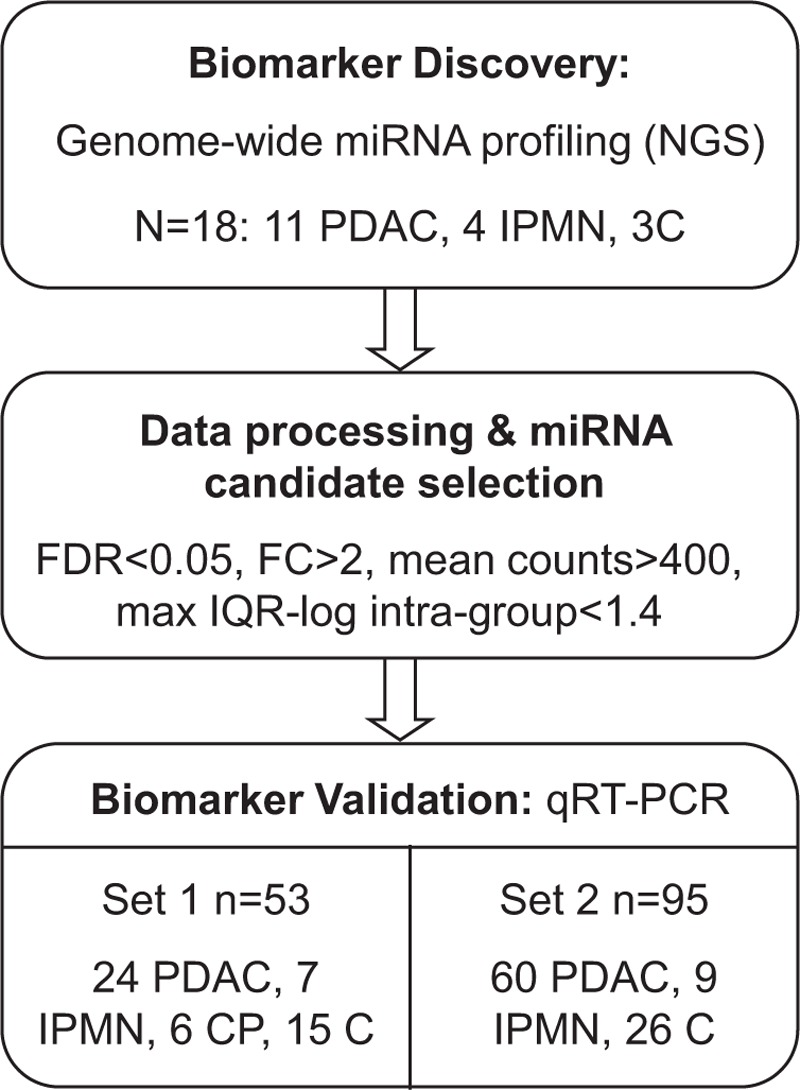
A flowchart of the study design is shown. Next-generation sequencing was performed on a set of pancreatic tissue samples for biomarker discovery. Candidate miRNAs were analyzed by qRT-PCR in 2 independent sets of samples.
We obtained pancreatic samples from a total of 165 individuals prospectively included in Hospital Clínic of Barcelona between 2008 and 2013. An initial set of 18 surgical pancreatic tissue samples (11 PDAC, 4 IPMN, and 3 normal tissues C) was used for genome-wide miRNA profiling. Sample macro dissection was performed by experienced pathologists who split tissue samples in 2 parts: one for miRNA analysis and the other for diagnostic confirmation. Validation of candidate miRNAs was done by qRT-PCR in 2 independent cohorts: set 1 of 52 surgical samples [24 PDAC, 7 IPMN, 6 chronic pancreatitis (CP), 15 C], and set 2 of 69 EUS-FNA pancreatic samples (60 PDAC, 9 IPMN) and 26 surgical normal pancreatic tissues (C). FNA was performed using a standard 22-G needle by experienced ecoendoscopists who aspirated from the tumor mass in PDAC or from the cystic wall in the case of IPMN. FNAs were split in 2: for cytology and for miRNA analysis. Pancreatic tissues were kept on dry ice at all times during handling, flash frozen in liquid nitrogen, and stored at −80°C until RNA isolation. Normal pancreatic tissue is from patients who underwent surgery for other reasons (ie, ampulloma or cystadenoma) or from an adjacent nontumoral part of PDAC lesions. IPMN samples are from benign cysts. None of the patients with PDAC had received chemo or radiotherapy before sample collection. The clinico-pathological features of all individuals included in the study are detailed in Supplementary Table 1.
This study was approved by the Institutional Ethics Committee of Hospital Clínic of Barcelona (March 27, 2008), and written informed consent was obtained from all patients in accordance with the Declaration of Helsinki.
MicroRNA Extraction
Total RNA was isolated from frozen macrodissected tissues or needle aspirates using the miRNeasy Mini Kit (Qiagen, Valencia, CA), according to the manufacturer protocol. The final elution volume was 30 μL. RNA concentrations and purity were evaluated using NanoDrop 1000 Spectrophotometer (Wilmington, DE) and RNA quality was determined by Bioanalyzer 2100 (Agilent, CA).
Genome-wide miRNA Profiling by NGS
The starting amount was 1 μg of total RNA, and the preparation protocol was performed according to the manufacturer's recommendations. Small RNA was isolated from total RNA on a 15% Novex TBE-Urea PAGE gel. The area representing band size of 18 to 30 nucleotides (nt) was cut out and fragmented, RNA was eluted in 0.3 M NaCl and purified on a Spin X column. The 5′-adapter was ligated for 6 hours at 20°C. Small RNA with ligated 5′-adapter was isolated on a 15% Novex TBE-Urea PAGE gel (Invitrogen, CA). The 40 to 60 nt band was cut out and fragmented, RNA was eluted in 0.3 M NaCl and purified on a Spin X column. The 3′-adapter was ligated for 6 hours at 20°C. Small RNAs with ligated 5′ and 3′-adapters were isolated on a 10% Novex TBE-Urea PAGE gel, the 70 to 90 nt band was cut out and fragmented, RNA was eluted in 0.3 M NaCl and cleaned on a Spin X column. GlycoBlue and ethanol were added followed by precipitation for 30 minutes at −80°C and centrifugation at 14,000 rpm for 25 minutes. RNA pellet was dissolved in 4.5 μL RNase free water. Reverse transcription (RT) and amplification was done, and cDNA was separated on a 6% Novex tris-borate-EDTA/polyacrylamide gel electrophoresis. The amplified cDNA band was cut out and fragmented; cDNA was eluted in Gel Elution Buffer and purified on a Spin X column. Then, glycogen and ethanol were added for precipitation followed by centrifugation at 14,000 rpm and 4°C for 20 minutes. The cDNA pellet was dissolved in 10 μL resuspension buffer. The cDNA library generated was evaluated with a quantitative real-time PCR to ensure acceptable quality and confirm that adapters were correctly added. The high-throughput sequencing of the cDNA was done in a 38 bp single-end read run on an Illumina Genome Analyzer IIx (Illumina, CA). Image analysis and base calling was performed with the Illumina GA pipeline software version 1.5.1.
Analysis of miRNA Expression by Real-time qRT-PCR
The expression of the most discriminating miRNAs identified in the high-throughput sequencing was assessed by singleplex qRT-PCR using TaqMan miRNA Assays (Applied Biosystems Inc., Foster City, CA). A 2-step protocol involves RT with a miRNA-specific primer, followed by a real-time PCR with TaqMan probes. Briefly, 5 ng total RNA was used per RT reaction performed in final volume of 7.5 μL [2.5 μL RNA, 0.075 μL of 100 mM dNTPs, 0.5 μL of multiscribe reverse transcriptase (50 U/μL), 0.75 μL of 10× RT buffer, 0.095 μL of RNase inhibitor (20 U/μL), 1.5 μL stem-loop RT primer, and 2.08 μL nuclease-free water] and incubated for: 30 minutes, 16°C; 30 minutes, 42°C; 5 minutes, 85°C; hold at 4°C. The 10 μL PCR mixture included 2 μL cDNA, 5 μL of TaqMan 2X Universal PCR Master Mix with no AmpErase UNG, and 0.5 μL of TaqMan 20× miRNA assay. PCR reactions were incubated in a 384-well optical plate and run on the Viia7 Real-Time PCR System (Applied Biosystems Inc.) as follows: 95°C for 10 minutes and 50 cycles of 95°C for 15 seconds and 60°C for 1 minute. All specimens were amplified in duplicates. Amplification data were normalized against RNU6B as endogenous control. Ct values were calculated from automatic threshold. No template controls showed any amplification. Relative expression levels of selected miRNAs were calculated for each sample as −ΔCt values [−ΔCt = −(Ct of target miRNA − Ct of endogenous control miRNA)].
Data Analysis
Data from the high-throughput sequencing were obtained in FASTQ format, 1 data file per sequencing lane. The sequencing adaptors were subsequently clipped and removed using the FASTX-Toolkit, allowing no mismatches for adaptor identification. The remaining sequencing data were collapsed and counted into groups of identical sequences. The sequencing data were processed with miRDeep2 to identify miRs from the miRBase (release 18) data repository.20 It also evaluates sequence alignment to other entities through the databases RefSeq and Rfam. Sequence data were aligned to the Homo sapiens hg18 genome reference allowing for 1 mismatch.
Differential expression (DE) of identified miRs from miRBase was calculated with R version 2.13.0 using DESeq package 1.4.1 available in Bioconductor version 2.8.21 The count data were normalized to the estimated size factors and differential expression [fold change (FC)] of known miRs was analyzed between groups, as the ratio between normalized count data for tumor and normal samples. P values are adjusted for multiple testing by Benjamini and Hochberg method. Only miRs showing a fold change with false discovery rate (FDR) <0.05 are considered significant.
Between-group analysis (BGA) method visualizes high-dimensional data (such as multiple expression measurements) in a 2D graph in which the areas delimited by the ellipses represent 95% of the estimated binormal distribution of the sample scores on the first and second axes. Venn diagrams considered as a hit only significant miRs (VennCounts and VennDiagram from LIMMA package). Quantitative variables were analyzed using Student t test. A 2-sided P value <0.05 was regarded as significant. Evaluation of predictability of individual miRNAs, adjusted by age and sex, were calculated using logistic regression (GLM binomial distribution). ROC analysis plots and derived cut points, and also overall discriminative accuracy parameters, were computed using pROC R-package considering each miRNA expression as a continuous variable. Sensitivity and specificity were calculated from the optimum cut point associated with the minimum distance between ROC curve and upper left corner.
RESULTS
MicroRNA Expression Profile Analyzed by NGS Discriminates Between IPMN, PDAC, and Normal Pancreas
We first analyzed the miRNome of 11 PDAC, 4 IPMN, and 3 normal pancreatic tissues using the Genome Analyzer (Illumina). By performing NGS in these 18 samples, we found a total of 1733 miRNAs. Expression profiles of 50 miRNAs with the highest significant fold-change between PDAC patients and healthy individuals are depicted in Figure 2A, and the 50 most significantly deregulated in IPMN versus normal pancreas are represented in Figure 2B. BGA graph was then performed to visually represent the proximity between patients suffering from PDAC or IPMN and controls, according to miRNA expression. As shown in Figure 2C, miRNA expression profiles of NGS-sequenced samples can classify PDAC, IPMN, and C groups.
FIGURE 2.
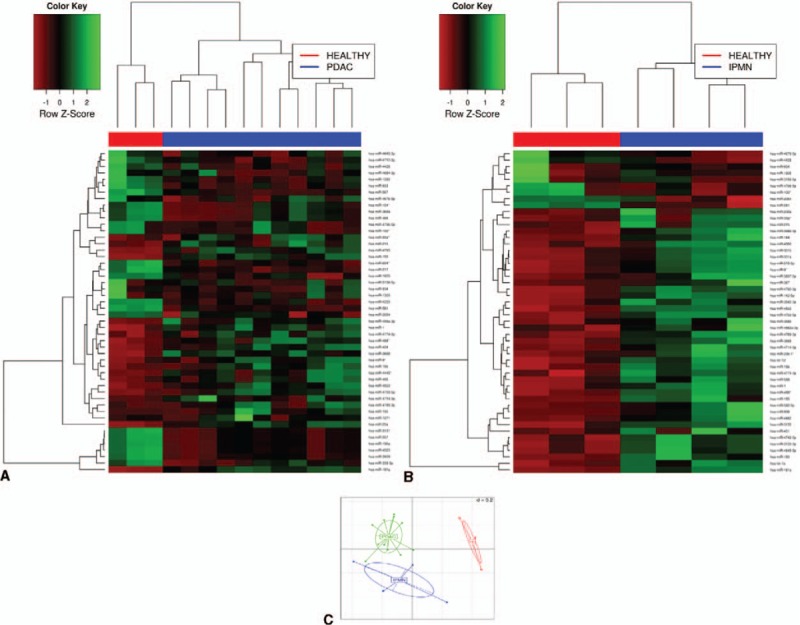
Differential miRNA expression by NGS between PDAC and healthy tissue (A), and between IPMN and healthy (B). Heatmap showing the top 50 significantly deregulated miRNAs with the highest FC differences. Green pixels correspond to an increased abundance of miRNA in the indicated sample, whereas red pixels indicate decreased miRNA levels. C, Between-group analysis (BGA) plot showing sample clustering based on miRNA expression profiling.
Employing DESeq package for an initial comparative analysis, we found 607 and 396 miRNAs significantly deregulated (FDR <0.05) in PDAC and IPMN when compared with controls, respectively. In addition, both PDAC and IPMN shared 325 miRNAs significantly deregulated (Figure 3A). Of these commonly deregulated miRNAs, 107 had a fold change more than 2 and mean counts over 400. Next, to carry out further experimental validation, we took into account those miRNAs with a maximum interquartile range (IQR) logarithm of 1.4 to ensure less intragroup dispersion. A total of 40 miRNAs met all above-mentioned criteria (ie, FDR <0.05, FC >2, mean counts >400, and intragroup IQR of log expression ≤1.4), and were, therefore, commonly up-regulated in both PDAC and IPMN (Table 1). The volcano plot of NGS data in Figure 3B graphically depicts the results of differential miRNA expression analysis. In conclusion, NGS data resulted in the identification of several miRNAs capable of discriminating the premalignant lesion IPMN from normal pancreas, PDAC tissue from normal pancreas, and also between IPMN and PDAC.
FIGURE 3.
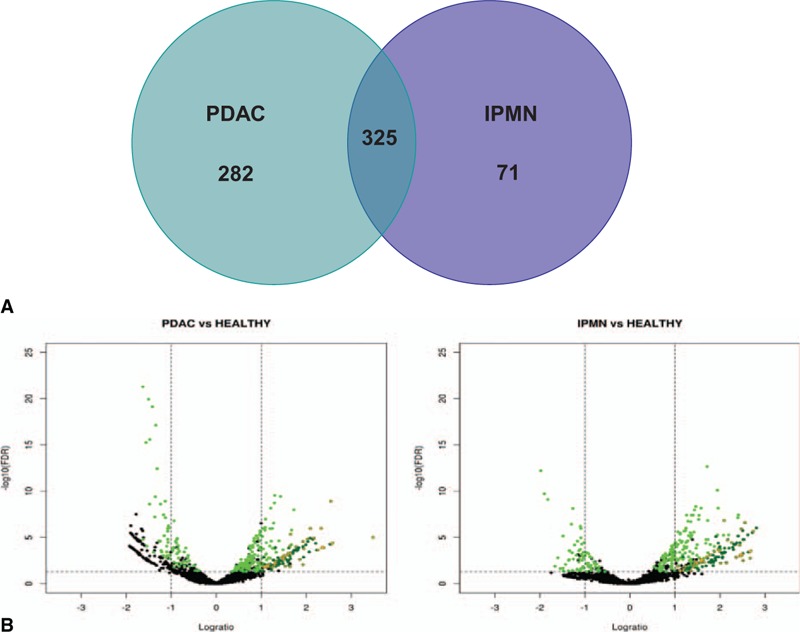
PDAC and IPMN specimens share common deregulated microRNAs. A, Venn diagram showing the number of significantly deregulated miRNAs in PDAC and/or IPMN, compared with controls. B, Volcano plot of NGS data. Green: miRNA commonly deregulated in PDAC and IPMN groups (FDR < 0.05). Dark green: miRNA strongly up-regulated (FC >2, FDR <0.05, and mean counts across all samples >400) in PDAC and IPMN groups. Orange crosses: miRNA selected for validation by qRT-PCR in set 1.
TABLE 1.
List of 40 Highly Discriminating MicroRNAs Between PDAC or IPMN and Healthy Tissues
| Discovery Phase (NGS) | Set 1 (qRT-PCR) | Set 2 (qRT-PCR) | ||||||||||
| MicroRNA | FC PDAC vs C | FDR PDAC vs C | FC IPMN vs C | FDR IPMN vs C | FC PDAC vs C | FDR PDAC vs C | FC IPMN vs C | FDR IPMN vs C | FC PDAC vs C | FDR PDAC vs C | FC IPMN vs C | FDR IPMN vs C |
| hsa-let-7c | 3.80 | 9.1E-03 | 6.37 | 1.8E-03 | 2.09 | 8.1E-02 | 2>87 | 2.0E-02 | −1.10 | 1.4E-01 | 3.45 | 2.5E-03 |
| hsa-let-7e | 4.08 | 1.5E-05 | 3.97 | 3.1E-04 | 2.33 | 1.1E-02 | 2.55 | 2.9E-02 | 3.94 | 4.5E-06 | 5.06 | 2.0E-03 |
| hsa-let-7f | 2.89 | 1.3E-02 | 5.58 | 6.3E-04 | 2.86 | 9.2E-03 | 3.61 | 2.8E-02 | 6.72 | 1.0E-07 | 6.21 | 1.1E-03 |
| hsa-miR-103a | 2.80 | 2.3E-03 | 3.13 | 4.8E-03 | 6.21 | 3.8E-03 | 5.49 | 2.3E-02 | 31.36 | 1.0E-10 | 20.06 | 2.5E-04 |
| hsa-miR-1257 | 3.03 | 5.4E-04 | 3.02 | 3.7E-03 | 3.51 | 2.3E-02 | 2.08 | 3.3E-01 | 23.13 | 5.8E-07 | 4.30 | 4.7E-02 |
| hsa-miR-1304 | 5.12 | 1.2E-04 | 5.54 | 7.1E-04 | 1.81 | 1.1E-01 | 1.71 | 2.9E-01 | 6.36 | 2.3E-07 | 4.24 | 3.8E-02 |
| hsa-miR-151a-5p | 2.10 | 1.6E-02 | 3.05 | 2.5E-03 | 2.99 | 5.2E-03 | 3.49 | 1.8E-02 | 5.47 | 1.5E-08 | 5.28 | 1.5E-03 |
| hsa-miR-151b | 2.25 | 8.5E-03 | 3.27 | 1.2E-03 | 2.87 | 9.1E-03 | 3.70 | 2.4E-02 | 6.81 | 1.9E-09 | 5.28 | 9.8E-04 |
| hsa-miR-155 | 4.25 | 1.1E-06 | 3.67 | 3.3E-04 | 11.80 | 3.3E-03 | 5.37 | 2.5E-02 | 14.49 | 4.7E-10 | 10.62 | 2.7E-04 |
| hsa-miR-16 | 2.06 | 1.5E-02 | 2.83 | 5.0E-03 | 4.86 | 9.7E-03 | 5.14 | 6.4E-02 | 79.68 | 6.2E-13 | 17.78 | 7.8E-04 |
| hsa-miR-181a | 5.83 | 1.2E-09 | 5.88 | 2.5E-07 | 8.00 | 5.0E-03 | 6.69 | 1.6E-02 | 7.09 | 3.8E-10 | 5.77 | 2.2E-04 |
| hsa-miR-181b | 3.00 | 8.2E-04 | 2.66 | 1.4E-02 | 41.51 | 9.9E-03 | 88.28 | 5.1E-02 | 4.57 | 2.1E-08 | 4.82 | 3.3E-04 |
| hsa-miR-192 | 3.11 | 1.5E-02 | 4.41 | 5.8E-03 | 1.79 | 1.7E-01 | 4.64 | 2.6E-02 | 8.37 | 2.5E-08 | 4.51 | 1.6E-02 |
| hsa-miR-21 | 11.18 | 9.8E-06 | 5.70 | 3.3E-03 | 7.84 | 8.9E-04 | 4.61 | 2.5E-02 | 10.20 | 5.5E-09 | 8.35 | 9.2E-04 |
| hsa-miR-221 | 3.62 | 2.3E-03 | 4.04 | 6.0E-03 | 4.09 | 2.5E-03 | 3.23 | 3.7E-02 | 6.56 | 1.5E-09 | 5.38 | 2.3E-03 |
| hsa-miR-23a | 5.03 | 1.0E-06 | 4.79 | 3.6E-05 | 4.25 | 4.9E-03 | 2.67 | 3.7E-02 | 4.79 | 5.5E-08 | 6.07 | 5.9E-04 |
| hsa-miR-29a | 2.14 | 1.3E-02 | 3.44 | 7.8E-04 | 2.54 | 5.4E-03 | 2.67 | 3.5E-02 | 2.19 | 1.9E-03 | 2.91 | 8.4E-03 |
| hsa-miR-3120–3p | 4.49 | 1.2E-05 | 6.68 | 2.2E-06 | 4.75 | 3.4E-02 | 4.91 | 9.2E-02 | 99.28 | 3.3E-11 | 5.22 | 7.3E-02 |
| hsa-miR-3133 | 3.80 | 2.7E-05 | 5.56 | 1.2E-06 | 1.79 | 7.4E-02 | 3.22 | 1.0E-01 | 3.51 | 5.9E-06 | 1.43 | 7.8E-02 |
| hsa-miR-3145–3p | 5.90 | 5.0E-05 | 6.33 | 3.6E-04 | −1.64 | 7.3E-01 | 1.27 | 7.0E-01 | n/a | n/a | n/a | n/a |
| hsa-miR-320a | 2.37 | 1.6E-02 | 2.55 | 3.7E-02 | 7.65 | 4.7E-03 | 9.03 | 2.4E-02 | 11.40 | 1.3E-11 | 7.52 | 1.2E-03 |
| hsa-miR-33a-3p | 3.14 | 4.5E-06 | 4.26 | 1.5E-07 | 1.84 | 4.6E-02 | 2.46 | 3.6E-02 | 5.04 | 1.4E-06 | 5.14 | 3.1E-03 |
| hsa-miR-3692 | 3.41 | 9.7E-05 | 4.49 | 1.8E-05 | 1.79 | 4.9E-01 | 3.97 | 1.3E-01 | n/a | n/a | n/a | n/a |
| hsa-miR-3714 | 2.49 | 4.1E-03 | 2.66 | 9.1E-03 | 1.76 | 5.4E-02 | −1.07 | 9.1E-01 | 3.58 | 2.0E-06 | 1.03 | 2.0E-01 |
| hsa-miR-4256 | 2.85 | 9.2E-04 | 2.78 | 6.2E-03 | −2.03 | 4.5E-01 | −1.30 | 8.2E-01 | n/a | n/a | n/a | n/a |
| hsa-miR-429 | 2.47 | 6.7E-03 | 2.70 | 4.6E-03 | 2.13 | 5.8E-02 | 4.82 | 3.6E-02 | 3.80 | 6.0E-05 | 5.12 | 7.0E-03 |
| hsa-miR-4313 | 2.18 | 1.2E-02 | 2.18 | 3.9E-02 | −1.20 | 6.0E-01 | 1.00 | 9.7E-01 | n/a | n/a | n/a | n/a |
| hsa-miR-4468 | 4.77 | 2.4E-04 | 5.15 | 1.5E-03 | 3.21 | 4.5E-02 | 1.77 | 2.6E-01 | 29.64 | 2.7E-11 | 1.85 | 1.1E-01 |
| hsa-miR-4639–5p | 5.08 | 1.3E-04 | 5.45 | 9.5E-04 | 3.13 | 4.7E-02 | 2.81 | 6.9E-02 | 71.10 | 6.5E-07 | 43.92 | 3.7E-03 |
| hsa-miR-4642 | 2.83 | 9.8E-04 | 3.02 | 2.9E-03 | −1.06 | 9.0E-01 | −1.05 | 9.5E-01 | n/a | n/a | n/a | n/a |
| hsa-miR-4666–3p | 3.10 | 8.9E-05 | 2.34 | 1.4E-02 | −1.01 | 9.2E-01 | −1.58 | 1.9E-01 | n/a | n/a | n/a | n/a |
| hsa-miR-4713–5p | 3.84 | 1.6E-04 | 5.42 | 6.9E-05 | 2.19 | 9.2E-02 | −1.69 | 6.3E-01 | 26.29 | 5.4E-11 | 2.51 | 1.1E-01 |
| hsa-miR-4714–5p | 3.14 | 4.8E-04 | 2.96 | 5.2E-03 | 5.31 | 4.5E-02 | 3.19 | 5.8E-01 | 20.42 | 4.8E-03 | 3.00 | 3.6E-02 |
| has-miR-4723–5p | 5.23 | 1.3E-04 | 5.56 | 9.5E-04 | 1.83 | 2.9E-01 | 1.67 | 1.6E-01 | n/a | n/a | n/a | n/a |
| has-miR-4770 | 5.99 | 3.9E-05 | 6.43 | 3.0E-04 | 1.68 | 9.2E-02 | −1.01 | 8.8E-01 | 10.49 | 4.7E-10 | 4.88 | 7.7E-03 |
| has-miR-4801 | 2.22 | 1.5E-02 | 2.29 | 2.6E-02 | 1.70 | 1.6E-01 | 1.63 | 3.1E-01 | n/a | n/a | n/a | n/a |
| has-miR-548d-3p | 2.44 | 1.1E-02 | 2.16 | 4.0E-02 | 8.16 | 1.2E-02 | 3.84 | 2.2E-01 | 419.19 | 1.1E-12 | 36.48 | 2.5E-03 |
| hsa-miR-616-5p | 2.84 | 1.7E-03 | 2.98 | 2.4E-03 | 1.39 | 1.9E-01 | 1.52 | 1.3E-01 | n/a | n/a | n/a | n/a |
| hsa-miR-761 | 2.00 | 6.2E-03 | 2.07 | 1.3E-02 | 2.19 | 8.8E-02 | 3.73 | 5.9E-02 | 3.13 | 1.4E-03 | 2.74 | 3.5E-02 |
| hsa-miR-93 | 2.75 | 1.4E-03 | 3.90 | 2.0E-04 | 6.59 | 5.9E-03 | 5.25 | 3.9E-02 | 77.77 | 3.8E-13 | 19.10 | 3.5E-04 |
MicroRNAs selected from NGS data and their values obtained in subsequent validation phases.
Validation of Tissue-based miRNA Expression by qRT-PCR Reproduced Most of the NGS Results
To confirm the NGS results, we first analyzed the expression of the 40 selected miRNAs by qRT-PCR in 52 samples from set 1 (24 PDAC, 7 IPMN, 6 CP, 15 C). We validated up-regulation of 31 miRNAs (23 with P < 0.05; 8 with P < 0.1) in PDAC samples and 24 miRNAs (18 with P < 0.05; 6 with P < 0.1) in IPMNs (Table 1). None of the 40 miRNAs analyzed by qRT-PCR showed a significant difference in expression between CP tissue and C (data not shown). For this reason, no CP samples were included in the following set.
Next, to corroborate the previous results, we employed qRT-PCR to further investigate the expression of 31 miRNAs validated in set 1 in an independent set of EUS-FNA pancreatic samples (set 2). Regarding PDAC samples, we confirmed the up-regulated expression pattern of all these miRNAs, except for let-7c, with P < 0.05 in 60 PDAC patients when compared with 26 C. Concerning the IPMN group (n = 9), we also confirmed 30 miRNAs as being overexpressed in comparison with 26 C (26 with P < 0.05 and 4 with P < 0.1), but in this group, the one that was not significantly up-regulated was miR-3714. The results from these experiments are shown in Table 1 and schematized in Figure 4. Supplementary Figure 1 depicts box plots of all miRNAs analyzed in set 2.
FIGURE 4.
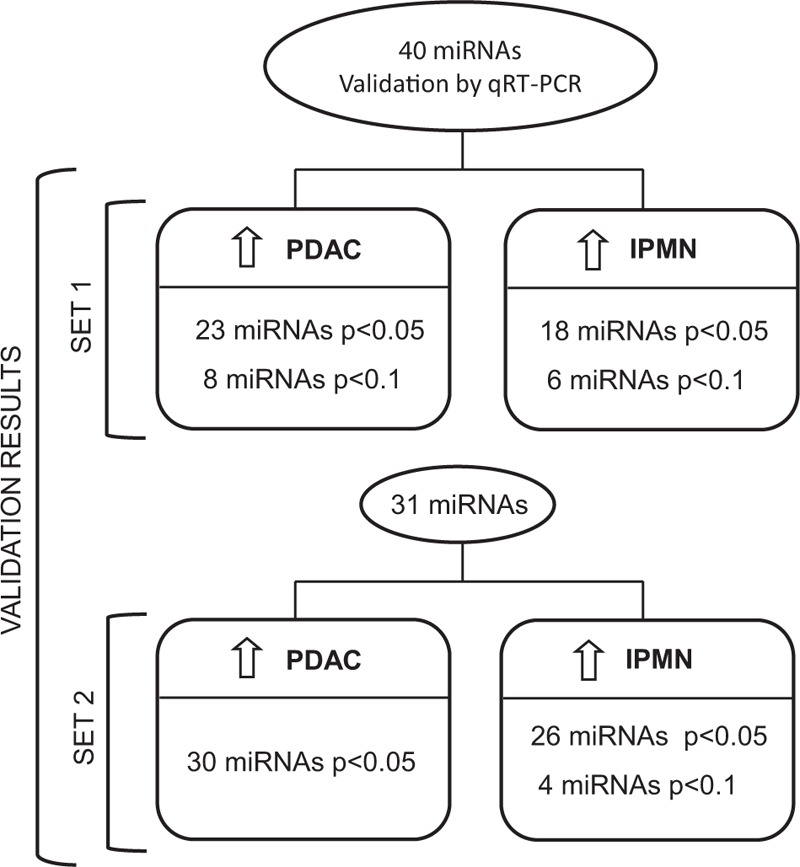
Workflow of study results. Number of miRNAs significantly overexpressed in PDAC and IPMN samples versus healthy pancreatic tissue in 2 independent set of samples.
Validated MiRNAs in EUS-FNA Samples Show High Accuracy to Discriminate Between Patients With PDAC or IPMN and Controls
Regarding the discriminatory capacity to distinguish PDAC patients from controls, the 30 miRNAs validated in set 2 presented areas under ROC curve (AUC) ranging from 0.69 [95% confidence interval (CI) 0.75–0.64] to 1 (95% CI 1–0.99). Specifically, 13 of these 30 miRNAs (miR-93, miR-16, miR-548d-3p, miR-320a, miR-4468, miR-3120–3p, miR-4713–5p, miR-103a, miR-155, miR-4770, miR-181a, miR-221, and miR-151b) demonstrated a high accuracy in discriminating PDAC patients from controls, with an AUC over 0.9 (Table 2). ROC analysis in the IPMN group demonstrated that miR-103a, miR-155, miR-181a, miR-181b, and miR-93 could discriminate IPMN from C, with an AUC over 0.9. All the other miRNAs validated had an AUC ranging from 0.68 (95% CI 0.79–0.58) to 0.92 (95% CI 0.98–0.86).
TABLE 2.
Receiver-operating Characteristic (ROC) Curve Analysis of All miRNAs Analyzed in Set 2
| MicroRNA | AUC (PDAC vs C) | 95% CI | P | Sensibility-specificity | PPV-NPV | AUC (IPMN vs C) | 95% CI | P | Sensibility-specificity | PPV-NPV |
| hsa.miR.93 | 0.995 | 1.00–0.99 | 3.78E-13 | 1.00–0.96 | 0.98–1.00 | 0.905 | 0.97–0.84 | 3.46E-04 | 0.89–0.88 | 0.72–0.96 |
| hsa.miR.16 | 0.991 | 1.00–0.98 | 6.18E-13 | 0.95–0.96 | 0.98–0.89 | 0.881 | 0.96–0.81 | 7.77E-04 | 0.89–0.80 | 0.61–0.95 |
| hsa.miR.548d.3p | 0.985 | 1.00–0.97 | 1.08E-12 | 0.93–0.96 | 0.98–0.86 | 0.843 | 0.93–0.76 | 2.47E-03 | 0.56–0.96 | 0.83–0.86 |
| hsa.miR.320a | 0.961 | 0.98–0.94 | 1.31E-11 | 0.90–0.92 | 0.96–0.80 | 0.867 | 0.95–0.79 | 1.18E-03 | 0.67–0.96 | 0.85–0.89 |
| hsa.miR.4468 | 0.954 | 0.97–0.93 | 2.73E-11 | 0.88–0.92 | 0.96–0.77 | 0.682 | 0.79–0.58 | 1.07E-01 | 0.78–0.60 | 0.40–0.89 |
| hsa.miR.3120.3p | 0.952 | 0.97–0.93 | 3.28E-11 | 0.92–0.88 | 0.95–0.82 | 0.703 | 0.81–0.60 | 7.31E-02 | 0.67–0.88 | 0.66–0.88 |
| hsa.miR.4713.5p | 0.947 | 0.97–0.93 | 5.38E-11 | 0.85–1.00 | 1.00–0.74 | 0.682 | 0.79–0.58 | 1.08E-01 | 0.56–0.84 | 0.55–0.85 |
| hsa.miR.103a | 0.940 | 0.96–0.92 | 1.04E-10 | 0.90–0.88 | 0.95–0.79 | 0.914 | 0.98–0.85 | 2.53E-04 | 0.78–0.96 | 0.87–0.93 |
| hsa.miR.181a | 0.927 | 0.95–0.90 | 3.82E-10 | 0.92–0.88 | 0.95–0.82 | 0.919 | 0.98–0.86 | 2.18E-04 | 0.78–0.96 | 0.87–0.93 |
| hsa.miR.155 | 0.925 | 0.95–0.90 | 4.65E-10 | 0.97–0.85 | 0.94–0.92 | 0.912 | 0.98–0.85 | 2.70E-04 | 1.00–0.69 | 0.53–1.00 |
| hsa.miR.4770 | 0.925 | 0.95–0.90 | 4.69E-10 | 0.97–0.85 | 0.94–0.92 | 0.802 | 0.89–0.71 | 7.72E-03 | 0.78–0.88 | 0.69–0.92 |
| hsa.miR.221 | 0.912 | 0.94–0.88 | 1.53E-09 | 0.85–0.88 | 0.94–0.72 | 0.846 | 0.93–0.76 | 2.26E-03 | 0.67–0.96 | 0.85–0.89 |
| hsa.miR.151b | 0.910 | 0.94–0.88 | 1.87E-09 | 0.83–0.88 | 0.94–0.69 | 0.873 | 0.95–0.80 | 9.81E-04 | 0.89–0.76 | 0.56–0.95 |
| hsa.miR.21 | 0.897 | 0.93–0.87 | 5.52E-09 | 0.83–0.88 | 0.94–0.69 | 0.875 | 0.95–0.80 | 9.21E-04 | 0.67–0.96 | 0.85–0.89 |
| hsa.miR.151.5p | 0.886 | 0.92–0.85 | 1.49E-08 | 0.75–0.92 | 0.96–0.61 | 0.860 | 0.94–0.78 | 1.48E-03 | 0.78–0.88 | 0.69–0.92 |
| hsa.miR.181b | 0.882 | 0.92–0.85 | 2.06E-08 | 0.90–0.77 | 0.90–0.77 | 0.907 | 0.97–0.84 | 3.25E-04 | 0.89–0.80 | 0.61–0.95 |
| hsa.miR.192 | 0.880 | 0.91–0.85 | 2.52E-08 | 0.81–0.88 | 0.94–0.67 | 0.772 | 0.87–0.68 | 1.63E-02 | 1.00–0.46 | 0.39–1.00 |
| hsa.miR.23a | 0.871 | 0.91–0.83 | 5.48E-08 | 0.77–0.92 | 0.96–0.63 | 0.889 | 0.96–0.82 | 5.92E-04 | 0.89–0.88 | 0.72–0.96 |
| hsa.miR.let.7f | 0.863 | 0.90–0.83 | 1.01E-07 | 0.85–0.85 | 0.93–0.71 | 0.868 | 0.95–0.79 | 1.14E-03 | 0.89–0.84 | 0.66–0.96 |
| hsa.miR.1304 | 0.853 | 0.89–0.81 | 2.31E-07 | 0.93–0.77 | 0.90–0.83 | 0.734 | 0.84–0.63 | 3.84E-02 | 0.67–0.72 | 0.45–0.86 |
| hsa.miR.1257 | 0.841 | 0.88–0.80 | 5.78E-07 | 0.67–0.92 | 0.95–0.54 | 0.725 | 0.83–0.62 | 4.72E-02 | 0.44–0.96 | 0.79–0.83 |
| hsa.miR.4639.5p | 0.839 | 0.88–0.80 | 6.49E-07 | 0.80–0.77 | 0.89–0.62 | 0.829 | 0.92–0.74 | 3.72E-03 | 0.78–0.80 | 0.57–0.91 |
| hsa.miR.33a. | 0.829 | 0.87–0.79 | 1.36E-06 | 0.63–0.92 | 0.95–0.52 | 0.835 | 0.92–0.75 | 3.12E-03 | 0.78–0.80 | 0.57–0.91 |
| hsa.miR.3714 | 0.824 | 0.87–0.78 | 2.01E-06 | 0.85–0.69 | 0.86–0.66 | 0.644 | 0.75–0.54 | 2.04E-01 | 0.88–0.42 | 0.34–0.91 |
| hsa.miR.let.7e | 0.813 | 0.86–0.77 | 4.52E-06 | 0.81–0.77 | 0.89–0.64 | 0.850 | 0.93–0.77 | 2.00E-03 | 0.89–0.84 | 0.66–0.96 |
| hsa.miR.3133 | 0.809 | 0.85–0.76 | 5.89E-06 | 0.83–0.65 | 0.85–0.63 | 0.700 | 0.80–0.60 | 7.78E-02 | 0.56–0.80 | 0.49–0.84 |
| hsa.miR.1181 | 0.790 | 0.84–0>74 | 2.16E-05 | 0.76–0.73 | 0.87–0.57 | 0.647 | 0.76–0.54 | 1.93E-01 | 0.88–0.46 | 0.36–0.91 |
| hsa.miR.429 | 0.773 | 0.82–0.72 | 6.05E-05 | 0.53–0.92 | 0.94–0.46 | 0.805 | 0.90–0.71 | 6.99E-03 | 0.67–0.84 | 0.59–0.88 |
| hsa.miR.761 | 0.718 | 0.77–0.66 | 1.40E-03 | 0.64–0.77 | 0.87–0.48 | 0.738 | 0.84–0.64 | 3.55E-02 | 0.67–0.80 | 0.54–0.87 |
| hsa.miR.29a | 0.712 | 0.77–0.66 | 1.91E-03 | 0.63–0.73 | 0.84–0.46 | 0.799 | 0.89–0.71 | 8.37E-03 | 0.67–0.92 | 0.74–0.89 |
| hsa.miR.4714.5p | 0.693 | 0.75–0.64 | 4.76E-03 | 0.84–0.58 | 0.82–0.62 | 0.749 | 0.85–0.64 | 3.58E-02 | 1.00–0.50 | 0.38–1.00 |
| hsa.miR.let.7c | 0.601 | 0.66–0.54 | 1.40E-01 | 0.85–0.38 | 0.76–0.52 | 0.842 | 0.93–0.76 | 2.52E-03 | 0.89–0.80 | 0.61–0.95 |
Figure 5 shows ROC curves of 8 miRNAs with the highest discriminative capacity for PDAC patients. Finally, it is worth highlighting the performance of miR-93, which is a single tissue-based miRNA significantly altered in PDAC with an excellent sensitivity and specificity to differentiate cancerous tissue from normal pancreas.
FIGURE 5.
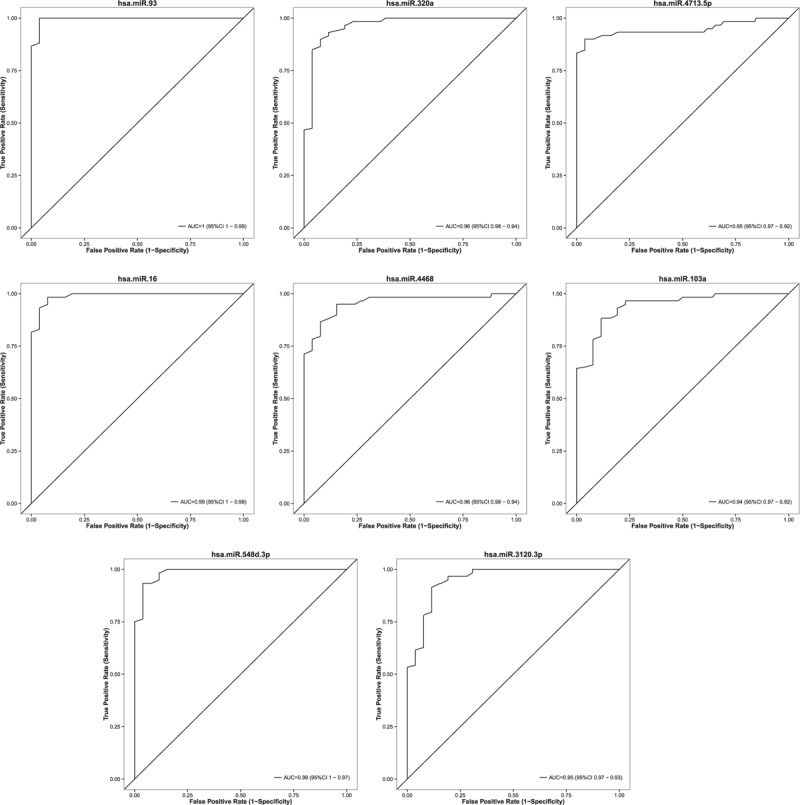
Receiver-operating characteristic (ROC) curves of 8 miRNAs, based on results obtained by qRT-PCR in set 2, illustrating high discriminatory power for PDAC patients.
DISCUSSION
In this study, we have conducted genome-wide miRNA profiling by NGS in a group of pancreatic samples including PDAC, IPMN, and normal pancreas. Our results show that tissue-based miRNA expression can discriminate between PDAC patients and control subjects and between patients with the precursor lesion IPMN and control individuals. To our knowledge, this is one of the first reports applying massive parallel sequencing for biomarker discovery in the context of pancreatic cancer. Recently, another study used NGS to characterize the coding and noncoding transcriptome of tissues from 6 PDACs and 5 C, but not IPMN, and reported a new long ncRNA, small ncRNA, and mRNA signature of PDAC.22 Out of the 4 miRNAs that they validate, there is only 1 which is also coincident in our study, miR-103a. In contrast, our high-throughput analysis has allowed the identification of a large number of putative miRNA biomarkers useful to detect patients harboring PDAC or IPMN. In addition, we have validated in 2 different groups of samples the expression pattern of 30 miRNAs, thus confirming their capacity of differentiating PDAC or IPMN from controls. Some of these miRNAs represent novel biomarkers, not previously reported. Finally, we have defined the best miRNA-based predictors able to discriminate PDAC and IPMN patients with high accuracy.
The first association of miRNAs and cancer came from a study of Calin et al23 in which they characterized chromosome 13q14 in chronic lymphocytic leukemia (CLL) and showed that miR-15 and miR-16 are deleted or down-regulated in about 70% of CLL cases. Since then, altered expression of miRNAs has been described in several human cancers such as those of breast, lung, esophagus, prostate, and pancreas, among others.24 Lu et al25 carried out a systematic analysis of 217 miRNAs from 334 leukemias and solid cancers, and found that miRNA-expression profiles classify human cancers according to the developmental lineage and differentiation state of the tumors. In agreement with this, our genome-wide miRNome analysis has shown that PDAC, IPMN, and normal pancreatic tissue have a differential miRNA profile.
In recent years, some studies focusing on large-scale profiles of miRNAs in pancreatic tissues have identified, mainly by microarrays, qRT-PCR cards, or Genechips, a number of differentially expressed miRNAs. Despite differences in measurement platforms, lab protocols, and sample sizes between previous reports and our study, we have been able to confirm published results from different studies. Among those 30 miRNAs validated by qRT-PCR, we have found concordant expression of previously reported miRNAs altered in PDAC tissue (ie, up-regulation of miR-103a, miR-151a-5p, miR-155, miR-16, miR-181a, miR-181b, miR-192, miR-21, miR-221, miR-23a, miR-29a, miR-429, and miR-93),16,24,26–29 but we have also identified several new miRNAs that are significantly up-regulated in PDAC (miR-320a, let-7e, let-7f, miR-1257, miR-1304, miR-151b, miR-3120–3p, miR-3133, miR-33a∗, miR-3714, miR-4468, miR-4639–5p, miR-4713–5p, miR-4714–5p, miR-4770, miR-548d-3p, and miR-761). These results shed light on the pathogenesis of pancreatic cancer identifying new markers with potential diagnostic or therapeutic value.
Furthermore, due to the increasing incidence of IPMN and its associated high risk for malignancy, we also investigated the miRNome of IPMNs to identify candidate miRNAs for the detection of both pancreatic neoplasia. It would be interesting if we could confirm the deregulated expression of these miRNAs in biological fluids and use them as noninvasive biomarkers in a screening setting, with the aim of detecting patients suffering from PDAC or presenting a high risk of developing it. So far, very few studies have analyzed miRNA expression in IPMN. Habbe et al30 demonstrated significant overexpression of 10 miRNAs previously described as up-regulated in pancreatic cancer. Matthaei el al31 and Lubezky et al32 showed that certain miRNAs have a different expression level in low-grade versus high-grade IPMNs, which may be used as markers for invasiveness. Our NGS results have demonstrated that PDAC and IPMN lesions share 325 significantly deregulated miRNAs, thus indicating that aberrant miRNA expression occurs early in the pancreatic cancer development. It is significant to highlight that almost all PDACs used for the discovery phase are stage I and II to analyze miRNAs aberrantly expressed in the early stages of the neoplasia. From the 30 miRNAs validated as significantly up-regulated in IPMNs, 6 had already been described (ie, miR-155, miR-16, miR-181a, miR-21, miR-221, and miR-93).30–33 However, the other 24 miRNAs found deregulated in IPMN had not been previously reported.
Taken all together, we have corroborated the same expression profile of 30 miRNAs in 3 different cohorts (discovery, set 1, and set 2) and different types of samples. We have observed that the differential miRNA profile in surgical tissues correlates well with the one in EUS-FNA samples. Consequently, this study underlines the feasibility of detecting miRNAs in FNAa. This is important because miRNA analysis in FNAs could aid in the pathologic evaluation of suspicious cases and may provide a new strategy for improving the diagnosis of pancreatic diseases. Moreover, it could be used for the prognosis and prediction of response to treatment in unresectable cases. In this regard, Szafranska et al34 reported that miRNA analysis from fresh pancreatic FNA biopsies could differentiate malignant from benign tissues.
It is remarkable to point out the high discriminative accuracy for PDAC of miR-93, miR16, miR-548d-3p, and miR-320a with AUC over 0.95 in set 2. Their performance in set 1, even though presenting AUC over 0.8, is not as accurately as in set 2 owing to differences in the clinical characteristics of the patients. Functional analyses of miR-93, our most discriminative miRNA, have been reported in other cancers. In breast carcinoma, miR-93 functions as an oncogene by regulating tumor suppressor LATS235 and NRF2.36 In nasopharyngeal carcinoma, it promotes cell growth and invasion by targeting Dab2.37 MiR-93 may inhibit epithelial ovarian cancer tumorigenesis through regulation of RhoC38 and suppresses colorectal cancer development via Smad7.39 Based on our results, it would also be relevant to elucidate miR-93 function in the context of PDAC.
In summary, this study contributes to better understand the pancreatic carcinogenesis and molecular knowledge of IPMN lesions through the analysis of their miRNome. This can serve as the basis for development of new therapeutic targets. Finally, more specifically, the present study identifies a large group of novel miRNA-based biomarkers for the diagnosis of pancreatic neoplasia. However, larger prospective multicenter studies should be pursued to assure our results. The tissue biomarkers we have found represent a valuable background for identifying new noninvasive molecules in body fluids with a potential to early detect pancreatic neoplasia.
ACKNOWLEDGMENT
We are indebted to the Biobank core facility of the IDIBAPS.
Supplementary Material
Footnotes
E.V.-N. and M.V.-C. contributed equally to this work.
Source of funding: The present work was supported by grants from Instituto de Salud Carlos III (PI10/02888 and PI13/02192, co-funded by FEDER-European Union) and Fundación Mutua Madrileña to MG, and Fundación Científica de la Asociación Española contra el Cáncer (GCB13131592CAST) and Ministerio de Economía y Competitividad (SAF2014–54453-R) to AC. CIBEREHD is funded by the Instituto de Salud Carlos III. This work was developed at the Centro Esther Koplowitz, Barcelona, Spain. MV-C is funded by Ministerio de Educación Cultura y Deporte (FPU12/05138).
Conflicts of interest: There are no other conflicts of interest to disclose.
REFERENCES
- 1.American Cancer Society. Cancer Facts and Figures 2013. Atlanta: American Cancer Society; 2013. [Google Scholar]
- 2.Stathis A, Moore MJ. Advanced pancreatic carcinoma: current treatment and future challenges. Nat Rev Clin Oncol 2010; 7:163–172. [DOI] [PubMed] [Google Scholar]
- 3.Raimondi S, Maisonneuve P, Lowenfels AB. Epidemiology of pancreatic cancer: an overview. Nat Rev Gastroenterol Hepatol 2009; 6:699–708. [DOI] [PubMed] [Google Scholar]
- 4.Hezel AF, Kimmelman AC, Stanger BZ, et al. Genetics and biology of pancreatic ductal adenocarcinoma. Genes Dev 2006; 20:1218–1249. [DOI] [PubMed] [Google Scholar]
- 5.Costello E, Greenhalf W, Neoptolemos JP. New biomarkers and targets in pancreatic cancer and their application to treatment. Nat Rev Gastroenterol Hepatol 2012; 9:435–444. [DOI] [PubMed] [Google Scholar]
- 6.Seufferlein T, Bachet JB, Van Cutsem E, et al. Pancreatic adenocarcinoma: ESMO-ESDO Clinical Practice Guidelines for diagnosis, treatment and follow-up. Ann Oncol 2012; 23 Suppl 7:vii33–vii40. [DOI] [PubMed] [Google Scholar]
- 7.Andrejevic-Blant S, Kosmahl M, Sipos B, et al. Pancreatic intraductal papillary-mucinous neoplasms: a new and evolving entity. Virchows Arch 2007; 451:863–869. [DOI] [PMC free article] [PubMed] [Google Scholar]
- 8.Vilmann P, Saftoiu A. Endoscopic ultrasound-guided fine needle aspiration biopsy: equipment and technique. J Gastroenterol Hepatol 2006; 21:1646–1655. [DOI] [PubMed] [Google Scholar]
- 9.Bartel DP. MicroRNAs: genomics, biogenesis, mechanism, and function. Cell 2004; 116:281–297. [DOI] [PubMed] [Google Scholar]
- 10.Esteller M. Non-coding RNAs in human disease. Nat Rev Genet 2011; 12:861–874. [DOI] [PubMed] [Google Scholar]
- 11.Di Leva G, Garofalo M, Croce CM. MicroRNAs in cancer. Annu Rev Pathol 2014; 9:287–314. [DOI] [PMC free article] [PubMed] [Google Scholar]
- 12.Esquela-Kerscher A, Slack FJ. Oncomirs: microRNAs with a role in cancer. Nat Rev Cancer 2006; 6:259–269. [DOI] [PubMed] [Google Scholar]
- 13.Zhang Y, Li M, Wang H, et al. Profiling of 95 microRNAs in pancreatic cancer cell lines and surgical specimens by real-time PCR analysis. World J Surg 2009; 33:698–709. [DOI] [PMC free article] [PubMed] [Google Scholar]
- 14.Yu J, Li A, Hong SM, et al. MicroRNA alterations of pancreatic intraepithelial neoplasias. Clin Cancer Res 2012; 18:981–992. [DOI] [PMC free article] [PubMed] [Google Scholar]
- 15.Di Leva G, Croce CM. miRNA profiling of cancer. Curr Opin Genet Dev 2013; 23:3–11. [DOI] [PMC free article] [PubMed] [Google Scholar]
- 16.Jamieson NB, Morran DC, Morton JP, et al. MicroRNA molecular profiles associated with diagnosis, clinicopathologic criteria, and overall survival in patients with resectable pancreatic ductal adenocarcinoma. Clin Cancer Res 2012; 18:534–545. [DOI] [PubMed] [Google Scholar]
- 17.Giovannetti E, Funel N, Peters GJ, et al. MicroRNA-21 in pancreatic cancer: correlation with clinical outcome and pharmacologic aspects underlying its role in the modulation of gemcitabine activity. Cancer Res 2010; 70:4528–4538. [DOI] [PubMed] [Google Scholar]
- 18.Papaconstantinou IG, Manta A, Gazouli M, et al. Expression of microRNAs in patients with pancreatic cancer and its prognostic significance. Pancreas 2013; 42:67–71. [DOI] [PubMed] [Google Scholar]
- 19.Giovannetti E, van der Velde A, Funel N, et al. High-throughput microRNA (miRNAs) arrays unravel the prognostic role of MiR-211 in pancreatic cancer. PLoS One 2012; 7:e49145. [DOI] [PMC free article] [PubMed] [Google Scholar]
- 20.Friedlander MR, Chen W, Adamidi C, et al. Discovering microRNAs from deep sequencing data using miRDeep. Nat Biotechnol 2008; 26:407–415. [DOI] [PubMed] [Google Scholar]
- 21.Anders S, Huber W. Differential expression analysis for sequence count data. Genome Biol 2010; 11:R106. [DOI] [PMC free article] [PubMed] [Google Scholar]
- 22.Muller S, Raulefs S, Bruns P, et al. Next-generation sequencing reveals novel differentially regulated mRNAs, lncRNAs, miRNAs, sdRNAs and a piRNA in pancreatic cancer. Mol Cancer 2015; 14:94–112. [DOI] [PMC free article] [PubMed] [Google Scholar]
- 23.Calin GA, Dumitru CD, Shimizu M, et al. Frequent deletions and down-regulation of micro- RNA genes miR15 and miR16 at 13q14 in chronic lymphocytic leukemia. Proc Natl Acad Sci U S A 2002; 99:15524–15529. [DOI] [PMC free article] [PubMed] [Google Scholar]
- 24.Piepoli A, Tavano F, Copetti M, et al. Mirna expression profiles identify drivers in colorectal and pancreatic cancers. PLoS One 2012; 7:e33663. [DOI] [PMC free article] [PubMed] [Google Scholar]
- 25.Lu J, Getz G, Miska EA, et al. MicroRNA expression profiles classify human cancers. Nature 2005; 435:834–838. [DOI] [PubMed] [Google Scholar]
- 26.Bloomston M, Frankel WL, Petrocca F, et al. MicroRNA expression patterns to differentiate pancreatic adenocarcinoma from normal pancreas and chronic pancreatitis. JAMA 2007; 297:1901–1908. [DOI] [PubMed] [Google Scholar]
- 27.Szafranska AE, Davison TS, John J, et al. MicroRNA expression alterations are linked to tumorigenesis and non-neoplastic processes in pancreatic ductal adenocarcinoma. Oncogene 2007; 26:4442–4452. [DOI] [PubMed] [Google Scholar]
- 28.Lee EJ, Gusev Y, Jiang J, et al. Expression profiling identifies microRNA signature in pancreatic cancer. Int J Cancer 2007; 120:1046–1054. [DOI] [PMC free article] [PubMed] [Google Scholar]
- 29.Bauer AS, Keller A, Costello E, et al. Diagnosis of pancreatic ductal adenocarcinoma and chronic pancreatitis by measurement of microRNA abundance in blood and tissue. PLoS One 2012; 7:e34151. [DOI] [PMC free article] [PubMed] [Google Scholar]
- 30.Habbe N, Koorstra JB, Mendell JT, et al. MicroRNA miR-155 is a biomarker of early pancreatic neoplasia. Cancer Biol Ther 2009; 8:340–346. [DOI] [PMC free article] [PubMed] [Google Scholar]
- 31.Matthaei H, Wylie D, Lloyd MB, et al. miRNA biomarkers in cyst fluid augment the diagnosis and management of pancreatic cysts. Clin Cancer Res 2012; 18:4713–4724. [DOI] [PMC free article] [PubMed] [Google Scholar]
- 32.Lubezky N, Loewenstein S, Ben-Haim M, et al. MicroRNA expression signatures in intraductal papillary mucinous neoplasm of the pancreas. Surgery 2013; 153:663–672. [DOI] [PubMed] [Google Scholar]
- 33.Caponi S, Funel N, Frampton AE, et al. The good, the bad and the ugly: a tale of miR-101, miR-21 and miR-155 in pancreatic intraductal papillary mucinous neoplasms. Ann Oncol 2013; 24:734–741. [DOI] [PubMed] [Google Scholar]
- 34.Szafranska AE, Doleshal M, Edmunds HS, et al. Analysis of microRNAs in pancreatic fine-needle aspirates can classify benign and malignant tissues. Clin Chem 2008; 54:1716–1724. [DOI] [PMC free article] [PubMed] [Google Scholar]
- 35.Fang L, Du WW, Yang W, et al. MiR-93 enhances angiogenesis and metastasis by targeting LATS2. Cell Cycle 2012; 11:4352–4365. [DOI] [PMC free article] [PubMed] [Google Scholar]
- 36.Singh B, Ronghe AM, Chatterjee A, et al. MicroRNA-93 regulates NRF2 expression and is associated with breast carcinogenesis. Carcinogenesis 2013; 34:1165–1172. [DOI] [PMC free article] [PubMed] [Google Scholar]
- 37.Xu YF, Mao YP, Li YQ, et al. MicroRNA-93 promotes cell growth and invasion in nasopharyngeal carcinoma by targeting disabled homolog-2. Cancer Lett 2015; 363:146–155. [DOI] [PubMed] [Google Scholar]
- 38.Chen X, Chen S, Xiu YL, et al. RhoC is a major target of microRNA-93-5P in epithelial ovarian carcinoma tumorigenesis and progression. Mol Cancer 2015; 14:31–41. [DOI] [PMC free article] [PubMed] [Google Scholar]
- 39.Tang Q, Zou Z, Zou C, et al. MicroRNA-93 suppress colorectal cancer development via Wnt/beta-catenin pathway downregulating. Tumour Biol 2015; 36:1701–1710. [DOI] [PubMed] [Google Scholar]
Associated Data
This section collects any data citations, data availability statements, or supplementary materials included in this article.