Abstract
Background
Neonatal diarrhea accounts for more than 50% of total deaths in dairy calves. Few population‐based studies of cattle have investigated how the microbiota is impacted during diarrhea.
Objectives
To characterize the fecal microbiota and predict the functional potential of the microbial communities in healthy and diarrheic calves.
Methods
Fifteen diarrheic calves between the ages of 1 and 30 days and 15 age‐matched healthy control calves were enrolled from 2 dairy farms. The Illumina MiSeq sequencer was used for high‐throughput sequencing of the V4 region of the 16S rRNA gene (Illumina, San Diego, CA).
Results
Significant differences in community membership and structure were identified among healthy calves from different farms. Differences in community membership and structure also were identified between healthy and diarrheic calves within each farm. Based on linear discriminant analysis effect size (LEfSe), the genera Bifidobacterium, Megamonas, and a genus of the family Bifidobacteriaceae were associated with health at farm 1, whereas Lachnospiraceae incertae sedis, Dietzia and an unclassified genus of the family Veillonellaceae were significantly associated with health at farm 2. The Phylogenetic Investigation of Communities Reconstruction of Unobserved States (PICRUSt) analysis indicated that diarrheic calves had decreased abundances of genes responsible for metabolism of various vitamins, amino acids, and carbohydrate.
Clinical Relevance
The fecal microbiota of healthy dairy calves appeared to be farm specific as were the changes observed during diarrhea. The differences in microbiota structure and membership between healthy and diarrheic calves suggest that dysbiosis can occur in diarrheic calves and it is associated with changes in predictive metagenomic function.
Keywords: Bacterial species, Bifidobacterium, Epidemiology, Escherichia coli, Infectious diseases, LEfSe, Microbiology, PICRUSt
Abbreviations
- AMOVA
analysis of molecular variance
- FDR
false discovery rate
- HOMOVA
homogeneity of molecular variance analysis
- KEGG
Kyoto Encyclopedia of Genes and Genomes
- LEfSe
linear discriminant analysis effect size
- OTU
operational taxonomic units
- PICRUSt
Phylogenetic Investigation of Communities Reconstruction of Unobserved States
Neonatal calf diarrhea accounts for most of the morbidity and mortality in calves, accounting for >50% of total deaths, and has a large impact on the economy of dairy farms.1 Although pathogenic bacteria (Escherichia coli, Salmonella spp), viruses (rotavirus, coronavirus), and protozoa (Cryptosporidium spp) can be found in a large percentage of cases, the etiology of disease may be hard to discern because of the common presence of coinfections (>1 pathogen identified in the same patient)2 and the fact that most organism also can be found in healthy individuals. These observations suggest that the cause of diarrhea is complex rather than associated with a single pathogen. Diagnosis of enteric disease also is likely affected by the complexity of the microbiota (ie, the rich and diverse polymicrobial community present in the gut).
The gastrointestinal microbiota plays an important role in maintaining host health by providing vitamins and energy,3 by facilitating development of gut tissue and the immune system,4 by modulating inflammatory responses at local and distal organs,5 and by competing with pathogens for nutrients and attachment sites on the gut epithelial surface.6 Although traditional focus on calf diarrhea has been on individual pathogens, it has become increasingly clear in other species that microbial populations play a key role in health and disease. Disruption of this ecosystem, otherwise known as “dysbiosis,” can trigger gastrointestinal disorders.7 To date, the molecular basis of dysbiosis and the key bacterial groups involved remain poorly defined. It is clear however that if the gut microbiota is disrupted (eg, antibiotic treatment, gut inflammation) the risk of disease can increase substantially8, 9, 10 and re‐establishment of the normal microbiota can result in recovery from disease.11
Despite current attention and research on the gut microbiota, few population‐based studies have been conducted in cattle to better understand how the microbiota and its functional potential are impacted during neonatal diarrhea. Calf diarrhea may be associated with altered microbial diversity and decreased abundance of butyrate‐producing microorganisms during the first weeks of life.12 The gastrointestinal microbiota is a major contributor to the physiological, nutritional, and immunological functions of the gut. Therefore, the structure and functional roles of the microbiota in diarrheic calves should be examined in more detail. The objectives of our study were to profile the fecal microbiota and predict the functional potential of microbial communities in healthy calves and calves with diarrhea from 2 large dairy farms with dissimilar management practices.
Materials and Methods
Animals, Farms, and Study Design
This prospective study used a case‐control design. Holstein‐Friesen calves from 2 large dairy farms (F1 and F2) were enrolled during the spring season of 2015. Study farms were selected from a convenience sample of commercial farms within 120 km radius of the University of Guelph (Guelph, ON). On both farms, cows were vaccinated against bovine coronavirus and rotavirus 8 weeks and 4 weeks before calving.1 Calves were separated from their dams at birth and received 1 bolus containing antibodies against enterotoxigenic E. coli and bovine coronavirus.2 Farm details and management practices are presented in Table 1.
Table 1.
Farm characteristics and management practices
| Farm 1 | Farm 2 | |
|---|---|---|
| Breed | Holstein‐Friesen | Holstein‐Friesen |
| Calves per year | 700 | 1,000 |
| Type of housing | Group pen | Individual pen |
| Type of bedding | Sawdust | Shavings |
| Colostrum feeding | 4 L first 4 hour | 6 L first 6 hout |
| Diet (8–12 weeks) | Pasteurized milk | Milk replacer |
| Feeding method | Robot machine | Individual bucket |
| Diarrhea treatment protocol | TMS (1920 mg, PO, once) | SP (30 mg/kg, IM, q24 h/10d) |
| + | + | |
| CFT (2.2 mg/kg, SC, q24h/3d) | LCM (15 mg/kg, IM, q24h/10d) | |
| Or | + | |
| TMS* (16 mg/kg, IM, q24h/3d) | TMS (16 mg/kg, IM, q24h/5d) |
TMS, trimethoprim‐sulfamethazine; CFT, sodium ceftiofur; SP, spectinomycin; LCM, lincomycin; TMS*, trimethoprim‐sulfadoxine, PO, orally, SC, subcutaneously; IM, intramuscularly.
Fifteen diarrheic calves between the ages of 1 and 30 days, and 15 age‐matched healthy control calves were enrolled from each farm. Health status of the calves was assessed with a standardized calf health‐scoring chart.13 This system assisted the assessment of health by evaluating body temperature score (0, 1 = normal; 2, 3 = fever), fecal score (0, 1 = normal; 2, 3 = diarrhea), nasal score (0, 1 = normal; 2, 3 = nasal discharge), eye score (0, 1 = normal; 2, 3 = eye discharge, crusty eyes), and ear score (0, 1 = normal; 2, 3 = head tilt, 1 ear or both ears dropped). A diarrheic calf was defined as a calf with fecal and body temperature scores ≥2 and score ≤1 in the other evaluated systems. Once a diarrheic calf was identified, an age‐matched (±2 days) control calf with health score ≤1 in all of the evaluated systems was enrolled. Calves were not included in the study if they had a previous episode of diarrhea, other diseases (eg, umbilical abscess, pneumonia), or if they had ever been treated with antimicrobial drugs. Healthy calves that developed diarrhea within the 10 days after sampling also were excluded. Fecal samples were obtained per rectum from cases and controls, labeled and immediately stored at −20°C.
The incidence of calf diarrhea, as recorded by farm personnel, for calves <30 days of age was obtained from farms for the preceding 12‐month period. Attributable mortality rates due to calf diarrhea also were calculated for each farm, based on the number of deaths attributed to diarrhea by farm or veterinary personnel divided by the total number of deaths during a period of 1 year.
DNA extraction, amplification, and sequencing of bacterial 16S rRNA gene
Total DNA was extracted from 200 mg (wet weight) of fecal samples with a commercial Kit.3 The V4 region of the 16S rRNA gene was amplified with the forward (5′‐AYTGGGYDTAAAGNG‐3′) and reverse (5′‐TACNVGGGTATCTAATCC‐3′) primers14 The primers were designed with overhanging adapters (Forward: TCGTCGGCAGCGTCAGATGTGTATAAGAGACAG,Reverse: GTCTCGTGGGCTCGGAGATGTGTATAAGAGACAG) for annealing to Illumina universal index sequencing adaptors that were added in a later PCR. The reaction mixture and amplification conditions have been described previously.15 The PCR products were purified with magnetic beads.4 Illumina universal adapters (Forward: AATGATACGG CGACCACCGAGATCTACAC‐index‐TCGTCGGCAGCGTC, Reverse: CAAGCAGAAGACGGCATACGAGAT‐index‐GTCTCGTGGGCTCGG) then were added to the purified 16S rRNA gene product by PCR.15 The PCR products were evaluated by electrophoresis in 1.5% agarose gel and purified as described above. After purification, spectrophotometry5 was used to quantify the PCR products. Samples were normalized to a final concentration of 2 nM. The library pool was submitted to the Genomics Facility of the University of Guelph and sequenced with an Illumina MiSeq6 for 250 cycles from each end.
Statistical Analysis
Incidence of diarrhea and mortality rates attributed to diarrhea, as well as treatment rates, were compared by a Fisher's exact test. The Mothur software package7 was used for the bioinformatic analysis.16 Paired‐end reads were merged to fully overlapping reads and then aligned to the SILVA 16S rRNA reference database.17 Sequences that were misaligned with the target region were removed. Irregular sequences including those with contiguous sequence lengths >245 bp or <239 bp and ambiguous base calls also were removed, as were those with runs of homopolymers >8 base pairs. Uchime was utilized to identify chimeras,18 which then were removed. Sequences belonging to nonbacterial domains (chloroplasts, mitochondria, Archaea, and eukaryotes) also were removed. The remaining sequences were assigned into operational taxonomic units (OTUs) by an open OTU‐picking approach, with a distance limit of 0.03 (97% similarity). The OTUs were classified by the Ribosomal Database Project classifier.8
Relative abundances of the main phyla, classes, orders, and families (median relative abundance >0.1%) and the main genera (median relative abundance >0.05%) were calculated. The Shapiro‐Wilk test was used to evaluate normality of the datasets. The majority of datasets did not meet the assumptions of normal distribution. Therefore, comparison of the relative abundances between groups (healthy calves between farms, and healthy and diarrheic calves within farms) was performed by the nonparametric Mann‐Whitney U‐test. P‐values were adjusted for multiple comparisons by the Benjamini & Hochberg's false discovery rate19 by a statistical software9 to generate q‐values. A q < 0.05 was considered statistically significant.
Subsampling was completed to normalize sequence number by random selection of a number of sequences that corresponded to the lowest number of reads for any sample. Sampling coverage was assessed by Good's coverage value. Diversity, evenness, and richness were calculated by the inverse Simpson's, Shannon's evenness, and Chao1 indexes, respectively, and comparison between groups was made by Wilcoxon rank sum test. The core microbiota was investigated by identifying genera with relative abundances of at least 1% in all samples from a group.
The Jaccard index (a measure of community membership, which only considers the number of shared genera, but not their abundance) and the Yue and Clayton index (a measure of community structure, which considers shared genera and their relative abundances) were calculated. Unweighted unique fraction metric (UNIFRAC) analysis of molecular variance (AMOVA), homogeneity of molecular variance analysis (HOMOVA), and parsimony test were used to compare community membership and structure between groups. The similarity between groups was visualized by dendrograms plotted by FigTree v1.4.0.1.10 Clustering of the groups was represented by principal coordinate analysis plotted by a statistical software.11
Phylogenetic Investigation of Communities by Reconstruction of Unobserved States (PICRUSt)20 was used to predict the functional gene content in the fecal microbiota based on taxonomy obtained from the Greengenes reference database (http://greengenes.lbl.gov/cgi-bin/nph-index.cgi).21 Comparison of the percentages of functional gene content between groups (healthy calves between farms, and healthy and diarrheic calves within farms) was performed by Mann‐Whitney U‐test, adjusted for multiple comparisons.
Linear discriminant analysis effect size (LEfSe)22 was used to identify bacterial taxa and predicted functional genes (PICRUSt) that were enriched in feces of healthy and diarrheic calves, based on a P < .05 and LDA score >2.0. The PICRUSt and LEfSe were performed online in the Galaxy workflow framework (https://huttenhower.sph.harvard.edu/galaxy/). Data were made publicly available at the National Center for Biotechnology Information Sequence Read Archive under accession number SUB2017706.
Results
Farm, Calves, and Management Practices
The incidence of diarrhea in calves <1 month of age during a 1‐year period was significantly different between farms (F1: 78%, 529/679; F2: 90%, 957/1051; P = .001). However, the mortality rate due to diarrhea did not differ (3% and 3%; P = 1.000). The proportion of calves with diarrhea treated with antimicrobials was high and not different between F1 (494/529, 93%) and F2 (901/957, 94%) (P < .1). The age distribution (days) of diarrheic calves was similar across the calves from the 2 farms with mean ages of 8 ± 2 and 8 ± 3 days for F1 and F2, respectively (P = .92).
Analysis of 16S rRNA Gene Sequencing
A total of 7,564,140 reads were obtained with a mean of 70,106 reads per calf (standard deviation [SD] 30,903; median, 69,2; 75, range, 17,827 to 169,045). A random subsample of 17,827 reads per sample was used to normalize data. Subsampling was considered adequate, as evidenced by the coverage of 99.9% obtained for all samples.
Alpha Diversity
Significant differences in richness, evenness, and diversity of gut microbiota were noted between healthy and diarrheic calves (Fig 1).
Figure 1.

Richness (Chao‐1), diversity (Inverse Simpson), and evenness (Shannon evenness) indexes observed in healthy and diarrheic calves from 2 different farms.
Relative abundance and core microbiota
Twenty‐two different phyla were identified, but Firmicutes, Actinobacteria, and Proteobacteria accounted for >88% of sequences (Fig 2). Fusobacteria, Bacteroidetes, and Verrucomicrobia were identified in healthy and diarrheic calves at >1% of the total number of sequences. Comparison between healthy calves from F1 and F2 identified a higher relative abundance of Fusobacteria (P = .044) and lower relative abundance of Proteobacteria (P = .044) in calves from F1. Firmicutes, Actinobacteria, and Proteobacteria also dominated the fecal microbiota of diarrheic calves (Fig 2). On F1, diarrheic calves had a significantly lower relative abundance of Actinobacteria than did healthy calves from the same farm (P = .005). There were no differences in phyla between healthy and diarrheic calves on F2 (Table S1).
Figure 2.
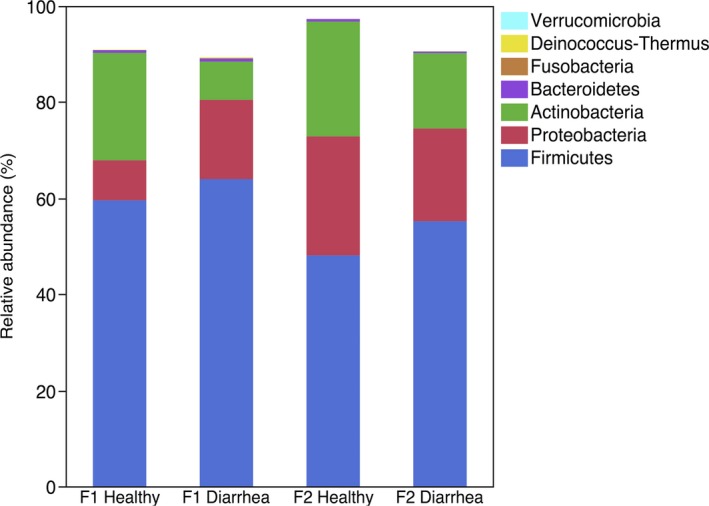
Median relative abundance of the main bacterial phyla (>1% of the total of sequences) in feces of healthy and diarrheic calves from 2 different farms (n = 15 per group).
Forty‐three different classes, 83 orders, and 166 families were identified, but only 11, 16, and 25 accounted for ≥0.1% of sequences overall, respectively. The relative abundances of most abundant bacterial taxa identified in feces of healthy and diarrheic calves from F1 and F2 are presented in supplemental Table 1. The significantly different taxa in healthy calves between farms, and in healthy and diarrheic calves within each farm are shown in Table 2. In F2, there were no statistically significant differences in the relative abundance of any bacterial taxa of healthy versus diarrheic calves.
Table 2.
Relative abundance (median in percentage and ranges) of all bacterial taxa significantly different identified in feces of healthy and diarrheic calves
| F1 Healthy | F2 Healthy | q‐valuea | |
|---|---|---|---|
| Phylum [8] | |||
| Proteobacteria | 8.3 (3–35) | 25 (2.3 ‐ 63) | 0.044 |
| Fusobacteria | 0.4 (0–2.2) | 0 (0–2.7) | 0.044 |
| Class [12] | |||
| Betaproteobacteria | 0.6 (0.01–3.3) | 0.01 (0–1.3) | 0.037 |
| Gammaproteobacteria | 6 (2–35) | 23 (2–62) | 0.046 |
| Fusobacteria | 0.04 (0–2.2) | 0 (0–2.7) | 0.055 |
| Order [17] | |||
| Enterobacteriales | 5 (1.4–28) | 18 (2–62) | 0.037 |
| Burkholderiales | 0.6 (0–3.3) | 0 (0–1.3) | 0.003 |
| Coriobacteriales | 0.1 (0–0.3) | 0.03 (0–0.1) | 0.007 |
| Fusobacteriales | 0.04 (0 2.2) | 0 (0–2.7) | 0.040 |
| Actinomycetales | 0.7 (0–6.12) | 0.08 (0–4.2) | 0.040 |
| Family [28] | |||
| Acidaminococcaceae | 27 (1.4–69) | 8 (0.2–35) | 0.01 |
| Coriobacteriaceae | 12 (2–39) | 3.2 (0–26) | 0.007 |
| Actinomycetaceae | 0.6 (0–6.1) | 0.05 (0–4.2) | 0.046 |
| Sutterellaceae | 0.4 (0–3.2) | 0 (0–1.2) | 0.005 |
| Enterobacteriaceae | 0.04 (0–2.2) | 0 (0–3) | 0.035 |
| Alcaligenaceae | 0.004 (0–0.8) | 0 (0–0.06) | 0.007 |
| Genus [70] | |||
| Escherichia_Shigella | 3.3 (0.9–16.8) | 12 (1–42) | 0.037 |
| Unclass. Enterobacteriacea | 1.2 (0.2–12) | 6.3 (1.2–20) | 0.025 |
| Collinsella | 9.3 (0.4–20) | 1.8 (0–8.4) | 0.019 |
| Unclass. Alcaligenaceae | 1.1 (0.09–8) | 0.3 (0–9) | 0.007 |
| Howardella | 0.9 (0–9) | 0.14 (0–1.4) | 0.022 |
| Unclass. Fusobacteriaceae | 0.02 (0–2) | 0 (0–0.08) | 0.058 |
| Sutterella | 0.32 (0–3) | 0 (0–0.7) | 0.007 |
| Unclass. Acidaminococcaceae | 0.25 (0–1.7) | 0 (0–2) | 0.022 |
| Unclass. TM7 order incertae sedis | 0.2 (0.02–0.5) | 0.03 (0 ‐ 0.07) | 0.025 |
| Pseudomonas | 0.08 (0–0.2) | 0.01 (0.1) | 0.025 |
| Unclass. Pasteurellaceae | 0.02 (0–0.03) | 0.04 (0–12) | 0.036 |
| Erysipelotrichaceae _incertae_sedis | 0.2 (0.01–5) | 0.05 (0–1.5) | 0.036 |
| F1 Healthy | F1 Diarrhea | ||
| Phylum [8] | |||
| Actinobacteria | 22 (4–57) | 8 (2.3–29) | 0.004 |
| Class [12] | |||
| Actinobacteria | 22 (4.4–57) | 8 (2.2–29) | 0.007 |
| Order [17] | |||
| Bifidobacteriales | 13 (0.4–46) | 1.2 (0.3–9) | 0.003 |
| Family [28] | |||
| Bifidobacteriaceae | 13 (0.4–46) | 1.2 (0.3–9) | 0.005 |
| Genus [70] | |||
| Bifidobacterium | 13 (0.4–46) | 1.2 (0.3–9) | 0.02 |
F1, farm 1; F2, farm 2.
P‐values were adjusted for multiple comparisons by the Benjamini & Hochberg's false discovery rate to generate q‐values. Numbers in [] indicate the number of comparisons performed at each level of taxonomic classification. The abbreviation “unclass.” indicates an unclassified taxonomy within the respective taxonomic group.
Overall, 385 genera were detected. Fifty‐five of those were present at relative abundance of >0.05%. The relative abundances of the most abundant genera found in healthy and diarrheic calves from F1 and F2 are presented in Fig 3 and Table 3.
Figure 3.
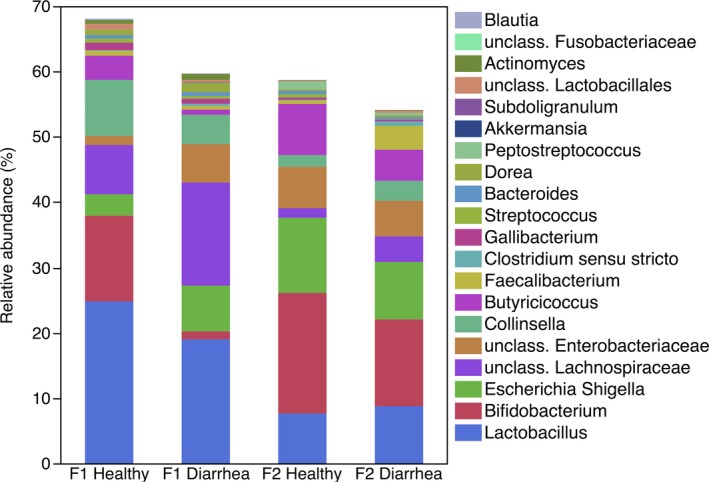
Median relative abundance of genera accounting for >1% of the total of sequences in feces of healthy and diarrheic calves from 2 different farms (n = 15 per group).
Table 3.
The 10 most abundant genera (median (min–max)) from feces of healthy and diarrheic calves
| Farm 1 | Farm 1 | Farm 2 | Farm 2 |
|---|---|---|---|
| Healthy | Diarrhea | Healthy | Diarrhea |
| Lactobacillus | Lactobacillus | Bifidobacterium | Bifidobacterium |
| 24 (1.4–67) | 19 (2–48) | 18 (2–77) | 13 (0–33) |
| Bifidobacterium | Unclass.Lachnospiraceae | Escherichia_Shigella | Lactobacillus |
| 13 (0.4–45) | 16 (0.1–22) | 12 (1–42) | 9 (0.2–53) |
| Collinsella | Escherichia_Shigella | Butyricicoccus | Escherichia_Shigella |
| 7 (0.4–20) | 7 (1.4–16) | 8 (0–20) | 9 (0.2–26) |
| unclass.Lachnospiraceae | unclass.Enterobacteriaceae | Lactobacillus | unclass.Enterobacteriaceae |
| 7.5 (1.8–27) | 6 (0.8–12) | 8 (0.2–33) | 5.5 (0.3–19) |
| Butyricicoccus | Collinsella | unclass.Enterobacteriaceae | Butyricicoccus |
| 3.7 (0.2–7) | 4.5 (0.8–23) | 6 (1–20) | 5 (1.6–12) |
| Escherichia_Shigella | Dorea | Collinsella | unclass.Lachnospiraceae |
| 3.3 (0.9–17) | 1.5 (0–9) | 2 (0–8) | 4 (0.4–29) |
| Unclass.Enterobacteriaceae | Bifidobacterium | unclass.Lachnospiraceae | Faecalibacterium |
| 1.4 (0.2–12) | 1 (0.2–9) | 1.5 (0–17) | 4 (0–30) |
| Gallibacterium | Actinomyces | Peptostreptococcus | Collinsella |
| 1.1 (0–15) | 0.9 (0–3) | 1.2 (0–6) | 3 (0–17) |
| unclass.Lactobacillaceae | Butyricicoccus | Faecalibacterium | Clostridium_sensu_stricto |
| 0.8 (0–8.5) | 0.8 (0–8) | 0.5 (0–18) | 0.7 (0–44) |
| Dorea | Gallibacterium | Bacteroides | Peptostreptococcus |
| 0.8 (0–7.5) | 0.8 (0–23) | 0.5 (0–13) | 0.4 (0–28) |
The abbreviation “unclass.” indicates an unclassified taxonomy within the respective taxonomic group.
LEfSe Analysis
When comparing healthy calves, 34 and 12 bacterial taxa enriched in healthy calves from F1 and F2, respectively, were identified. Enriched phylotypes from F1 were predominantly from the classes Bacilli, Fusobacteria, Alphaproteobacteria, Betaproteobacteria, and Bacteroidetes, whereas most from F2 were Gammaproteobacteria (Fig 4). Comparing healthy and diarrheic calves within each farm, 3 genera were enriched in the feces of healthy calves and 25 genera were enriched in diarrheic calves from F1, whereas in F2 3 genera were enriched in healthy calves and 4 in diarrheic calves (Fig 5). Based on LEfSe, the genera Bifidobacterium, Megamonas, and a genus of the family Bifidobacteriaceae were associated with health in F1, whereas Lachnospiraceae incertae sedis, Dietzia and an unclassified genus of the family Veillonellaceae were significantly associated with health in F2 (Fig 6).
Figure 4.
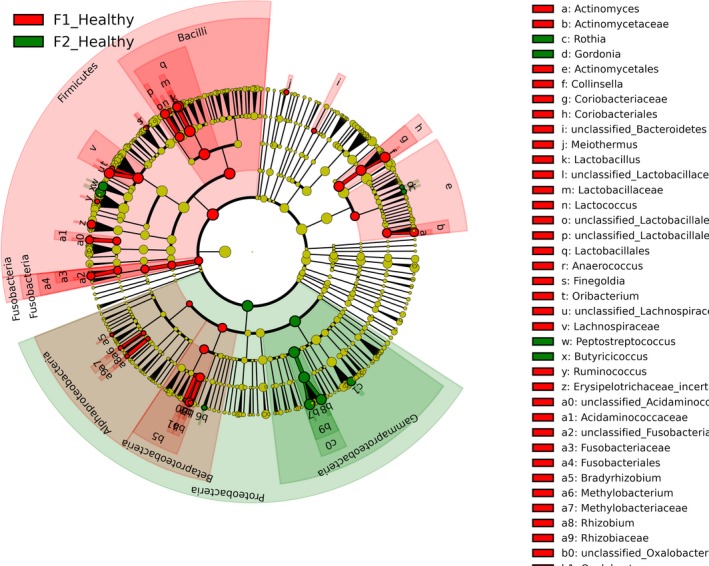
Cladogram plotted from LEfSe analysis showing the taxonomic levels represented by rings with phyla in the outermost the ring and genera in the innermost ring. Each circle is a member within that level. Those taxa in each level are coloured by farm for which it is more abundant (P < .05; LDA score 2).
Figure 5.
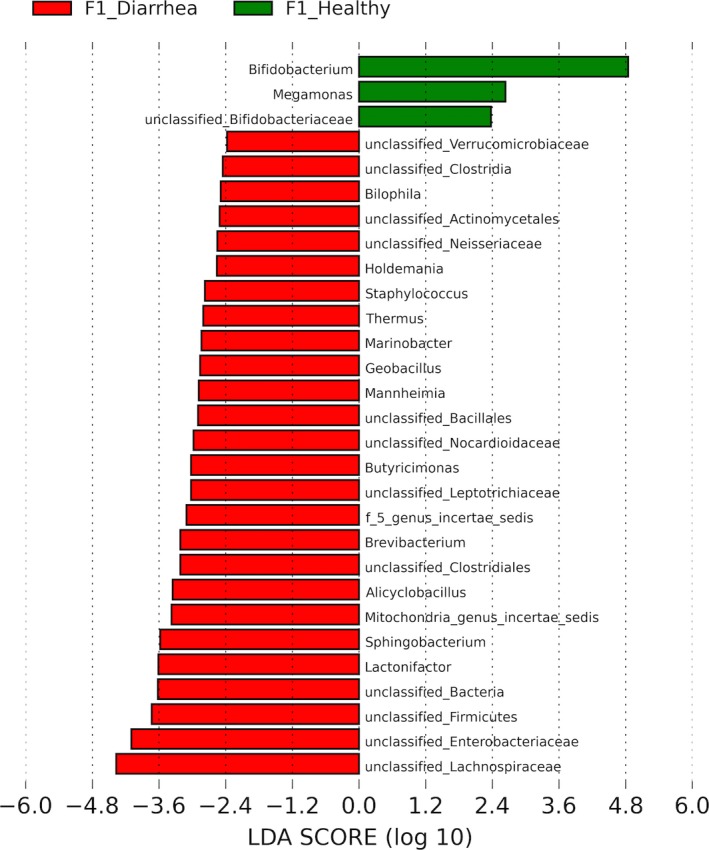
Plot from LEfSe analysis indicating enriched bacterial genera associated either with healthy (green) or diarrheic (red) calves from farm 1.
Figure 6.
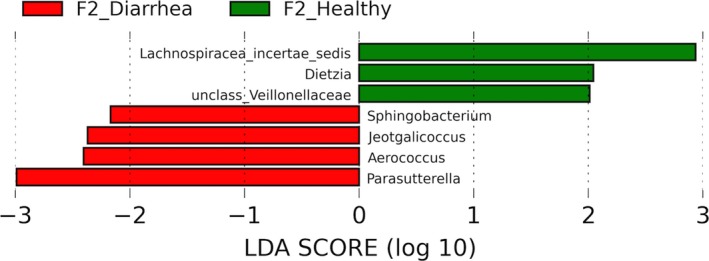
Plot from LEfSe analysis indicating enriched genera associated either with healthy (green) or diarrheic (red) calves from farm 2. *Editorial office note: Figure is clear when downloaded and viewed on computer. Figure is blurry when compiled into a PDF of full article. If this manuscript is published, the publishers’ production team will make sure figure is represented clearly in final representation.
Community Membership and Structure
As shown in Table 4, there were significant differences in community membership (Jaccard index) and community structure (Yue & Clayton index) between healthy calves from the different farms. Healthy and diarrheic calves from F1 were significantly different in community membership, but there was no difference in community membership between healthy and diarrheic calves from F2. Community structure was significantly different between healthy and diarrheic calves from F1. These differences in community membership and structure were visualized by dendrograms (Fig 7) and PCoA plots (Figs 8 and 9).
Table 4.
P‐values obtained from statistical analyses comparing community membership and structure of fecal samples of healthy and diarrheic calves from 2 different farms
| UNIFRAC Unweight | AMOVA | HOMOVA | Parsimony | |
|---|---|---|---|---|
| The Classic Jaccard index | ||||
| F1 Healthy – F2 Healthy | 0.008 | <0.001 | >0.05 | <0.001 |
| F1 Diarrhea – F2 Diarrhea | 0.013 | <0.001 | >0.05 | <0.001 |
| F1 Healthy – F1 Diarrhea | 0.05 | 0.02 | >0.05 | 0.267 |
| F2 Healthy – F2 Diarrhea | 0.149 | 0.09 | >0.05 | 0.520 |
| The Yue and Clayton index | ||||
| F1 Healthy – F2 Healthy | 0.038 | <0.001 | 0.348 | 0.026 |
| F1 Diarrhea – F2 Diarrhea | 0.009 | <0.001 | 0.055 | <0.001 |
| F1 Healthy – F1 Diarrhea | 0.014 | 0.004 | 0.357 | 0.113 |
| F2 Healthy – F2 Diarrhea | 0.03 | 0.038 | 0.011 | 0.108 |
F1, farm 1; F2, farm 2; AMOVA, analysis of molecular variance; HOMOVA, Homogeneity of molecular variance.
Figure 7.
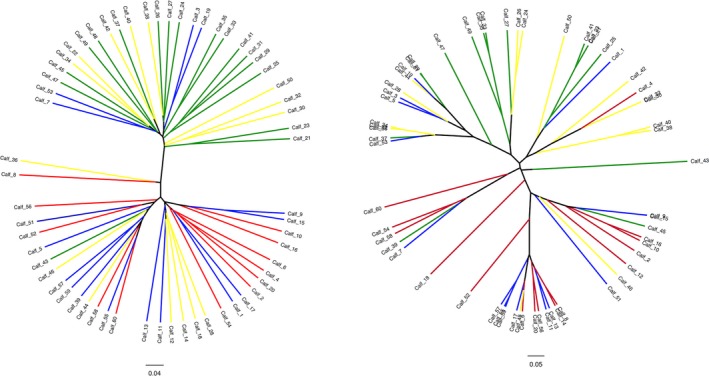
Dendrograms representing the similarity of community membership (Jaccard index, left panel) and structure (Yue and Clayton index, right panel) found in fecal samples collected from healthy (blue) and diarrheic (red) calves from farm 1 and healthy (green) and diarrheic (yellow) calves from farm 2.
Figure 8.
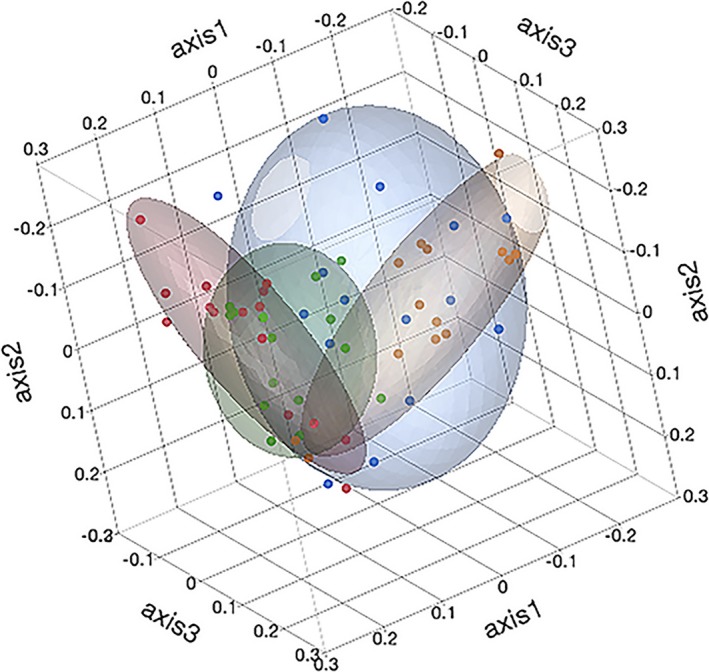
Three‐dimensional principal coordinates analyses of the community membership (Jaccard Index) of the fecal microbiota of healthy and diarrheic calves. Coloured points and ellipses indicate groups: healthy calves from farm 1 (green) and farm 2 (red) and diarrheic calves from farm 1 (orange) and farm 2 (blue).
Figure 9.
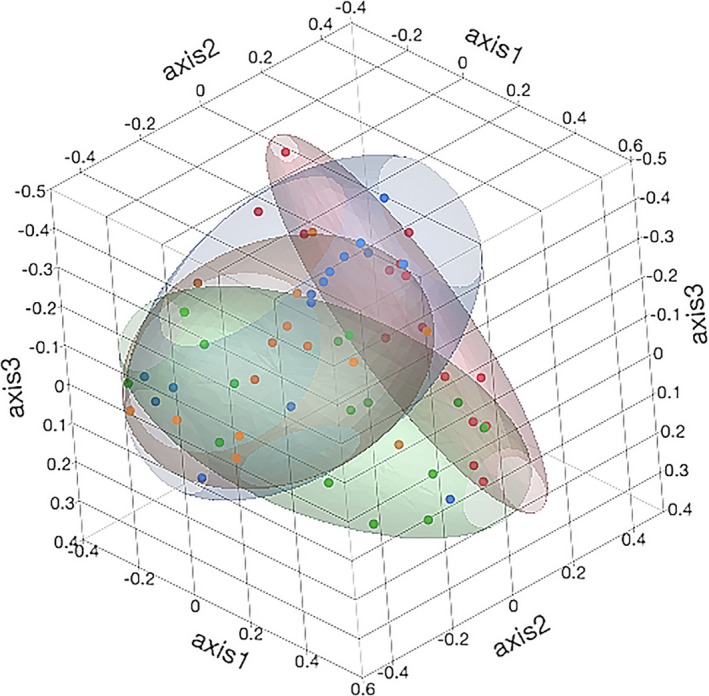
Three‐dimensional principal coordinates analyses of the community structure (Yue and Clayton index) of the fecal microbiota of healthy and diarrheic calves. Coloured points and ellipses indicate groups: healthy calves from farm 1 (green) and farm 2 (red) and diarrheic calves from farm 1 (orange) and farm 2 (blue).
PICRUSt Analysis
At Kyoto Encyclopedia of Genes and Genomes (KEGG) level 1, genes associated with metabolism predominated, accounting for 62% (n = 148) overall. Genes encoding genetic information processing (31; 13%), environmental information processing (15; 6%), cellular information processing (15; 6%), and organismal system (immune system, endocrine system, and nervous system; 19; 8%) also were common. At KEGG level 2, 14% (n = 20) of the metabolism genes belonged to xenobiotic biodegradation metabolism, 11% (n = 17) to lipid metabolism, 11% (n = 16) to biosynthesis of secondary metabolites, 10% (n = 15) to carbohydrate metabolism, 9% (n = 14) to amino acid metabolism, 9% (n = 13) to metabolism of terpenoids and polyketides, 8% (n = 12) to metabolism of cofactors and vitamins, 7% (n = 11) to glycan metabolism, 6% (n = 9) metabolism of other amino acids, 5% (n = 8) were unclassified, 5% (n = 8) were related to energy metabolism, and 2% (n = 2) to enzyme families. There were no differences in the percentages of KEGG orthologs from either level 1 or 2 (all adjusted P values >.05). The relative abundances of the 20 most abundant KEGG orthologs are presented in supplemental Fig 1. When comparing healthy and diarrheic calves, LEfSe analysis indicated that porphyrin and chlorophyll metabolism pathway genes were enriched in diarrheic calves from F1. On F2, biosynthesis of vancomycin group antibiotics; valine, leucine, and isoleucine biosynthesis; glycine, serine, and threonine metabolism; folate biosynthesis; pantothenate and CoA biosynthesis; and C5 branched dibasic acid metabolism were enriched in healthy calves, whereas porphyrin and chlorophyll metabolism pathway genes were enriched in diarrheic calves (Fig 10).
Figure 10.
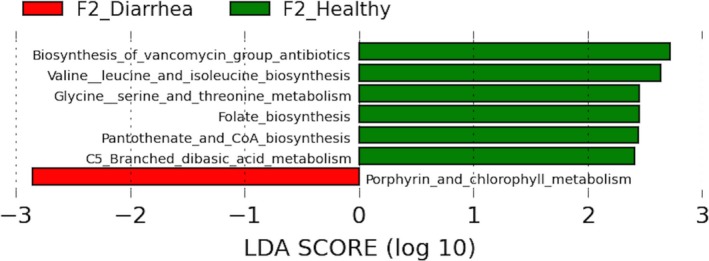
Predicted functional composition of metagenomes based on 16S rRNA gene sequencing data. LEfSe based on the PICRUSt dataset revealed differentially enriched metabolic pathways associated either with healthy (green) or diarrheic calves (red) from farm 2.
Discussion
Various studies have described the development of the gastrointestinal microbiota of calves12, 23, 24, 25, 26, 27, 28 and the changes associated with different management practices including feeding, housing, and antimicrobial administration during the neonatal period.29, 30 However, limited information is available regarding the specific changes occurring in the fecal microbiota and the functional genes in calves with neonatal diarrhea.31, 32, 33 We identified significant differences in the fecal microbiota and its predicted functional metabolic pathways in healthy and diarrheic calves from 2 large dairy farms with different management practices. The analyses evaluating the similarity of community membership and structure of the fecal microbiota showed that calves from the same farm shared similar microbial communities regardless of the health status when compared to healthy and diarrheic calves from a different farm. The degree of interfarm variation is important to recognize, particularly because earlier studies have been based primarily on animals from single facilities. These data indicate potentially important differences between facilities that must be considered when designing and interpreting microbiota studies.
The development of intestinal microbiota in neonatal calves is a dynamic and complex process influenced by external and internal factors that affect intestinal microbial succession.30 External factors include microbial load in the environment, delivery mode,34 type of colostrum,35 type of feeding (raw milk versus pasteurized milk versus milk replacer),29 housing,36 and administration of probiotics, prebiotics, or antibiotics.37, 38, 39 Individual factors that can influence gut microbiota include nutritional state, functional immaturity of the immune system, intestinal pH, peristalsis, bile acids, bacterial mucosal receptors, and microbial interactions.40 Therefore, management factors are a likely explanation for the interfarm differences that were noted, but further study of factors that influence both the individual calf and farm‐level microbiota is needed.
In humans and most other studied species, a small number of phyla tend to account for the majority of the intestinal microbiota. Firmicutes tends to be the dominant phylum in most animal species,12, 15, 41, 42 as was the case here. The predominance of Firmicutes, Actinobacteria, and Proteobacteria noted in these calves is also consistent with previous studies in infants,41 foals,42 piglets,15 and calves.12, 35 The predominance of Actinobacteria is presumably a reflection of the early colonization of the gut in neonates. Bovine milk contains complex nondigestible oligosaccharides43 that promote proliferation of specific gut microbes, especially Bifidobacterium spp. from the Actinobacteria phyla.44
Although it is difficult to define normal calf microbiota, general trends can be inferred from previous studies. From a phylum‐level perspective, the fecal microbiota of healthy Holstein calves during the neonatal period was dominated by Firmicutes, with a relative abundance ranging from 64 to 82%, followed by Bacteroidetes (8–24%), Proteobacteria (4–10%), Fusobacteria (1–6%), and Actinobacteria (1–2%).12 At the genus level, several studies identified higher abundance of Bacteroides and Clostridium spp. in the feces of healthy calves.27, 28, 29 In addition, in pre‐weaned Holstein calves relative abundance of Faecalibacterium prausnitzii, a microorganism that belongs to the phylum Firmicutes, was higher during the first weeks of life and this high abundance was associated with decreased incidence of diarrhea.12
Our results differed with the aforementioned studies in several aspects. The phylum Bacteroidetes accounted for <1% of the total sequences identified in healthy and diarrheic calves, something that could be accounted for, at least in part, by methodology, because it is well established that differences in Bacteroidetes abundance can be found with Illumina vs 454 sequencing likely due to the choice of different primers (V4‐V5 vs V4, respectively).45
Proteobacteria, especially members of the Enterobacteriaceae family, were enriched in feces of healthy calves from F2, and in feces of diarrheic calves from both F1 and F2. The increase in diarrheic calves is not surprising as this phylum often is associated with intestinal dysbiosis,46 but the difference between farms was interesting. A recent study of nursing calves from 5 beef farms identified some farms with high relative abundances of Proteobacteria,47 suggesting that higher Proteobacteria levels could be a farm‐associated effect, perhaps from management practices. This could be of concern because recent studies have identified a mechanistic interrelation among Proteobacteria, the gut immune response, and inflammation.48, 49 Dysregulated innate immune responses can elicit the bloom of Proteobacteria that promotes gut inflammation and facilitate inflammation or invasion by pathogens.50, 51 Additionally, the relative abundance of Faecalibacterium spp. was lower in healthy calves, a somewhat surprising result because F. prausnitzii has been associated with anti‐inflammatory properties by stimulating the production of anti‐inflammatory cytokines, decreasing the secretion of the pro‐inflammatory cytokines and by the production of butyrate.52, 53 Contradictory results regarding the relative abundance of Faecalibacterium spp in feces of preweaned calves from different farms also have been reported in dairy12, 27 and beef calves.47 The reasons accounting for these differences are unclear, but differences in methodologies among studies as well as a farm‐associated effects (management practices) could explain the differences in gut microbiota.
We also identified significant differences in microbiota structure and membership between healthy and diarrheic calves. This observation was not surprising given the differences that have been noted with enteric disease in various animal species and diseases.54, 55, 56 The differences that were noted with our analyses, along with those identified by other approaches (eg, LEfSe) highlight the need to look beyond simple comparison of relative abundances when trying to interpret the microbiota, because relative abundance changes were more modest.
The relative abundance of Actinobacteria was significantly increased in healthy calves. At the genus level, LEfSe analysis identified enrichment of Bifidobacterium and an unclassified genus of the Bifidobacteriaceae family in healthy calves. Changes in the relative abundance of Bifidobacterium have been reported with different dysbiosis‐associated intestinal diseases.57, 58 Bifidobacteria have been reported to prevent gastrointestinal infections by outcompeting pathogenic viruses or bacteria for binding sites on epithelial cells.59, 60 Bifidobacteria also produce short chain fatty acids that are transformed to butyrate and stimulate growth of butyrate‐producing bacteria.59 Butyrate has been shown to have trophic and immunomodulatory effects on the intestinal epithelium.61, 62 Bifidobacterium also can contribute to the gut health by production of inhibitory substances,62, 63 and modulating the gastrointestinal immune system response.64, 65 These characteristics can explain the positive impact of Bifidobacterium‐based probiotics on prevention of gastrointestinal diseases in calves.66
The PICRUSt analysis was used to infer functional capabilities of the microbial communities. This approach infers the functional capacity of the microbiota by prediction of functional genes that typically are associated with different taxa. Although the biological relevance of this approach is still unclear, LEfSe analysis identified several functional gene categories that were enriched in healthy and diarrheic calves. Diarrheic calves had decreased abundances of genes responsible for metabolism of various vitamins (eg, folate, panthotenate), amino acids (eg, valine, leucine, isoleucine, glycine, serine, threonine) and carbohydrate metabolism. This imbalance might indicate that free vitamin and nutrient availability is altered in diarrheic calves. Alterations in amino acid metabolism have been observed in dogs with chronic diarrhea caused by idiopathic inflammatory bowel disease,53 in cats with acute diarrhea,54 and in humans with gut inflammation,67 suggesting that amino acid dysmetabolism may be an important feature of dysbiosis‐associated diseases. Increased relative abundances of genes associated with porphyrin and chlorophyll metabolism also were present in diarrheic calves. Porphyrins are tetrapyrroles that bind covalently to a metal (iron, to form cytochromes, peroxidase, catalase, myoglobin, and hemoglobin; copper or nickel, to form molecules for electron transport in methanogenic bacteria).68 In non‐photosynthetic eukaryotes such as animals, insects, fungi, and protozoa, as well as in the α‐Proteobacteria group of bacteria, the committed step for porphyrin biosynthesis is the formation of δ‐aminolevulinic acid by the reaction of the amino acid glycine with succinyl CoA from the citric acid cycle.68 Metabolites such as δ‐aminolevulinic acid potentially could be used as a marker of increased abundance of Proteobacteria and therefore dysbiosis. However, PICRUSt is only a predictor of metagenomic function, and metabolomic approaches are preferred to identify factual changes in metabolic function of microbiota of diarrheic calves and identify markers of unstable gut microbiota.
Conclusion
The intestinal microbiota of healthy dairy calves appeared to be farm‐specific as were the changes during diarrhea. Significant differences in microbiota structure and membership between healthy and diarrheic calves suggest that dysbiosis occurred in diarrheic calves and was associated with changes in the predictive metagenomic function of the bacterial communities. A metabolomic approach is required however to accurately establish changes in metabolic function.
Supporting information
Fig S1. Median relative abundance of the main metabolic pathways genes identified in feces of healthy and diarrheic calves from 2 different farms (n = 15 per group).
Table S1. Relative abundance (median, min and max) of the most abundant phyla, classes, order, and families identified in feces of healthy and diarrheic calves from two different farms.
Acknowledgments
We thank Joyce Rousseau and William Sears for their input and advice during the process of carrying out the experiments and statistical analysis, respectively, described in this manuscript.
Conflict of Interest Declaration: Authors declare no conflict of interest.
Off‐label Antimicrobial Declaration: Authors declare no off‐label use of antimicrobials.
This work was presented as a research abstract at the 2016 ACVIM Forum Denver, Colorado.
Footnotes
Calf‐Guard, Zoetis, Florham, NJ
First defense, ImmuCell, Portland, ME
EZNA Stool DNA Kit, Omega Bio‐Tek, Doraville, GA
Agencourt, AMPure XP, Beckman Coulter, ON
NanoDrop, Roche, Wilmington, DE
Illumina, San Diego, CA
Mothur software package (v.1.35), Michigan State University, East Lansing, MI
Ribosomal Database Project classifier, Michigan State University, East Lansing, MI
R! Core Team, 2013, R Foundation for Statistical Computing, Vienna, Austria
FigTree v1.4.0.1. Institute of Evolutionary Biology, University of Edinburgh, Edinburgh, Scotland
JMP 12, SAS Institute Inc., Cary, NC
References
- 1. USDA . Dairy 2007, Part I: Reference of Dairy Cattle Health and Management Practices in the United States. Fort Collins CO: USDA‐APHIS‐VS; 2007. [Google Scholar]
- 2. Cho Y‐I, Han J‐I, Wang C, et al. Case‐control study of microbiological etiology associated with calf diarrhea. Vet Microbiol 2013;166:375–385. [DOI] [PMC free article] [PubMed] [Google Scholar]
- 3. Bäckhed F, Ley RE, Sonnenburg JL, et al. Host‐bacterial mutualism in the human intestine. Science 2005;307:1915–1920. [DOI] [PubMed] [Google Scholar]
- 4. Macpherson AJ, Harris NL. Interactions between commensal intestinal bacteria and the immune system. Nat Rev Immunol 2004;4:478–485. [DOI] [PubMed] [Google Scholar]
- 5. Lei YM, Nair L, Alegre ML. The interplay between the intestinal microbiota and the immune system. Clin Res Hepatol Gastroenterol 2015;39:9–19. [DOI] [PMC free article] [PubMed] [Google Scholar]
- 6. Rakoff‐Nahoum S, Paglino J, Eslami‐Varzaneh F, et al. Recognition of commensal microflora by toll‐like receptors is required for intestinal homeostasis. Cell 2004;118:229–241. [DOI] [PubMed] [Google Scholar]
- 7. Warner BB, Deych E, Zhou Y, et al. Gut bacteria dysbiosis and necrotising enterocolitis in very low birthweight infants: A prospective case‐control study. Lancet 2016;387:1928–1936. [DOI] [PMC free article] [PubMed] [Google Scholar]
- 8. Antharam VC, Li EC, Ishmael A, et al. Intestinal dysbiosis and depletion of butyrogenic bacteria in Clostridium difficile infection and nosocomial diarrhea. J Clin Microbiol 2013;51:2884–2892. [DOI] [PMC free article] [PubMed] [Google Scholar]
- 9. Stecher B, Robbiani R, Walker AW, et al. Salmonella enterica serovar typhimurium exploits inflammation to compete with the intestinal microbiota. PLoS Biol 2007;5:2177–2189. [DOI] [PMC free article] [PubMed] [Google Scholar]
- 10. Lupp C, Robertson ML, Wickham ME, et al. Host‐mediated inflammation disrupts the intestinal microbiota and promotes the overgrowth of Enterobacteriaceae. Cell Host Microbe 2007;2:119–129. [DOI] [PubMed] [Google Scholar]
- 11. van Nood E, Dijkgraaf MG, Keller JJ. Duodenal infusion of feces for recurrent Clostridium difficile. N Engl J Med 2013;368:2143–2145. [DOI] [PubMed] [Google Scholar]
- 12. Oikonomou G, Teixeira AGV, Foditsch C, et al. Fecal microbial diversity in pre‐weaned dairy calves as described by pyrosequencing of metagenomic 16S rDNA. Associations of Faecalibacterium species with health and growth. PLoS ONE 2013;8:e63157. [DOI] [PMC free article] [PubMed] [Google Scholar]
- 13. McGuirk SM. Disease management of dairy calves and heifers. Vet Clin North Am Food Anim Pract 2008;24:139–153. [DOI] [PMC free article] [PubMed] [Google Scholar]
- 14. Klindworth A, Pruesse E, Schweer T, et al. Evaluation of general 16S ribosomal RNA gene PCR primers for classical and next generation sequencing‐based diversity studies. Nucleic Acids Res 2013;41:e1. [DOI] [PMC free article] [PubMed] [Google Scholar]
- 15. Slifierz MJ, Friendship RM, Weese JS. Longitudinal study of the early‐life fecal and nasal microbiotas of the domestic pig. BMC Microbiol 2015;15:184–196. [DOI] [PMC free article] [PubMed] [Google Scholar]
- 16. Schloss PD, Westcott SL, Ryabin T, et al. Introducing mothur: Open‐source, platform‐independent, community‐supported software for describing and comparing microbial communities. Appl Environ Microbiol 2009;75:7537–7541. [DOI] [PMC free article] [PubMed] [Google Scholar]
- 17. Quast C, Pruesse E, Yilmaz P, et al. The SILVA ribosomal RNA gene database project: Improved data processing and web‐based tools. Nucleic Acids Res 2013;41:D590–D596. [DOI] [PMC free article] [PubMed] [Google Scholar]
- 18. Edgar RC, Haas BJ, Clemente JC, et al. UCHIME improves sensitivity and speed of chimera detection. Bioinformatics 2011;27:2194–2200. [DOI] [PMC free article] [PubMed] [Google Scholar]
- 19. Benjamini Y, Hochberg Y. Controlling the false discovery rate: A practical and powerful approach to multiple testing. J R Stat Soc Methodol 1995;57:289–300. [Google Scholar]
- 20. Langille M, Zaneveld J, Caporaso JG, et al. Predictive functional profiling of microbial communities using 16S rRNA marker gene sequences. Nat Biotechnol 2013;31:814–821. [DOI] [PMC free article] [PubMed] [Google Scholar]
- 21. DeSantis TZ, Hugenholtz P, Larsen N, et al. Greengenes, a chimera‐checked 16S rRNA gene database and workbench compatible with ARB. Appl Environ Microbiol 2006;72:5069–5072. [DOI] [PMC free article] [PubMed] [Google Scholar]
- 22. Segata N, Izard J, Waldron L, et al. Metagenomic biomarker discovery and explanation. Genome Biol 2011;12:R60. [DOI] [PMC free article] [PubMed] [Google Scholar]
- 23. Li RW, Connor EE, Li C, et al. Characterization of the rumen microbiota of pre‐ruminant calves using metagenomic tools. Environ Microbiol 2012;14:129–139. [DOI] [PubMed] [Google Scholar]
- 24. Lukás F, Koppová I, Kudrna V, Kopecný J. Postnatal development of bacterial population in the gastrointestinal tract of calves. Folia Microbiol (Praha) 2007;52:99–104. [DOI] [PubMed] [Google Scholar]
- 25. Smith HW. The development of the flora of the alimentary tract in young animals. J Pathol Bacteriol 1965;90:495–513. [PubMed] [Google Scholar]
- 26. Mylrea PJ. The bacterial content of the small intestine of young calves. Res Vet Sci 1969;10:394–395. [PubMed] [Google Scholar]
- 27. Klein‐Jöbstl D, Schornsteiner E, Mann E, et al. Pyrosequencing reveals diverse fecal microbiota in Simmental calves during early development. Front Microbiol 2014;5:622. [DOI] [PMC free article] [PubMed] [Google Scholar]
- 28. Uyeno Y, Sekiguchi Y, Kamagata Y. rRNA‐based analysis to monitor succession of faecal bacterial communities in Holstein calves. Lett Appl Microbiol 2010;51:570–577. [DOI] [PubMed] [Google Scholar]
- 29. Edrington TS, Dowd SE, Farrow RF, et al. Development of colonic microflora as assessed by pyrosequencing in dairy calves fed waste milk. J Dairy Sci 2012;95:4519–4525. [DOI] [PubMed] [Google Scholar]
- 30. Malmuthuge N, Li M, Goonewardene LA, et al. Effect of calf starter feeding on gut microbial diversity and expression of genes involved in host immune responses and tight junctions in dairy calves during weaning transition. J Dairy Sci 2013;96:3189–3200. [DOI] [PubMed] [Google Scholar]
- 31. Smith T, Orcutt ML. The bacteriology of the intestinal tract of young calves with special reference to the early diarrhea (“scours”). J Exp Med 1925;41:89–106. [DOI] [PMC free article] [PubMed] [Google Scholar]
- 32. Isaacson RE, Moon HW, Schneider RA. Distribution and virulence of Escherichia coli in the small intestines of calves with and without diarrhea. Am J Vet Res 1978;39:1750–1775. [PubMed] [Google Scholar]
- 33. Youanes YD, Herdt TH. Changes in small intestinal morphology and flora associated with decreased energy digestibility in calves with naturally occurring diarrhea. Am J Vet Res 1987;48:719–725. [PubMed] [Google Scholar]
- 34. Dominguez‐Bello MG, Costello EK, Contreras M, et al. Delivery mode shapes the acquisition and structure of the initial microbiota across multiple body habitats in newborns. Proc Natl Acad Sci U S A 2010;107:11971–11975. [DOI] [PMC free article] [PubMed] [Google Scholar]
- 35. Malmuthuge N, Chen Y, Liang G, et al. Heat‐treated colostrum feeding promotes beneficial bacteria colonization in the small intestine of neonatal calves. J Dairy Sci 2015;98:8044–8053. [DOI] [PubMed] [Google Scholar]
- 36. Pereira RV, Siler JD, Ng JC, et al. Effect of preweaned dairy calf housing system on antimicrobial resistance in commensal Escherichia coli. J Dairy Sci 2014;97:7633–7643. [DOI] [PMC free article] [PubMed] [Google Scholar]
- 37. Van Vleck Pereira R, Lima S, Siler JD, et al. Ingestion of milk containing very low concentration of antimicrobials: Longitudinal effect on fecal microbiota composition in preweaned calves. PLoS ONE 2016;11:e0147525. [DOI] [PMC free article] [PubMed] [Google Scholar]
- 38. Oultram J, Phipps E, Teixeira AG, et al. Effects of antibiotics (oxytetracycline, florfenicol or tulathromycin) on neonatal calves’ faecal microbial diversity. Vet Rec 2015;177:598–599. [DOI] [PubMed] [Google Scholar]
- 39. Foditsch C, Pereira RV, Ganda EK, et al. Oral Administration of Faecalibacterium prausnitzii Decreased the incidence of severe diarrhea and related mortality rate and increased weight gain in preweaned dairy heifers. PLoS ONE 2015;10:e0145485. [DOI] [PMC free article] [PubMed] [Google Scholar]
- 40. Mackie RI, Sghir A, Gaskins HR. Developmental microbial ecology of the neonatal gastrointestinal tract. Am J Clin Nutr 1999;69:1035S–1045S. [DOI] [PubMed] [Google Scholar]
- 41. Jost T, Lacroix C, Braegger CP, et al. New insights in gut microbiota establishment in healthy breast‐fed neonates. PLoS ONE 2012;7:e44595. [DOI] [PMC free article] [PubMed] [Google Scholar]
- 42. Costa MC, Stämpfli HR, Allen‐Vercoe E, et al. Development of the faecal microbiota in foals. Equine Vet J 2016;48:681–688. doi:10.1111/evj.12532. [DOI] [PubMed] [Google Scholar]
- 43. Zivkovic AM, Barile D. Bovine milk as a source of functional oligosaccharides for improving human health. Adv Nutr 2011;2:284–289. [DOI] [PMC free article] [PubMed] [Google Scholar]
- 44. Yu ZT, Chen C, Kling DE, et al. The principal fucosylated oligosaccharides of human milk exhibit prebiotic properties on cultured infant microbiota. Glycobiology 2013;23:169–177. [DOI] [PMC free article] [PubMed] [Google Scholar]
- 45. Nelson MC, Morrison HG, Benjamino J, et al. Analysis, optimization and verification of Illumina‐generated 16S rRNA gene amplicon surveys. PLoS ONE 2014;9:e94249. [DOI] [PMC free article] [PubMed] [Google Scholar]
- 46. Singh P, Teal TK, Marsh TL, et al. Intestinal microbial communities associated with acute enteric infections and disease recovery. Microbiome 2015;3:45. [DOI] [PMC free article] [PubMed] [Google Scholar]
- 47. Weese JS, Jelinski M. Assessment of the Fecal Microbiota in Beef Calves. J Vet Intern Med 2017;31:176–185. doi:10.1111/jvim.14611. [DOI] [PMC free article] [PubMed] [Google Scholar]
- 48. Maharshak N, Packey CD, Ellermann M, et al. Altered enteric microbiota ecology in interleukin 10‐deficient mice during development and progression of intestinal inflammation. Gut Microbes 2013;4:316–324. [DOI] [PMC free article] [PubMed] [Google Scholar]
- 49. Devkota S, Wang Y, Musch MW, et al. Dietary‐fat‐induced taurocholic acid promotes pathobiont expansion and colitis in Il10‐/‐ mice. Nature 2012;487:104–108. [DOI] [PMC free article] [PubMed] [Google Scholar]
- 50. Shin NR, Whon TW, Bae JW. Proteobacteria: Microbial signature of dysbiosis in gut microbiota. Trends Biotechnol 2015;33:496–503. [DOI] [PubMed] [Google Scholar]
- 51. Stecher B, Chaffron S, Käppeli R, et al. Like will to like: Abundances of closely related species can predict susceptibility to intestinal colonization by pathogenic and commensal bacteria. PLoS Pathog 2010;6:e1000711. [DOI] [PMC free article] [PubMed] [Google Scholar]
- 52. Sokol H, Pigneur B, Watterlot L, et al. Faecalibacterium prausnitzii is an anti‐inflammatory commensal bacterium identified by gut microbiota analysis of Crohn disease patients. Proc Natl Acad Sci USA 2008;105:16731–19736. [DOI] [PMC free article] [PubMed] [Google Scholar]
- 53. Minamoto Y, Otoni CC, Steelman SM, et al. Alteration of the fecal microbiota and serum metabolite profiles in dogs with idiopathic inflammatory bowel disease. Gut Microbes 2015;6:33–47. [DOI] [PMC free article] [PubMed] [Google Scholar]
- 54. Suchodolski JS, Foster ML, Sohail MU, et al. The fecal microbiome in cats with diarrhea. PLoS ONE 2015;10:e0127378. [DOI] [PMC free article] [PubMed] [Google Scholar]
- 55. Costa MC, Arroyo LG, Allen‐Vercoe E, et al. Comparison of the fecal microbiota of healthy horses and horses with colitis by high throughput sequencing of the V3‐V5 region of the 16S rRNA gene. PLoS ONE 2012;7:e41484. [DOI] [PMC free article] [PubMed] [Google Scholar]
- 56. Sokol H, Seksik P, Furet JP, et al. Low counts of Faecalibacterium prausnitzii in colitis microbiota. Inflamm Bowel Dis 2009;15:1183–1189. [DOI] [PubMed] [Google Scholar]
- 57. Duffy LC, Zielezny MA, Riepenhoff‐Talty M, et al. Effectiveness of Bifidobacterium bifidum in mediating the clinical course of murine rotavirus diarrhea. Pediatr Res 1994;35:690–695. [DOI] [PubMed] [Google Scholar]
- 58. Perdigón G, Locascio M, Medici M, et al. Interaction of bifidobacteria with the gut and their influence in the immune function. Biocell 2003;27:1–9. [PubMed] [Google Scholar]
- 59. Veiga P, Pons N, Agrawal A, et al. Changes of the human gut microbiome induced by a fermented milk product. Sci Rep 2014;4:6328. [DOI] [PMC free article] [PubMed] [Google Scholar]
- 60. Duncan SH, Louis P, Flint HJ. Lactate‐utilizing bacteria, isolated from human feces, that produce butyrate as a major fermentation product. Appl Environ Microbiol 2004;70:5810–5817. [DOI] [PMC free article] [PubMed] [Google Scholar]
- 61. Furusawa Y, Obata Y, Fukuda S, et al. Commensal microbe‐derived butyrate induces the differentiation of colonic regulatory T cells. Nature 2013;504:446–450. [DOI] [PubMed] [Google Scholar]
- 62. Liévin V, Peiffer I, Hudault S, et al. Bifidobacterium strains from resident infant human gastrointestinal microflora exert antimicrobial activity. Gut 2000;47:646–652. [DOI] [PMC free article] [PubMed] [Google Scholar]
- 63. Fujiwara S, Hashiba H, Hirota T, Forstner JF. Proteinaceous factor(s) in culture supernatant fluids of bifidobacteria which prevents the binding of enterotoxigenic Escherichia coli to gangliotetraosylceramide. Appl Environ Microbiol 1997;63:506–512. [DOI] [PMC free article] [PubMed] [Google Scholar]
- 64. De Simone C, Ciardi A, Grassi A, et al. Effect of Bifidobacterium bifidum and Lactobacillus acidophilus on gut mucosa and peripheral blood B lymphocytes. Immunopharmacol Immunotoxicol 1992;14:331–340. [DOI] [PubMed] [Google Scholar]
- 65. Yasui H, Kiyoshima J, Ushijima H. Passive protection against rotavirus‐induced diarrhea of mouse pups born to and nursed by dams fed Bifidobacterium breve YIT4064. J Infect Dis 1995;172:403–409. [DOI] [PubMed] [Google Scholar]
- 66. Abe F, Ishibashi N, Shimamura S. Effect of administration of Bifidobacteria and lactic acid bacteria to newborn calves and piglets. J Dairy Sci 1995;78:2838–2846. [DOI] [PubMed] [Google Scholar]
- 67. Gevers D, Kugathasan S, Denson LA, et al. The treatment‐naive microbiome in new‐onset Crohn's disease. Cell Host Microbe 2014;15:382–392. [DOI] [PMC free article] [PubMed] [Google Scholar]
- 68. Pérez‐Urria E, Avalos A. Approach to a comparative study of the metabolism of porphyrins and chlorophylls. J Natural Sci 2015;3:1–16. [Google Scholar]
Associated Data
This section collects any data citations, data availability statements, or supplementary materials included in this article.
Supplementary Materials
Fig S1. Median relative abundance of the main metabolic pathways genes identified in feces of healthy and diarrheic calves from 2 different farms (n = 15 per group).
Table S1. Relative abundance (median, min and max) of the most abundant phyla, classes, order, and families identified in feces of healthy and diarrheic calves from two different farms.


