

Abstract
FADS genes encode fatty acid desaturases that are important for the conversion of short chain polyunsaturated fatty acids (PUFAs) to long chain fatty acids. Prior studies indicate that the FADS genes have been subjected to strong positive selection in Africa, South Asia, Greenland, and Europe. By comparing FADS sequencing data from present-day and Bronze Age (5–3k years ago) Europeans, we identify possible targets of selection in the European population, which suggest that selection has targeted different alleles in the FADS genes in Europe than it has in South Asia or Greenland. The alleles showing the strongest changes in allele frequency since the Bronze Age show associations with expression changes and multiple lipid-related phenotypes. Furthermore, the selected alleles are associated with a decrease in linoleic acid and an increase in arachidonic and eicosapentaenoic acids among Europeans; this is an opposite effect of that observed for selected alleles in Inuit from Greenland. We show that multiple SNPs in the region affect expression levels and PUFA synthesis. Additionally, we find evidence for a gene–environment interaction influencing low-density lipoprotein (LDL) levels between alleles affecting PUFA synthesis and PUFA dietary intake: carriers of the derived allele display lower LDL cholesterol levels with a higher intake of PUFAs. We hypothesize that the selective patterns observed in Europeans were driven by a change in dietary composition of fatty acids following the transition to agriculture, resulting in a lower intake of arachidonic acid and eicosapentaenoic acid, but a higher intake of linoleic acid and α-linolenic acid.
Keywords: selection, evolution, human, genetics, FADS
Introduction
Long-chain polyunsaturated fatty acids (LC-PUFAs) are important components of mammalian tissue and are crucial for a variety of biological processes. They are bioactive elements of cell membranes and have an important role in neuronal membrane development (Marszalek and Lodish 2005; Darios and Davletov 2006). With large brains composed mostly of lipids, humans have a particularly strong requirement for these fatty acids (Mathias et al. 2012). LC-PUFAs also serve as precursors for cell signaling molecules including eicosanoids, such as prostaglandins, which act as messengers in the central nervous system and exert control over many bodily systems including inflammation (Hester et al. 2014). LC-PUFA concentration has been linked to infant visual and brain development (McCann and Ames 2005) and to risks of cardiovascular and coronary heart disease and mortality (Patel et al. 2010). The physiologically most important LC-PUFAs include ω-6 (or n-6) PUFA arachidonic acid (ARA; 20:4n-6), and ω-3 (or n-3) PUFAs eicosapentaenoic acid (EPA; 20:5n-3) and docosahexaenoic acid (DHA; 22:6n-3). Additionally, ω-3 LC-PUFAs are common dietary supplements, despite ongoing debate regarding their potential preventative role against cancer or heart disease (MacLean et al. 2006; Rizos et al. 2012).
Humans can obtain LC-PUFAs directly, particularly by the consumption of meat, fish, and marine mammals. Alternatively, these compounds can be synthesized endogenously from the short chain ω-6 and ω-3 polyunsaturated fatty acids (SC-PUFAs) linoleic acid (LA; 18:2n-6) and α-linolenic acid (ALA; 18:3n-3) (fig. 1). These SC-PUFAs are considered essential and are obtained primarily through the consumption of vegetable oils. The rate-limiting steps in the synthesis of long chain PUFAs from short chain PUFAs are catalysed by two fatty acid desaturases: delta-5 desaturase (D5D) and delta-6 desaturase (D6D) (Cho et al. 1999), encoded by fatty acid desaturase 1 (FADS1) and fatty acid desaturase 2 (FADS2), respectively. FADS1 and FADS2 are located adjacent to each other on chromosome 11 (11q12-13.1), and next to another gene encoding a third fatty acid desaturase (FADS3). The function of FADS3 has yet to be elucidated, but the gene shares 52% and 62% sequence homology with FADS1 and FADS2, respectively, and likely resulted from gene duplication (Marquardt et al. 2000).
Fig. 1.

ω-3 and ω-6 polyunsaturated fatty acid synthesis pathway. Dietary intakes and fatty acid desaturases (FADS1 and FADS2) are shown in context of the fatty acids that they directly affect.
Previous studies have suggested that the FADS genes are targets of natural selection in different human populations. Mathias et al. (2011, 2012) compared allele frequencies of 80 FADS SNPs across African and non-African populations, showing that African populations had substantially higher frequencies of derived alleles associated with more efficient desaturases (Mathias et al. 2011). In a subsequent study, Ameur et al. (2012) showed that the FADS genes span two distinct linkage disequilibrium (LD) blocks, one of which contains an ancestral haplotype largely present in Eurasia, and a derived haplotype that is prevalent in Africa. Both these studies argued that a selective sweep began in the FADS genes prior to the human migration out of Africa, roughly 85 thousand years ago (kya). Humans migrating out of Africa putatively carried mostly the ancestral haplotype, which remained in high frequency in non-African populations, while the derived haplotype came close to fixation in Africa. It is unclear why positive selection for the derived haplotype appears to be restricted to Africa. Mathias et al. (2012) suggested that the emergence of regular hunting of large animals, dated to ∼50 kya, might have diminished the pressure for humans to endogenously synthesize LC-PUFAs.
In a subsequent genome-wide scan for positive selection in the Greenlandic Inuit, the FADS region was found to be the strongest outlier region based on patterns of allele frequency differentiation relative to other populations (Fumagalli et al. 2015). The two most highly differentiated SNPs (rs7115739 and rs174570), both located in FADS2, were associated with decreased concentrations of LC-PUFAs but increased concentrations of SC-PUFAs (Fumagalli et al. 2015). In their traditional diet, Inuit consume extremely high levels of LC-PUFAs from fish and marine mammals, ostensibly diminishing their need to endogenously synthesize these LC-PUFAs, but have a low intake of some SC-PUFAs such as linoleic acid. The mutations in the Inuit appear to compensate for a decreased intake of SC-PUFAs and an increased intake of LC-PUFAs. Fumagalli et al. (2015) also demonstrated that the selected alleles were associated with a decrease in weight, height, fasting serum insulin, and fasting serum LDL cholesterol. The FADS genes have been associated with metabolic traits in multiple previous studies (Bokor et al. 2010; Glaser et al. 2011), but the strong association with height had not been noted previously, presumable because these SNPs segregate at very low frequencies in Europeans. Nevertheless, the effect on height was replicated in European cohorts (Fumagalli et al. 2015).
More recently, Kothapalli et al. (2016) studied genomes from populations in South Asia and showed strong signs of positive selection for an indel (rs66698963, mislabeled as rs373263659 in 1000 Genomes Project Phase III data) in FADS2, with the insertion allele putatively endowing South Asians with the ability to more efficiently synthesize LC-PUFAs, possibly as an adaptation to a more vegetarian diet.
Mathieson et al. (2015) carried out a genome-wide scan for positive selection comparing DNA microarray data from ancient and present-day European genomes. They carried out the selection scan using a linear model aimed at predicting present-day allele frequencies from the allele frequencies in ancient source populations from the European Neolithic and Bronze Ages. They then identified SNPs with allele frequencies that strongly deviated from those predicted by the genome-wide pattern. One of these SNPs was rs174546, the derived allele (C) of which tags the derived haplotype in Africans (Ameur et al. 2012) and is in high LD (r2 = 0.978; CEU) with the derived allele of rs174537, a SNP located in the middle of the selection peak in Mathias et al. (2012). The Mathieson et al. (2015) study provides strong evidence of selection in the FADS region in Europe over the past 4,000 years, in addition to the patterns of selection already reported in Africans, South Asians, and the Inuit. Transitioning from selection-oriented studies to targeted functional studies, Pan et al. (2017) recently used a reporter assay to produce clear evidence that rs174557 is involved in the regulation of FADS1. The variant also lies within Ameur’s (2012) haplotype and within a PATZ1 transcription factor binding site.
The aim of this study is to further investigate the selection signal in Europeans and the functional effects of the selected alleles. Taking advantage of genome-wide sequencing data from 101 Bronze Age individuals by Allentoft et al. (2015) as well as data from the 1000 Genomes Project (Genomes Project et al. 2015), we identify novel potential targets of selection in the FADS region. Using expression data and data from multiple GWASs, we investigate the functional effects of the allelic variants that have increased in frequency in Europe over the past 5,000 years. We show that SNPs associated with increased expression of FADS1 and increased production of arachidonic acid and eicosapentaenoic acid have been favored in Europeans since the Bronze Age. Our results suggest that selection in the FADS region is complex and has targeted several loci across different populations.
Results
Origin and Structure of Human Haplotypes in the FADS Region
As previously observed (Ameur et al. 2012), two distinct LD blocks span the FADS gene cluster. These blocks are especially evident when focusing on Europeans (supplementary fig. 1, Supplementary Material online) The first block (Block 1: chr11:61547000–61625000) overlaps FADS1 and half of FADS2, while the second block (Block 2: chr11:61627000–61673000) overlaps with the rest of FADS2 and all of FADS3 (fig. 2).
Fig. 2.

Allele frequency changes across FADS region. Three SNPs exhibiting the greatest allele frequency change are labeled in blue. Prominent SNPs from other studies are also labeled: rs174546 (Alexander et al. 2009; Mathieson et al. 2015) in red, SNPs from Fumagalli et al. (2015) in green, and rs66698963 from Kothapalli et al. (2016) in orange (location only). Red blocks indicate the locations and orientations of FADS1, FADS2, and FADS3. Blue blocks indicate the locations of major LD blocks.
We set out to analyse the selective processes in Europe in detail, across both space and time. First, we inspected the haplotype structure at this locus using present-day human genomes from phase 3 of the 1000 Genomes Project (Genomes Project et al. 2015). As previously noted, the FADS cluster shows high amounts of haplotypic variation in present-day humans (Mathias et al. 2012). In Block 1, this variation is largely attributable to high differentiation between two haplotype clusters: a cluster widespread in Africa, largely containing derived alleles and possibly subject to a selective sweep (Mathias et al. 2011, 2012), and an ancestral cluster, which is present across Eurasia. Interestingly, two archaic human genomes (Altai Neanderthal and Denisova) that are sister groups to each other genome-wide, actually cluster with different clusters in this region (fig. 3 and supplementary figs. 2 and 3, Supplementary Material online): the Denisovan genome clusters with the ancestral (Eurasian-specific) cluster, while the Altai Neanderthal genome clusters with the derived cluster, which is prevalent in Africa.Mathieson (http://mathii.github.io/research/2015/12/14/fads1-selection-and-diet; last accessed September 5, 2016) argues this pattern could be explained by a re-introduction of the ancestral cluster into Eurasians via introgression from archaic humans, followed by a second selective event in Eurasia.
Fig. 3.

Haplotype network plots of the two LD blocks in the FADS region, using the phase 3 1000 Genomes data, the Altai Neanderthal (Prüfer et al. 2014) and Denisova (Meyer et al. 2012) genomes and the inferred human–chimpanzee ancestral haplotype (Paten et al. 2008), built using pegas (Paradis et al. 2010). Block 1: chr11:61547000–61625000. Block 2: chr11:61627000–61673000. The colors denote the continental populations to which each haplotype belongs. The size of the pie charts is proportional to log2(n) where n is the number of individuals carrying the haplotype. The black dots on each connecting line denote the number of differences separating each haplotype from its neighbors. The dotted lines denote the haplotype clusters in which each of the putatively derived alleles from four interesting SNPs are located: rs174570 (Fumagalli et al. 2015), rs174546 (Mathieson et al. 2015), rs174594 (HDS from this study) and rs174455 (HDS from this study).
We observed, however, that this locus does not show signatures that could be consistent with a simple model of introgression, at least directly from the populations to which the sequenced archaic genomes belong. Unlike other documented cases of adaptive introgression (Racimo, Gokhman, et al. 2017) inspecting of the haplotype network reveals that none of the branches connecting the archaic haplotypes to their most similar present-day human haplotypes are less than half as large as the branches connecting those same present-day haplotypes to other present-day human haplotypes (fig. 3). Additionally, we observe no archaic alleles in this region that are at low frequency (<1%) in Africans but at high (>20%) frequency in any particular non-African population or continental panel from the 1000 Genomes data—a signature of archaic adaptive introgression (Racimo, Marnetto, et al. 2017). Finally, this region does not appear as a significant candidate in recent scans for archaic adaptive introgression in Eurasians (Sankararaman et al. 2014, 2016; Vernot and Akey 2014). Another possibility is that balancing selection has maintained the haplotype, however, the haplotype is relatively long, and standard models of long-term balancing selection predict a narrow peak of increased variability. Accordingly, standard methods for detecting balancing selection, which take the spatial pattern along the chromosome into account, do not find evidence for balancing selection (supplementary fig. 6, Supplementary Material online) (DeGiorgio et al. 2014). This suggests a more complicated scenario, for example, with balancing selection affecting multiple sites or with multiple introgression events and/or selective sweep events in both Africa and Eurasia. At the present we cannot distinguish between these more complicated scenarios.
We also aimed to determine where in the haplotype network each of the derived alleles from the SNPs discussed in this study were located (fig. 3 and supplementary fig. 3, Supplementary Material online). We find that the derived allele (T; 16%, CEU) of rs174570—which showed the strongest signs of selection in the Greenlandic Inuit—is present in a non-African haplotype cluster in Block 1, but not present in Africans or the archaic humans. The derived allele (C; 64%, CEU) from the putatively selected SNP from Mathieson et al. (2015), rs174546, is in the other haplotype cluster, which includes several African and non-African haplotypes, as well as the Altai Neanderthal genome. The Denisovan genome and the other non-African haplotypes carry the ancestral allele at this site (fig. 3 and supplementary fig. 2, Supplementary Material online). The derived allele of rs174594 is present in a cluster of non-African haplotypes in Block 1, which are closer to certain African haplotypes. Finally, the derived allele of rs174455 (A; 65%, CEU) is present in a mostly non-African haplotype cluster in Block 2.
Allele Frequency Changes in Europe
We then set out to compare patterns of temporal allele frequency differentiation in Europe, by comparing the allele frequencies of FADS SNPs in present-day CEU from the 1000 Genomes Project (Genomes Project et al. 2015) and 54 Bronze Age Europeans (Allentoft et al. 2015) (supplementary table 7, Supplementary Material online). The vertical axis of figure 2 shows the absolute value of allele frequency changes across the FADS cluster. Below, we refer to the four top SNPs (rs174594, rs97384, 174455 and rs174465, see table 1), each with >17% change in allele frequency, as highly differentiated SNPs (HDSs) and they are labeled in blue in figure 2. rs174594 and rs97384 are located in FADS2, towards the end of LD Block 1, and both are in high LD (r2 = 0.917) in the 1000 Genomes CEU panel. rs174455 and rs174465 are located 2.7 kb apart in FADS3 on LD Block 2, and are also in relatively high LD (r2 = 0.776, CEU) with each other, but less so with rs174594 and rs97384 (r2 ≈ 0.4). The lead SNPs from our study were not included in the SNP typing platform used by (Mathieson et al. 2015) and may therefore have been missed in that study.
Table 1.
SNP Selected Allele Frequencies Reference.
| SNP | Ancestral Allele | Derived Allele | Allele Under Putative Positive Selection in Europe | Frequency of Selected Allele in Bronze Age Europeans | Frequency of Selected Allele in 1KGP CEU |
|---|---|---|---|---|---|
| rs174546 | T | C | C | 51% | 64% |
| rs66698963 | − | + | − | No data | 47% |
| rs174594 | C | A | A | 39% | 62% |
| rs97384 | T | C | C | 40% | 61% |
| rs174455 | G | A | A | 45% | 65% |
| rs174465 | C | T | T | 52% | 70% |
In addition to CEU, we also compared two other groups comprised of panels from the 1000 Genomes Project (Genomes Project et al. 2015), Northern European (FIN, GBR, CEU) and Southern European (TSI, IBS), to the Bronze Age data from (Allentoft et al. 2015) (fig. 4). The ancestral haplotype in LD Block 1 appears to be more prevalent in Northern Europeans and Bronze Age Europeans than in Southern Europeans, resulting in lower allele frequency changes in the comparison between Northern and Bronze Age Europeans (fig. 4A) than in the comparison between Southern and Bronze Age Europeans (fig. 4B). The lead SNP from (Mathieson et al. 2015) (rs174546) in LD Block 1 is one of most highly differentiated SNPs between present-day Northern and Southern Europeans (fig. 4C), whereas our HDSs show less differentiation between the present-day populations. The method used by Mathieson et al. (2015) to detect selection captured information regarding allele frequency distributions and changes in allele frequencies from the Neolithic, through the Bronze age, and today. However, it also models the geographic distribution of allele frequencies. The relatively high differentiation between Northern and Southern Europeans may be one of the signals detected by the method of Mathieson et al. (2015). However, we also notice that the Singleton Density Score, a selection statistic designed by Field et al. (2016) expressly to detect recent (<2 kya) selection (supplementary fig. 5, Supplementary Material online), provide additional evidence of selection, confirming the claims of recent selection from Mathieson et al. (2015).
Fig. 4.
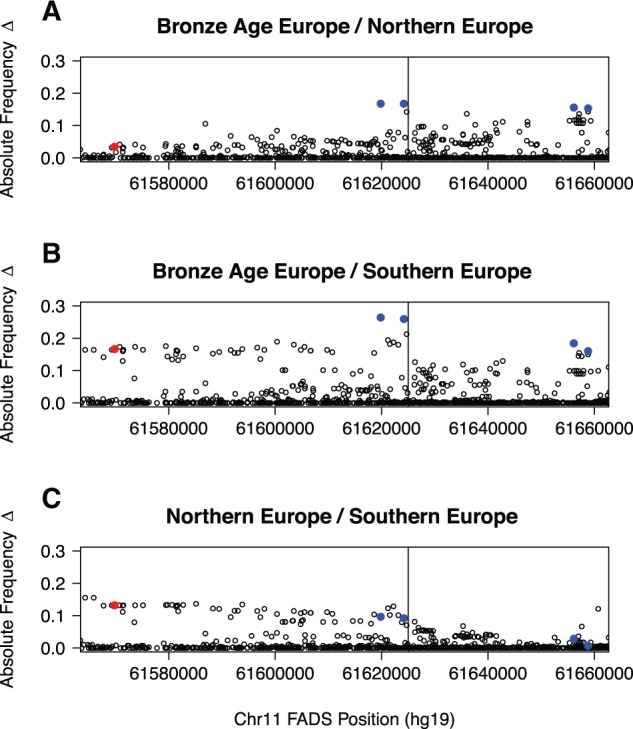
FADS Allele Frequency Differences Between Bronze Age Europe, present-day Northern Europe (CEU, FIN, GBR), and present-day Southern Europe (IBS, TSI). Note the string of SNPs in Southern Europeans that show greater allele frequency change. The vertical line in both plots represents the approximate transition point between LD Block 1 and LD Block 2.
Comparison of Targets of Selection in South Asia, Europe, and Greenland
In figure 2, we also show lead SNPs and indels from other previous population genetic studies of the FADS region: rs174546 from (Alexander et al. 2009; Mathieson et al. 2015) (red), two SNPs from (Fumagalli et al. 2015) (green), and rs66698963 from (Kothapalli et al. 2016) (orange). Note that the Allentoft et al. (2015) low-coverage aDNA dataset does not include called indels so we did not plot the allele frequency change for rs66698963. rs174546, which also tags the (Ameur et al. 2012) derived haplotype in Africans is additionally in very high LD (r2=0.978, CEU) with the lead SNP from (Mathias et al. 2012) (rs174537). These two SNPs and the two HDSs on LD Block 1 (rs174594, rs97384) are tightly linked to each other in Europe (supplementary table 1, Supplementary Material online). The indel found to be under selection in South Asians (rs66698963) (Kothapalli et al. 2016), the top hit in the Greenlander Inuit scan (rs174570) (Fumagalli et al. 2015), and HDS rs174455 are not in exceptionally high LD with each other or with rs174546 (supplementary table 1, Supplementary Material online).
We observed substantial differences in LD patterns among populations, as can be seen in supplementary table 1, Supplementary Material online. For example, rs66698963 is in relatively strong LD with most other SNPs in the Bengali from Bangladesh (BEB), but much less so in other populations such as CEU, presumably due to the selective pressures restricted to South Asia and described by (Kothapalli et al. 2016) (supplementary fig. 1, Supplementary Material online). rs66698963 is, therefore, unlikely to be the target of selection in Europe. Similarly, the r2 value between rs174570, the lead SNP of the Inuit study (Fumagalli et al. 2015), and rs174594 and rs66698963 is only 0.156 and 0.215, respectively, suggesting that the selective pressures acting on the FADS region have had different targets in Europeans, South Asians and the Inuit.
Identifying Targets of FADS Selection in Europe
To further determine whether one of the lead SNPs from this study or rs174546 is the most likely target of selection in Europe, we compared allele frequencies before and after selection using a likelihood approach (supplementary information 2, Supplementary Material online), jointly modeling selection affecting one or more SNPs. We use rs174594 as the lead SNP to represent the SNPs from the present study.
The results of the analyses are shown in supplementary information 2, Supplementary Material online and supplementary tables 1–3. We compared three models: a model in which selection acts only on the derived allele (C) of rs174546 (Model 1), a model in which it only acts on the derived allele (A) of rs174594 (Model 2), and a model in which a haplotype (DD) carrying the derived alleles from both rs174546 and rs174594 has been the target (Model 3). Both model 2 and 3 have likelihood values that are approximately 10 likelihood units better than Model 1. This suggests that the change in allele frequency is best modeled as driven either by selection targeting the DD haplotype or by selection favoring the derived allele in rs174594 alone. Selection favoring only the derived allele in rs174546 (Model 1) is not a parsimonious explanation of the data. However, we cannot confidently distinguish between selection favoring the DD haplotype versus selection acting only on rs174594, although a model in which selection acted on rs174594 has a slightly higher likelihood than the model of selection acting on DD.
Expression Associations
To investigate possible functional effects of the selected haplotypes/alleles in Europe, we examined public data from the Genotype-Tissue Expression (GTEx) project (Lonsdale et al. 2013) for the four HDSs as well as rs174546 (tables 2 and 3; supplementary table 3A and B, Supplementary Material online) The most significant results are in whole blood, where all SNPs are eQTLs for FADS2 with P values < 10−19. In all cases, the effect size (linear regression coefficient, units of quantile normalized gene expression over allele dosage) of the derived allele (corresponding to the allele that has increased frequency over time) is to decrease FADS2 expression. The largest effect sizes and smallest P values are for rs174546.
Table 2.
Abbreviated GTEx eQTL Results, P Value Cut Off of 10−10 (effect on FADS2 expression).
| SNP | P Value | Derived Allele Effect Size | Tissue |
|---|---|---|---|
| rs174546 | 4.00E-29 | −0.77 | Whole blood |
| rs174594 | 2.90E-21 | −0.63 | Whole blood |
| rs97384 | 9.30E-20 | −0.62 | Whole blood |
| rs174546 | 5.80E-13 | −0.26 | Cells—transformed fibroblasts |
| rs174546 | 8.80E-12 | −0.42 | Thyroid |
| rs174465 | 3.80E-11 | −0.46 | Whole blood |
| rs174546 | 3.90E-11 | −0.5 | Esophagus—muscularis |
| rs174455 | 6.20E-11 | −0.45 | Whole blood |
| rs174594 | 9.40E-11 | −0.46 | Esophagus—muscularis |
| rs174546 | 1.00E-10 | −0.37 | Colon—transverse |
| rs97384 | 3.10E-10 | −0.46 | Esophagus—muscularis |
| rs174594 | 5.50E-10 | −0.21 | Cells—transformed fibroblasts |
Table 3.
Abbreviated GTEx eQTL Results, P Value Cut Off of 10−10 (effect on FADS1 expression).
| SNP | P value | Derived Allele Effect Size | Tissue |
|---|---|---|---|
| rs174546 | 1.40E-15 | 0.73 | Pancreas |
| rs174546 | 2.30E-12 | 0.72 | Brain—cerebellum |
| rs174594 | 1.10E-10 | 0.6 | Pancreas |
| rs174546 | 4.60E-10 | 0.41 | Esophagus—mucosa |
| rs97384 | 5.90E-10 | 0.6 | Pancreas |
There are also expression associations for FADS1, with the smallest P values found in the pancreas (p < 10−9 for rs174546, rs174594, rs97384). Interestingly, the effects sizes are in the opposite direction as those for FADS2; the derived alleles are associated with an increase in expression for FADS1. Thus the derived alleles appear to promote expression of FADS1 while simultaneously abating the expression of FADS2. This associated increase in FADS1 expression is also consistent with the results by (Wang et al. 2015) across 154 human liver tissue samples, and the results by Pan et al. (2017). Although the effect of these expression changes for LC-PUFA synthesis is somewhat difficult to predict without further data, we expect this would lead to a likely increase in arachidonic acid and eicosapentaenoic acid concentrations. We also note that FADS1 and FADS2 are transcribed in opposite directions and share their promoter regions. It is possible that the opposite directed effects on expression are caused by interference in the promoter regions of the two genes due to structural requirements or competition of transcription factors.
Allelic Heterogeneity
To examine if the expression data also show evidence for an effect of multiple alleles, mirroring that observed for allele frequency changes, we also applied an extension of CAVIAR (Hormozdiari et al. 2014), a probabilistic method developed to determine a set of all causal variants in a given locus while allowing that more than one variant may be causal. The extended version of CAVIAR thus allows for the detection of allelic heterogeneity (AH). We observed AH with high confidence for FADS1 expression in tibial artery tissue (Pr(2 causal variants) = 0.65, full results in supplementary table 2, Supplementary Material online). For FADS2 expression, we observed evidence of AH in three tissue types: transformed fibroblast cells (Pr(2 causal variants) = 0.72), left heart ventricle (Pr(2 causal variants) = 0.74), and whole blood (Pr(3 causal variants) = 0.74). Tests for FADS3 did not reveal strong evidence of AH. The inferred AH associated with FADS2 in whole blood observed here, taken together with the previously described results on allele frequency changes, suggest that there are multiple targets of selection in the FADS genes.
Functional Characterization of HDSs
The strong expression associations may suggest that one or more of the investigated variants have a regulatory function, in addition to the previously proposed function of the rs66698963 indel (Reardon et al. 2012; Kothapalli et al. 2016). Therefore, we investigated the genomic features of the HDSs using CADD (Kircher et al. 2014) and the WashU Epigenomics Browser (Zhou et al. 2015). All of the SNPs are in either intronic or intergenic regions. rs174546 is located in an intron of FADS1 and has a high GERP score (4.54) (Davydov et al. 2010) suggesting strong past purifying selection in this site. rs174595 is located in an intron of FADS2 and is also in a Segway segment (Hoffman et al. 2012) associated with transcription factor activity. rs174455 flanks an active transcription start site region of FADS3. Finally, rs174465 is in the promoter of FADS3. Though some of these sites are located in interesting genomic features, it still remains unclear which are causal. All annotations are listed in supplementary table 4, Supplementary Material online.
Phenotypic Associations
We interrogated data from three previously published GWAS studies to further investigate the functional impact of variants in the FADS region. These studies differ, not only in the cohorts analysed but also in the phenotypic scored for each individual. They therefore all contribute slightly different information. The Global Lipids Genetics Consortium GWAS associates variants within the FADS region with general lipid-related phenotypes. The ADDITION-PRO Metabolomics Study associates variants with a SC-PUFA precursor to LC-PUFAs. Most significantly, the combined Nurses’ Health Study and Health Professionals Follow-up Study links variants directly to a LC-PUFA phenotype as well as an interesting related gene-diet interaction.
Global Lipids Genetics Consortium GWAS
There are multiple known associations between SNPs in the FADS region and lipid- and metabolism-related phenotypes (Mathias et al. 2011; Ameur et al. 2012; Hester et al. 2014; Fumagalli et al. 2015). The Global Lipids Genetics Consortium (2013) (GLGC) carried out the most comprehensive GWAS study for loci that influence lipid metabolism, using genomic data from 188,577 individuals of primarily European ancestry. The GWAS study specifically examined high-density lipoprotein cholesterol (HDL), low-density lipoprotein cholesterol (LDL), total cholesterol (TC), and triglyceride (TG) phenotypes. Only 4 loci, out of 157 loci associated with lipid levels at P ≤ 5 x 10⁻⁸, were associated with effects on all 4 phenotypes (HDL, LDL, TC, and TG). One of these four loci was the FADS gene cluster. We used LocusZoom (Pruim et al. 2010) to generate plots with the publically available GLGC GWAS data. Figure 5 includes 3 such plots depicting GWAS results for LDL while plots for HDL, TC and TG can be found in supplementary figure 4, Supplementary Material online. In figure 5, panel A is centered on rs174546 in FADS1, while panel B and panel C are centered around an HDS from the remaining genes, rs97384 in FADS2 and rs174455 in FADS3. The panels show approximate LD relationships by color-coding the markers’ r2 values with respect to the labeled SNP in the center of each plot. Of these three SNPs, rs174546 shows the strongest phenotypic associations, specifically linking the presence of the derived allele (C) with increased levels of LDL, HDL, TC and decreased levels of TG (P values 2×10−39, 8×10⁻²⁸, 3×10−37, 7×10−38). rs174546 also showed the greatest LD with neighboring SNPs, despite the fact that rs97384 and rs174455 have undergone stronger changes in allele frequencies over the last 4,000 years.
Fig. 5.
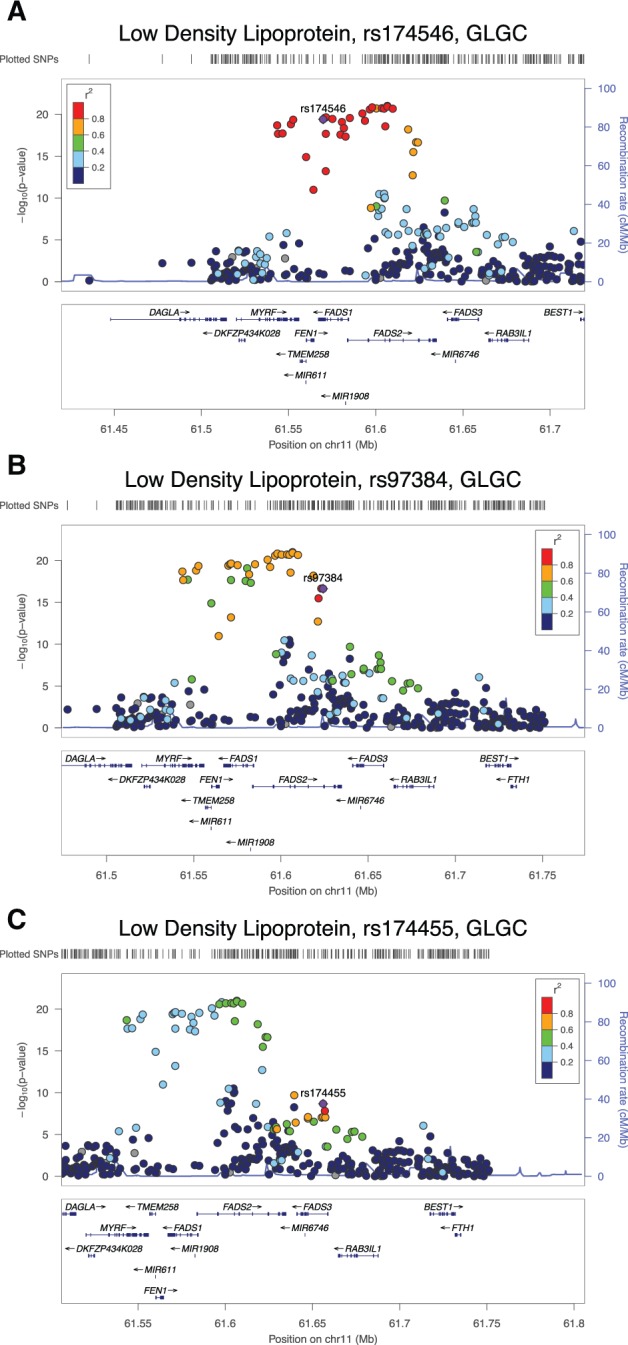
LocusZoom plots for 3 HDSs using HDL cholesterol data from the Global Lipids Genetics Consortium joint GWAS. We note in (A) that rs174546 in FADS1 is the most significant SNP across the entire region. It is also in high LD with all other similarly significant SNPs in the region. (B) This includes SNP rs97384 from FADS2, which despite its relatively large allele frequency change, is not particularly significant in the GWAS. (C) This shows a plot for rs174455, the most prominent SNP in FADS3.
ADDITION-PRO Metabolomics Study
To further investigate phenotypic associations, we queried the Danish ADDITION-PRO study (Johansen et al. 2012), which contains data from 2,082 participants for 231 lipid-related phenotypes obtained at 3 time points (after fasting and 30 and 120 min after oral intake of 75 g glucose) as part of an oral glucose tolerance test (table 4 and supplementary table 5, Supplementary Material online). The database does not contain LC-PUFAs, but it does contain a phenotype related to SC-PUFAs: linoleic acid to total fatty acids ratio, and this phenotype is in fact the phenotype for which we find the strongest association. For both rs174594 and rs174546 the derived alleles are associated with a decrease in the level of linoleic acid (P < 10−9, Bonferroni-corrected). The second most significant phenotypic association (P < 10−8) was between rs174546 and the “estimated degree of unsaturation”. In this case, the effect of the derived allele was to increase the degree of unsaturation, which is consistent with the notion that the derived allele promotes rapid conversion of SC-PUFAs (such as linoleic acid) to LC-PUFAs.
Table 4.
Top Associations from AdditionPRO Metabolomics GWAS.
| SNP | P value | Derived Allele Effect Size | Phenotype |
|---|---|---|---|
| rs174546 | 2.71E-13 | −0.924 | Linoleic acid/fatty acids (fasting) |
| rs174546 | 2.98E-13 | −0.9114 | Linoleic acid/fatty acids (30 min) |
| rs174594 | 9.16E-13 | −0.9418 | Linoleic acid/fatty acids (fasting) |
| rs174546 | 2.7E-12 | 0.02137 | Estimated degree of unsaturation (120 min) |
| rs174546 | 4.44E-12 | −0.8802 | Linoleic acid/fatty acids (120 min) |
| rs174594 | 4.72E-12 | −0.902 | Linoleic acid/fatty acids (30 min) |
| rs174594 | 2.43E-11 | −0.8874 | Linoleic acid/fatty acids (120 min) |
| rs174594 | 8.77E-10 | 0.01948 | Estimated degree of unsaturation (120 min) |
| rs174546 | 9.7E-10 | 0.01726 | Estimated degree of unsaturation (fasting) |
| rs174546 | 9.85E-10 | 0.01749 | Estimated degree of unsaturation (30 min) |
Nurses’ Health Study and the Health Professionals Follow-Up Study
An analysis of the combined Nurses’ Health Study (NHS) and Health Professionals Follow-Up Study (HPFS) GWAS results yielded further evidence of phenotypic associations. The analysis of biological samples included measurements of LC-PUFAs (EPA and ARA), total cholesterol and lipoprotein concentrations, as well as key metabolites and products directly influenced by FADS activity. We queried our four HDSs and found the strongest associations with rs174594 for different fatty acid phenotypes (see supplementary table 6, Supplementary Material online). The derived allele of rs174594 showed positive associations with plasma EPA levels (beta = 0.096 increase in concentration [measured as percent of total fatty acids] per derived allele [95% CI 0.069–0.12], P value <0.0001), plasma ARA levels (beta = 1.18 increase in concentration per derived allele [95% CI 1.06–1.30], P value <0.0001), as well as higher plasma total and LDL cholesterol levels (beta = 3.50 mg/dl per derived allele [95% CI 0.99–6.01] for total cholesterol and 3.03 mg/dl [95% CI 0.76–5.30], P value = 0.006 and 0.009, respectively). These results reinforce the associations with cholesterol from the GLGC GWAS. This confirms the hypothesized phenotypic effect of the selected variants in terms of increased EPA and ARA levels of the putatively positively selected variants in the European population. We also tested whether the effect of dietary intake of EPA on cholesterol levels differed across genotypes of rs174594. Interestingly, we observed that the slope of the relationship between EPA intake and total cholesterol decreased with each copy of the derived allele (from 53.9 mg/dl per g/day of intake for CC homozygotes [95% CI: 15.2–92.7] to −3.49 for AA homozygotes [95% CI: −21.7–14.7], interaction P value = 0.02). Results for LDL cholesterol were similar (table 5). This suggests individuals with the derived allele appear to be somewhat protected from the negative effects of increased EPA intake on plasma cholesterol levels.
Table 5.
Interaction Between Dietary Intake of EPA and rs174594 on Plasma Cholesterol and LDL Cholesterol Levels in the Nurses Health Study and Health Professionals Follow-Up Study.
| Beta SE | P value | ||
|---|---|---|---|
| Total Cholesterol (mg/dl) | |||
| Intercept | 174.9 | 3.56 | |
| rs174594 | 5.8 | 1.69 | 0.0005 |
| Dietary intake of EPA (g/day) | 53.9 | 19.76 | 0.0063 |
| rs174594*EPA intake | −28.7 | 12.60 | 0.02 |
| LDL Cholesterol | |||
| Intercept | 114.3 | 3.23 | |
| rs174594 | 5.4 | 1.53 | 0.0004 |
| Dietary intake of EPA (g/day) | 49.5 | 17.91 | 0.006 |
| rs174594*EPA intake | −28.9 | 11.42 | 0.01 |
rs174594 modeled as per additional copy of the derived allele (A).
Taken together, the NHS/HPFS and the ADDITION-PRO GWAS results provide evidence that alleles selected in Europe are associated with a decrease in linoleic acid levels and an increase in eicosapentaenoic acid, suggesting a more rapid conversion of SC-PUFAs to LC-PUFAs. This conclusion is in accordance with the observations in Enroth et al. (2013) showing improved long chain PUFA synthesis for the FADS1 derived haplotype.
Discussion
Analysing sequencing data from Bronze Age individuals allowed us to obtain a high-resolution picture of allele frequency changes in the FADS gene cluster. Mathieson et al. (2015) previously showed that selection has acted recently in the FADS region in Europe. The lead SNP from that study (rs174546) is located in FADS1 and could be a target of selection. However, the observed changes in allele frequency in Europe through time are best explained in a statistical model by selection acting on one of the HDSs in FADS2, or on a combination of these SNPs and the previously identified indel (rs66698963) or rs174557 shown to have a causal effect on expression (Pan et al. 2017). Given its effect on expression shown using reporter assays (Pan et al. 2017), rs174557 is a highly likely target. We show that selective pressures in Europe, Greenland, Africa, and South Asia have driven allele frequency changes in different FADS SNPs that are only in weak LD with each other. We also find evidence of allelic heterogeneity in FADS1 and FADS2. Presumably, there are many SNPs in the region affecting fatty acid desaturase activity that can serve as substrates for selection under varying environmental/dietary conditions. We also observe that the FADS region harbors highly differentiated haplotypes with genetic variability dating to much older times than the split from Denisovans and Neanderthals, although the pattern seen in the region is not compatible with standard models of adaptive introgression.
The alleles with the largest allele frequency changes in Europe are strongly associated with expression changes in FADS1 and FADS2, and are also associated with multiple lipid-related phenotypes: in particular, reduced linoleic acid levels. This is exactly the opposite pattern as observed for the selected alleles in the Inuit (Fumagalli et al. 2015), a population where it is hypothesized that selection acted to decrease conversion of SC-PUFAs to LC-PUFAs to compensate for the relative high dietary intake of LC-PUFAs. Fumagalli et al. (2015) showed that the favored allele in Inuit was associated with increased levels of linoleic acid and α-linolenic acid, and decreased levels of arachidonic acid and eicosapentaenoic acid. However, in Europe, selection has favored alleles associated with a decrease in linoleic acid levels and an increase in eicosapentaenoic acid (fig. 6), potentially due to an improved capacity to metabolize LC-PUFAs from SC-PUFAs. We hypothesize that this may be an adaptation to a diet rich in fatty acids derived from plant sources, but relatively poor in fatty acids derived from fish or mammals. The introduction and spread of agriculture in Europe likely produced a radical dietary shift in populations that embraced this practice. Agricultural diets would have led to a higher consumption of grains and other plant-derived foods, relative to hunter-gatherer populations. Alleles that increase the rate of conversion of SC-PUFAs to LC-PUFAs would therefore have been favored. Such selection would have started during Neolithic times and continued throughout the Bronze Age. The selection we observe by comparing Bronze Age and modern samples, therefore, represents only a portion of the total selection.
Fig. 6.

Summary model. The adoption of an agricultural diet would have increased LA and decreased ARA and EPA consumption, potentially causing a deficiency in LC-PUFAs. Selection would have then favored the derived haplotype which is associated with increased FADS1 and decreased FADS2 expression, as well as decreased LA and increased ARA and EPA levels.
The fact that strong selection is acting on common alleles segregating in Europeans in the FADS region suggests that these alleles may be very important in determining the relative nutritional benefits of diets differing in their fatty acid composition. There has been substantial debate on the possible benefits of a high intake of PUFAs. It is possible that variants in the FADS region may underlie individual differences in optimal dietary fatty acid profiles. If so, the FADS region variants might help guide the development of individualized diets informed by genomics. However, functional studies of the region, possibly in cell cultures, are needed to determine the effects of individual SNPs on desaturase activity. Likewise, more epidemiological studies are needed to identify possible interactions between genetic variants in the FADS region and diet, and their joint effect on human health in general.
Materials and Methods
Haplotype Network and Structure Analysis
First, we used Haploview v4.1 (Barrett et al. 2005) to produce linkage disequilibrium (LD) plots using the SNP data from the HapMap project (International HapMap 3 Consortium 2010) (fig. 3 and supplementary fig. 1, Supplementary Material online). We selected the 30 most frequent haplotypes from the 1000 Genomes data (1000 Genomes Project Consortium 2015) in each of the two main LD blocks in the FADS region. We then plotted them in a haplotype network using the R package pegas (Paradis et al. 2010) along with the Altai Neanderthal (Prüfer et al. 2014) and Denisova (Meyer et al. 2012) haplotypes (fig. 3 and supplementary fig. 3, Supplementary Material online). A software for producing equivalent plots is now implemented in the software HaploStrips (Marnetto and Huerta-Sánchez 2017). We also plotted the haplotype structure of the two blocks in each of the 1000 Genomes super-populations. We selected SNPs with >5% minor allele frequency in each super-population. We then ordered the resulting haplotypes by decreasing similarity to either the Denisova or the Altai Neanderthal genome, using Hamming distances, as in Racimo, Gokhman, et al. (2017).
Estimation of Allele Frequency Changes
Allele frequencies changes were calculated in R (version 3.1.2) by taking the absolute values of the allele frequency differences across the FADS region (chr11: 61567097–61659006) between two population panels. We used the 1000 Genomes Project Phase 3 data (Genomes Project et al. 2015), specifically the five populations of European ancestry CEU, GBR, FIN, IBS, and TSI (often combined into a super population denoted as EUR), and an ancient DNA data set comprised of low-coverage (0.7× average coverage) sequencing data from 101 Bronze Age Eurasians (Allentoft et al. 2015). In several comparisons, we used a subset of the Bronze Age Eurasians dataset, consisting of 57 Bronze Age Europeans whose samples were collected west of the Ural Mountains.
Expression Data
All eQTL data was obtained through queries of the GTEx Release V6 (dbGaP Accession phs000424.v6.p1) (Lonsdale et al. 2013).
CAVIAR Analyses
CAVIAR (CAusal Variants Identification in Associated Regions) is a probabilistic method that was originally developed to detect a confidence set of SNPs that contains all the causal variants with a predefined probability ρ (e.g., 90% or 95%) in a locus (Hormozdiari et al. 2014) taking local LD into account. Recently, we extended CAVIAR to detect allelic heterogeneity (Hormozdiari et al. forthcoming). Allelic heterogeneity (AH) is a phenomenon where more than one variant simultaneously affects a phenotype. CAVIAR incorporates the observed marginal statistics and LD structure to detect loci that harbor AH. Levering the fact that the marginal statistics follow a MVN distribution given the set of variants that are causal, we can quantify the probability of having a certain number of causal variants in a locus. We have shown that CAVIAR (Hormozdiari et al. in preparation) has a low false negative rate in detecting loci that harbor AH even when the true causal variants are uncollected. Thus, CAVIAR most likely accurately detects true loci that harbor AH.
Association Analyses—ADDITION-PRO
The ADDITION-PRO study (2009–2011) (Johansen et al. 2012) is a continuation of the Danish arm of the ADDITION study (2001–2006) (Lauritzen et al. 2000), in which individuals with normal glucose tolerance (NGT), impaired fasting glycaemia (IFG), impaired glucose tolerance (IGT) or type 2 diabetes are followed. A total of 2082 participants have undergone an extensive examination, including detailed characterization of glycemic status based on a 3-point OGTT. Ethical approval was obtained from the Scientific Ethics Committee of the Central Denmark Region (journal no. 20080229) and all participants provided oral and written informed consent before participating in the study. Genotyping was performed using the Illumina Infinium HumanCoreExome Beadchip platform (Illumina, San Diego, CA) and genotypes were called using the Genotyping module (version 1.9.4) of GenomeStudio software (version 2011.1, Illumina). Blood samples for the measurement of lipid-related phenotypes were collected in EDTA tubes and put on ice immediately, centrifuged to collect the plasma content, and stored at −80°. Samples were taken out from −80° and thawed overnight in a refrigerator prior to sample preparation. Proton nuclear magnetic resonance (NMR) spectroscopy was used for measurement. NMR methods have been described in detail previously (Kettunen et al. 2016). Genotype–phenotype correlations were studied with PLINK version 1.07 (Purcell et al. 2007) using linear regression analyses adjusted for age, sex, BMI and glucose level at the time point.
Association Analyses—NHS/HPFS
The Nurses’ Health Study (NHS) is an ongoing prospective cohort study of 121,700 female registered nurses from 11 US states who were 30–55 years of age at study initiation in 1976. The Health Professionals Follow-Up Study (HPFS) is a similar prospective study consisting of 51,529 male health professionals from all US states who were 40–75 years of age at baseline in 1986. For both cohorts, mailed questionnaires were administered biennially to assess lifestyle factors and health status, with a follow-up rate exceeding 90% for each 2-year cycle. Between 1989 and 1990, a total of 32,826 NHS participants provided a blood sample. With a similar protocol, blood samples were collected from 18,225 HPFS participants between 1993 and 1995. In both cohorts, the blood samples were returned via an overnight courier, and most (≥95%) of the blood samples arrived within 24 h of phlebotomy. On arrival, samples were centrifuged and divided into aliquots in cryotubes as plasma, buffy coat, and erythrocyte fractions, which were then stored in liquid nitrogen freezers at −130 °C or colder until analysis. We analysed 2,288 European-ancestry women and men who were free of CHD at time of blood collection in the NHS and HPFS. These subjects were selected as a nested case-control study of CHD (n = 342 cases for NHS and n = 435 cases for HPFS) and were genotyped using the Affymetrix 6.0 SNP array (Jensen et al. 2011). Genotypes were imputed using MACH and the 1,000 Genomes Project Phase 1 v3 reference panel. Plasma fatty acid concentrations were analysed by gas-liquid chromatography as described previously by (Malik et al. 2015). The concentration of each fatty acid was expressed as a percentage of the total fatty acid content. Concentrations of total cholesterol and high-density lipoprotein cholesterol (HDL-C) were measured with a Hitachi 911 analyzer using reagents and calibrators from Roche Diagnostics (Indianapolis, IN). Low-density lipoprotein cholesterol levels were determined with a homogenous direct method from Genzyme (Cambridge, MA).
Association analyses were conducted using linear regression, regressing fatty acid and lipid measurements on genotype dosages. For interaction analyses, we estimated dietary intake of EPA with validated food frequency questionnaires inquiring about intake over the year prior to blood draw (1990 in NHS and 1994 in HPFS).
Supplementary Material
Supplementary data are available at Molecular Biology and Evolution online.
Supplementary Material
Acknowledgments
This work was supported in part by NIH grant R01GM116044-01 to RN. The Nurses' Health Study (NHS) and Health Professionals Follow-Up Study (HPFS) were supported by UM1 CA186107, HL34594, CA87969, CA49449, HL35464, CA55075, R01 HL088521, CA186107, CA87969, CA49449, HL60712, and CA167552 from the National Institutes of Health, Bethesda, MD, with additional support for genotyping from Merck Research Laboratories, North Wales, PA.
References
- Alexander DH, Novembre J, Lange K.. 2009. Fast model-based estimation of ancestry in unrelated individuals. Genome Res. 19:1655–1664. [DOI] [PMC free article] [PubMed] [Google Scholar]
- Allentoft ME, Sikora M, Sjogren KG, Rasmussen S, Rasmussen M, Stenderup J, Damgaard PB, Schroeder H, Ahlstrom T, Vinner L, et al. 2015. Population genomics of Bronze Age Eurasia. Nature 522:167–172. [DOI] [PubMed] [Google Scholar]
- Ameur A, Enroth S, Johansson A, Zaboli G, Igl W, Johansson AC, Rivas MA, Daly MJ, Schmitz G, Hicks AA, et al. 2012. Genetic adaptation of fatty-acid metabolism: a human-specific haplotype increasing the biosynthesis of long-chain omega-3 and omega-6 fatty acids. Am J Hum Genet. 90:809–820. [DOI] [PMC free article] [PubMed] [Google Scholar]
- Barrett JC, Fry B, Maller JDaly MJ.. 2005. Haploview: analysis and visualization of LD and haplotype maps. Bioinformatics 21:263–265. [DOI] [PubMed] [Google Scholar]
- Bokor S, Dumont J, Spinneker A, Gonzalez-Gross M, Nova E, Widhalm K, Moschonis G, Stehle P, Amouyel P, De Henauw S, et al. 2010. Single nucleotide polymorphisms in the FADS gene cluster are associated with delta-5 and delta-6 desaturase activities estimated by serum fatty acid ratios. J Lipid Res. 51:2325–2333. [DOI] [PMC free article] [PubMed] [Google Scholar]
- Cho HP, Nakamura M, Clarke SD.. 1999. Cloning, expression, and fatty acid regulation of the human Δ-5 desaturase. J Biol Chem. 274:37335–37339. [DOI] [PubMed] [Google Scholar]
- Darios F, Davletov B.. 2006. Omega-3 and omega-6 fatty acids stimulate cell membrane expansion by acting on syntaxin 3. Nature 440:813–817. [DOI] [PubMed] [Google Scholar]
- Davydov EV, Goode DL, Sirota M, Cooper GM, Sidow A, Batzoglou S.. 2010. Identifying a high fraction of the human genome to be under selective constraint using GERP ++. PLoS Comput Biol. 6:e1001025.. [DOI] [PMC free article] [PubMed] [Google Scholar]
- DeGiorgio M, Lohmueller KE, Nielsen R.. 2014. A model-based approach for identifying signatures of ancient balancing selection in genetic data. PLoS Genet. 10:e1004561.. [DOI] [PMC free article] [PubMed] [Google Scholar]
- Enroth S, Ameur A, Johansson A, Gyllensten U.. 2013. Omega-3 and omega-6 fatty acids are more efficiently synthesized in populations having a high frequency of the derived FADS-haplotype. Int J Circumpolar Health 72:511–512. [Google Scholar]
- Field Y, Boyle EA, Telis N, Gao Z, Gaulton KJ, Golan D, Yengo L, Rocheleau G, Froguel P, McCarthy MI, et al. 2016. Detection of human adaptation during the past 2000 years. Science 354:760.. [DOI] [PMC free article] [PubMed] [Google Scholar]
- Fumagalli M, Moltke I, Grarup N, Racimo F, Bjerregaard P, Jørgensen ME, Korneliussen TS, Gerbault P, Skotte L, Linneberg A, et al. 2015. Greenlandic Inuit show genetic signatures of diet and climate adaptation. Science 349:1343–1347. [DOI] [PubMed] [Google Scholar]
- Genomes Project C, Auton A, Brooks LD, Durbin RM, Garrison EP, Kang HM, Korbel JO, Marchini JL, McCarthy S, McVean GA, et al. 2015. A global reference for human genetic variation. Nature 526:68–74. [DOI] [PMC free article] [PubMed] [Google Scholar]
- Glaser C, Lattka E, Rzehak P, Steer C, Koletzko B.. 2011. Genetic variation in polyunsaturated fatty acid metabolism and its potential relevance for human development and health. Matern Child Nutr. 7(Suppl 2):27–40. [DOI] [PMC free article] [PubMed] [Google Scholar]
- Hester AG, Murphy RC, Uhlson CJ, Ivester P, Lee TC, Sergeant S, Miller LR, Howard TD, Mathias RA, Chilton FH.. 2014. Relationship between a common variant in the fatty acid desaturase (FADS) cluster and eicosanoid generation in humans. J Biol Chem. 289:22482–22489. [DOI] [PMC free article] [PubMed] [Google Scholar]
- Hoffman MM, Buske OJ, Wang J, Weng Z, Bilmes JA, Noble WS.. 2012. Unsupervised pattern discovery in human chromatin structure through genomic segmentation. Nat Methods 9:473–476. [DOI] [PMC free article] [PubMed] [Google Scholar]
- Hormozdiari F, Kostem E, Kang EY, Pasaniuc B, Eskin E.. 2014. Identifying causal variants at loci with multiple signals of association. Genetics 198:497–508. [DOI] [PMC free article] [PubMed] [Google Scholar]
- Jensen MK, Pers TH, Dworzynski P, Girman CJ, Brunak S, Rimm EB.. 2011. Protein interaction-based genome-wide analysis of incident coronary heart disease. Circ Cardiovasc Genet. 4:549–556. [DOI] [PMC free article] [PubMed] [Google Scholar]
- Johansen NB, Hansen AL, Mygind Jensen T, Philipsen A, Rasmussen SS, Jorgensen ME, Simmons RK, Lauritzen T, Sandbaek A, Witte DR.. 2012. Protocol for ADDITION-PRO: a longitudinal cohort study of the cardiovascular experience of individuals at high risk for diabetes recruited from Danish primary care. BMC Public Health 12:1078.. [DOI] [PMC free article] [PubMed] [Google Scholar]
- Kettunen J, Demirkan A, Wurtz P, Draisma HH, Haller T, Rawal R, Vaarhorst A, Kangas AJ, Lyytikainen LP, Pirinen M, et al. 2016. Genome-wide study for circulating metabolites identifies 62 loci and reveals novel systemic effects of LPA. Nat Commun. 7:11122.. [DOI] [PMC free article] [PubMed] [Google Scholar]
- Kircher M, Witten DM, Jain P, O’Roak BJ, Cooper GM, Shendure J.. 2014. A general framework for estimating the relative pathogenicity of human genetic variants. Nat Genet. 46:310–315. [DOI] [PMC free article] [PubMed] [Google Scholar]
- Kothapalli KSD, Ye K, Gadgil MS, Carlson SE, O’Brien KO, Zhang JY, Park HG, Ojukwu K, Zou J, Hyon SS, et al. 2016. Positive selection on a regulatory insertion-deletion polymorphism in FADS2 influences apparent endogenous synthesis of arachidonic acid. Mol Biol Evol. 33:1726–1739. [DOI] [PMC free article] [PubMed] [Google Scholar]
- Lauritzen T, Griffin S, Borch-Johnsen K, Wareham NJ, Wolffenbuttel BH, Rutten G, Anglo-Danish-Dutch Study of Intensive Treatment in People with Screen Detected Diabetes in Primary C. 2000. The ADDITION study: proposed trial of the cost-effectiveness of an intensive multifactorial intervention on morbidity and mortality among people with Type 2 diabetes detected by screening. Int J Obes Relat Metab Disord. 24(Suppl 3):S6–11. [DOI] [PubMed] [Google Scholar]
- Lonsdale J, Thomas J, Salvatore M, Phillips R, Lo E, Shad S, Hasz R, Walters G, Garcia F, Young N, et al. 2013. The Genotype-Tissue Expression (GTEx) project. Nat Genet. 45:580–585. [DOI] [PMC free article] [PubMed] [Google Scholar]
- MacLean CH, Newberry SJ, Mojica WA, et al. 2006. Effects of omega-3 fatty acids on cancer risk: a systematic review. JAMA 295:403–415. [DOI] [PubMed] [Google Scholar]
- Malik VS, Chiuve SE, Campos H, Rimm EB, Mozaffarian D, Hu FB, Sun Q.. 2015. Circulating very-long-chain saturated fatty acids and incident coronary heart disease in US men and women. Circulation 132:260–268. [DOI] [PMC free article] [PubMed] [Google Scholar]
- Marnetto D, Huerta-Sánchez E.. 2017. Haplostrips: revealing population structure through haplotype visualization. Methods Ecol Evol. Advance Access published: January 28, 2017, doi: 10.1111/2041-210X.12747. [Google Scholar]
- Marquardt A, Stohr H, White K, Weber BH.. 2000. cDNA cloning, genomic structure, and chromosomal localization of three members of the human fatty acid desaturase family. Genomics 66:175–183. [DOI] [PubMed] [Google Scholar]
- Marszalek JR, Lodish HF.. 2005. Docosahexaenoic acid, fatty acid–interacting proteins, and neuronal function: breastmilk and fish are good for you. Annu Rev Cell Dev Biol. 21:633–657. [DOI] [PubMed] [Google Scholar]
- Mathias RA, Fu W, Akey JM, Ainsworth HC, Torgerson DG, Ruczinski I, Sergeant S, Barnes KC, Chilton FH.. 2012. Adaptive evolution of the FADS gene cluster within Africa. PLoS One 7:e44926.. [DOI] [PMC free article] [PubMed] [Google Scholar]
- Mathias RA, Sergeant S, Ruczinski I, Torgerson DG, Hugenschmidt CE, Kubala M, Vaidya D, Suktitipat B, Ziegler JT, Ivester P, et al. 2011. The impact of FADS genetic variants on ω6 polyunsaturated fatty acid metabolism in African Americans. BMC Genet. 12:50–50.. [DOI] [PMC free article] [PubMed] [Google Scholar]
- Mathieson I, Lazaridis I, Rohland N, Mallick S, Patterson N, Roodenberg SA, Harney E, Stewardson K, Fernandes D, Novak M, et al. 2015. Genome-wide patterns of selection in 230 ancient Eurasians. Nature 528:499–503. [DOI] [PMC free article] [PubMed] [Google Scholar]
- McCann JC, Ames BN.. 2005. Is docosahexaenoic acid, an n − 3 long-chain polyunsaturated fatty acid, required for development of normal brain function? An overview of evidence from cognitive and behavioral tests in humans and animals. Am J Clin Nutr. 82:281–295. [DOI] [PubMed] [Google Scholar]
- Meyer M, Kircher M, Gansauge M-T, Li H, Racimo F, Mallick S, Schraiber JG, Jay F, Prüfer K, de Filippo C et al. 2012. A High-Coverage Genome Sequence from an Archaic Denisovan Individual. Science 338:222. [DOI] [PMC free article] [PubMed] [Google Scholar]
- Pan G, Ameur A, Enroth S, Bysani M, Nord H, Cavalli M, Essand M, Gyllensten U, Wadelius C.. 2017. PATZ1 down-regulates FADS1 by binding to rs174557 and is opposed by SP1/SREBP1c. Nucleic Acids Res. 45(5):2408–2422. [DOI] [PMC free article] [PubMed] [Google Scholar]
- Paradis E. 2010. pegas: an R package for population genetics with an integratedmodular approach. Bioinformatics 26:419–420. [DOI] [PubMed] [Google Scholar]
- Patel JV, Tracey I, Hughes EA, Lip GY.. 2010. Omega-3 polyunsaturated acids and cardiovascular disease: notable ethnic differences or unfulfilled promise?. J Thromb Haemost. 8:2095–2104. [DOI] [PubMed] [Google Scholar]
- Paten B, Herrero J, Beal K, Fitzgerald S, Birney E. 2008. Enredo and Pecan: genome-wide mammalian consistency-based multiple alignment with paralogs. Genome Res. 18:1814–1828. [DOI] [PMC free article] [PubMed] [Google Scholar]
- Pruim RJ, Welch RP, Sanna S, Teslovich TM, Chines PS, Gliedt TP, Boehnke M, Abecasis GR, Willer CJ.. 2010. LocusZoom: regional visualization of genome-wide association scan results. Bioinformatics 26:2336–2337. [DOI] [PMC free article] [PubMed] [Google Scholar]
- Prüfer K, Racimo F, Patterson N, Jay F, Sankararaman S, Sawyer S, Heinze A, Renaud G, Sudmant PH, de Filippo C, et al. 2014. The complete genome sequence of a Neanderthal from the Altai Mountains. Nature. 505:43–49. [DOI] [PMC free article] [PubMed] [Google Scholar]
- Purcell S, Neale B, Todd-Brown K, Thomas L, Ferreira MA, Bender D, Maller J, Sklar P, de Bakker PI, Daly MJ, et al. 2007. PLINK: a tool set for whole-genome association and population-based linkage analyses. Am J Hum Genet. 81:559–575. [DOI] [PMC free article] [PubMed] [Google Scholar]
- Racimo F, Gokhman D, Fumagalli M, Ko A, Hansen T, Moltke I, Albrechtsen A, Carmel L, Huerta-Sanchez E, Nielsen R.. 2017. Archaic adaptive introgression in TBX15/WARS2. Mol Biol Evol. 34:509–524. [DOI] [PMC free article] [PubMed]
- Racimo F, Marnetto D, Huerta-Sánchez E.. 2017. Signatures of archaic adaptive introgression in present-day human populations. Mol Biol Evol. 34:296–317. [DOI] [PMC free article] [PubMed] [Google Scholar]
- Reardon HT, Zhang J, Kothapalli KSD, Kim AJ, Jung Park W, Thomas Brenna J.. 2012. Insertion–deletions in a FADS2 intron 1 conserved regulatory locus control expression of fatty acid desaturases 1 and 2 and modulate response to simvastatin. Prostaglandins Leukot Essent Fatty Acids 87:25–33. [DOI] [PMC free article] [PubMed] [Google Scholar]
- Rizos EC, Ntzani EE, Bika E, Kostapanos MS, Elisaf MS.. 2012. Association between omega-3 fatty acid supplementation and risk of major cardiovascular disease events: a systematic review and meta-analysis. JAMA 308:1024–1033. [DOI] [PubMed] [Google Scholar]
- Sankararaman S, Mallick S, Dannemann M, Prufer K, Kelso J, Paabo S, Patterson N, Reich D.. 2014. The genomic landscape of Neanderthal ancestry in present-day humans. Nature 507:354–357. [DOI] [PMC free article] [PubMed] [Google Scholar]
- Sankararaman S, Mallick S, Patterson N, Reich D.. 2016. The combined landscape of Denisovan and Neanderthal ancestry in present-day humans. Curr Biol. 26:1241–1247. [DOI] [PMC free article] [PubMed] [Google Scholar]
- Vernot B, Akey JM.. 2014. Human evolution: genomic gifts from archaic hominins. Curr Biol. 24:R845–R848. [DOI] [PubMed] [Google Scholar]
- Wang L, Athinarayanan S, Jiang G, Chalasani N, Zhang M, Liu W.. 2015. Fatty acid desaturase 1 gene polymorphisms control human hepatic lipid composition. Hepatology 61:119–128. [DOI] [PMC free article] [PubMed] [Google Scholar]
- Zhou X, Li D, Zhang B, Lowdon RF, Rockweiler NB, Sears RL, Madden PA, Smirnov I, Costello JF, Wang T.. 2015. Epigenomic annotation of genetic variants using the Roadmap Epigenome Browser. Nat Biotechnol. 33:345–346. [DOI] [PMC free article] [PubMed] [Google Scholar]
Associated Data
This section collects any data citations, data availability statements, or supplementary materials included in this article.