

Abstract
Spreading depolarizations of long cumulative duration have been implicated in lesion development and progression in patients with stroke and traumatic brain injury. Spreading depolarizations evolve less likely in the aged brain, but it remains to be determined at what age the susceptibility to spreading depolarizations starts to decline, especially in ischemia. Spreading depolarizations were triggered by epidural electric stimulation prior and after ischemia induction in the cortex of 7–30 weeks old anesthetized rats (n = 38). Cerebral ischemia was achieved by occlusion of both common carotid arteries. Spreading depolarization occurrence was confirmed by the acquisition of DC potential and electrocorticogram. Cerebral blood flow variations were recorded by laser-Doppler flowmetry. Dendritic spine density in the cortex was determined in Golgi-COX stained sections. Spreading depolarization initiation required increasingly greater electric charge with older age, a potential outcome of consolidation of cortical connections, indicated by altered dendritic spine distribution. The threshold of spreading depolarization elicitation increased with ischemia in all age groups, which may be caused by tissue acidosis and increased K+ conductance, among other factors. In conclusion, the brain appears to be the most susceptible to spreading depolarizations at adolescent age; therefore, spreading depolarizations may occur in young patients of ischemic or traumatic brain injury at the highest probability.
Keywords: Age, cerebral blood flow, electrophysiology, spreading depolarization, threshold
Introduction
Spreading depolarization (SD) has been implicated in the progressive expansion of primary lesions and neural injury subsequent to the primary insult in patients of subarachnoid hemorrhage, ischemic stroke, and traumatic brain injury.1–4
SD is an intense, local depolarization of a critical mass of cells, which propagates to adjacent cell populations in the cerebral gray matter by means of increasing extracellular K+ or glutamate concentration, involving both neuronal somata and dendritic arborizations.5 The dominating element of the cerebral blood flow (CBF) response following SD in the intact tissue is a remarkable, transient hyperemia; yet in the ischemic brain, the CBF response may undergo a gradual transformation to uncover ruling vasoconstrictive elements.6 This atypical SD-associated CBF variation during ischemia is believed to aggravate the metabolic supply-demand mismatch in the tissue and is thought to mediate the SD-related expansion of ischemic brain injury.4,6,7
While the incidence of ischemic stroke and subarachnoid hemorrhage steadily increases with age,8,9 traumatic brain injury most often occurs among the young, including children, adolescents and, most of all, young adults.10 Because higher SD frequency or longer total SD duration is thought to usher the progress of brain injury during ischemia,11,12 it is of importance to determine which age group is the most susceptible for the evolution of SD. This, in turn, could help to identify a segment of the population being at the highest risk for SD-related injury.
The neonatal nervous tissue appears to be too immature to sustain SD; in the intact rat brain, SD can first be induced experimentally between postnatal days 12–15.13 On the other hand, the aging nervous tissue proves to be increasingly resistant to experimental SD elicitation, requiring rising concentration of K+ to trigger SD.14,15 Similarly, the likelihood of spontaneous SD occurrence in the ischemic rat cortex decreases with age.16 It is, however, uncertain at what age the threshold of SD elicitation starts to rise, especially in ischemic tissue.
It is generally assumed that ischemia-induced SDs impose neurodegeneration by the insufficiency of the associated CBF response, which deprives the tissue at risk of essential nutrients required to maintain the ionic balance across neuronal cell membranes.6 We have recently demonstrated that the ischemic cerebral cortex of aged rats—in contrast with young adult ones—is excessively prone to the evolution of inverse neurovascular coupling with SD,15 which is possibly responsible for the intensified expansion of ischemic damage in the aged brain. Yet, it remains to be shown whether the kinetics of the SD-associated CBF response varies during young adulthood.
One of the most obvious features of SD propagation is the transient silencing of spontaneous and evoked synaptic activity, seen as a transient depression of the electrocorticogram (ECoG).17 We have previously shown that the SD-related ECoG depression is shortened in 10-month-old as compared with 2-month-old rats but its functional significance remained elusive.18
Taken together, here, we set out to determine the electric threshold of SD elicitation under non-ischemic and ischemic condition in young adult rats of increasing age. We also searched for any link between the threshold of SD elicitation and dendritic structure in the cortex. Further, we aimed to determine any potential variation in the SD-related CBF response in association with the advancing age during young adulthood. Finally, we implemented a detailed spectral analysis of the ECoG to identify the specific frequency bands that may be selectively affected by SD or by the progression of lifetime.
Materials and methods
Surgical procedures
The experimental procedures were approved by the National Food Chain Safety and Animal Health Directorate of Csongrád county, Hungary. The procedures were performed according to the guidelines of the Scientific Committee of Animal Experimentation of the Hungarian Academy of Sciences (updated Law and Regulations on Animal Protection: 40/2013. (II. 14.) Gov. of Hungary), following the EU Directive 2010/63/EU on the protection of animals used for scientific purposes and reported in compliance with the ARRIVE guidelines.
Young adult male Sprague-Dawley rats (n = 38) of increasing age (Table 1) were used in the study. The animals were purchased from the Charles River Laboratories, Hungary, were group-housed under a normal 12/12 h light/dark cycle, and had free access to food and drinking water. On the day of experiments, the animals were anesthetized with 1.5–2% isoflurane in N2O:O2 (70%:30%) and were allowed to breathe spontaneously throughout the experiment. Body temperature was maintained at 37℃ with a servo-regulated heating pad. Atropine (0.1%, 0.05 ml) was administered intramuscularly shortly before surgical procedures to avoid the production of airway mucus. A catheter was inserted into the right femoral artery to monitor the mean arterial blood pressure (MABP) continuously and the arterial blood gas levels before the elicitation of the first SD and before termination of the experiment (i.e., anesthetic overdose).
Table 1.
Composition of experimental age groups.
| Age of rats included in the study (weeks) | Body weight (g) | n | Age groups defined for data analysis | n |
|---|---|---|---|---|
| 7 | 276 ± 14 | 5 | 7–10 weeks | 21 |
| 8 | 332 ± 11 | 4 | ||
| 9 | 348 ± 11 | 5 | ||
| 10 | 377 ± 10 | 7 | ||
| 12 | 403 ± 19 | 6 | 12–16 weeks | 12 |
| 16 | 465 ± 12 | 6 | ||
| 30 | 608 ± 37 | 5 | 30 weeks | 5 |
Note: Data are given as mean ± stdev.
Next, a midline incision was made in the neck and both common carotid arteries were delicately separated from the surrounding tissue, including the vagal nerves. Lidocain (1%) was administered topically before opening each tissue layer. A silicone coated fishing line used as occluder was looped around each artery for later induction of cerebral ischemia. Rats were transferred to a stereotactic frame and fixed in prone position. Two cranial windows (∼3 × 3 mm) 1 mm apart were prepared over the right parietal cortex. The bone was carefully thinned using a dental drill (Technobox, Bien Air 810) and gently peeled away to reveal the dura surface. In the caudal window, a small hole was carefully cut on the dura for the positioning of an intracortical microelectrode and an adjacent laser-Doppler probe positioned above the cortical surface.
Recording of electrophysiological variables
For the concomitant recording of ECoG and slow cortical or direct current (DC) potential, a glass capillary electrode (20 µm outside tip diameter) filled with physiological saline was inserted 800–1000 µm deep into the cerebral cortex at the caudal window. An Ag/AgCl reference electrode was implanted under the skin of the animal’s neck. DC potential and ECoG were recorded via a high input impedance pre-amplifier (NL102G, NeuroLog System, Digitimer Ltd., United Kingdom), connected to a differential amplifier (NL106, NeuroLog System, Digitimer Ltd., United Kingdom) with associated filter and conditioner systems (NL125, NL530, NeuroLog System, Digitimer Ltd., United Kingdom). Potential line frequency noise (50 Hz) was removed by a high quality noise eliminator (HumBug, Quest Scientific Instruments Inc., Canada) without any signal attenuation. The resulting signal was digitalized by an analog/digital (A/D) converter (MP150, Biopac Systems Inc., USA) and continuously acquired at a sampling frequency of 1 kHz using the software Acqknowledge 4.2.0 (Biopac Systems Inc., USA).
Monitoring local cerebral blood flow
SD-associated changes in local CBF were recorded using laser-Doppler flowmetry (LDF). A laser Doppler needle probe (Probe 403 connected to PeriFlux 5000; Perimed AB, Sweden) was positioned right above the cortical surface at the penetration site of the glass capillary electrode with a micromanipulator, avoiding any large pial vessels. The signal was digitized and acquired, together with the DC potential and ECoG, essentially as described above.
Ischemia induction and SD elicitation
Following a baseline period of over an hour, persistent incomplete global forebrain ischemia was induced by occluding both common carotid arteries permanently (“2-vessel occlusion,” 2VO): occluders were pulled on until resistance was felt and then secured in place. Successful ischemia induction was confirmed by a sharp drop of the LDF signal.
A concentric bipolar needle electrode (tip size: 40 µm, Neuronelektród Kft., Hungary) was placed upon the dura in the rostral window for SD elicitation. It was connected to an opto-coupled stimulus isolator with a constant current output (NL 800, Digitimer Ltd., United Kingdom), a pulse generator (NL301), a with-delay panel (NL405), and a pulse buffer (NL510), which enabled the adjustment of amplitude and duration of the stimuli at will. Stimulation was implemented with a single, cathodal, and rectangular pulse. The charge delivered was quantified as , and it was raised stepwise with an interstimulus interval of 2 min until SD was observed. Whenever necessary, the position of the needle electrode was adjusted to optimize the contact between the electrode tip and the tissue. Successful elicitation of SD was confirmed by a negative DC-shift of an amplitude greater than 5 mV acquired by the recording electrode or by the obvious ECoG depression.
Three SDs were elicited during the baseline period, at an inter-SD interval of at least 20 min. Additional three SDs were generated during ischemia, the first triggered 20-min after ischemia onset or after the spontaneous occurrence of an SD event associated with ischemia induction (Figure 1).
Figure 1.
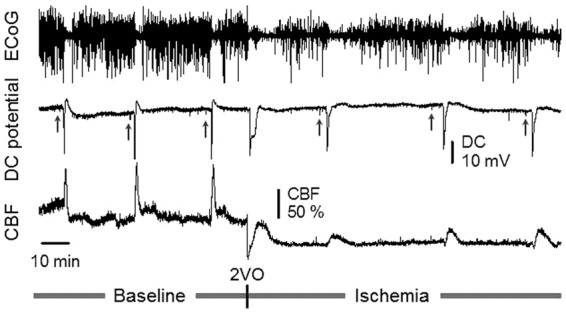
Representative, synchronous traces of the ECoG, DC potential, and CBF, acquired from an 8-week-old animal. Depression of the ECoG synchronous with a transient, negative shift of the DC potential and associated functional hyperemia together indicate SD occurrence. The label 2VO (bilateral common carotid artery occlusion, “2-vessel occlusion”) designates ischemia induction. Short vertical lines on the DC potential trace show the delivery of current to evoke SD (upward gray arrows). Ischemia induction was immediately followed by the occurrence of a single spontaneous SD.
Histology
In order to assess whether dendritic spine density changes with advancing age during young adulthood, additional 8-week-old (n = 5) and 30-week-old (n = 5) rats were deeply anesthetized with an overdose of chlorale hydrate (i.p.). The animals were transcardially perfused with ice cold saline, decapitated, and the brains quickly removed. The forebrains were cut in the coronal plane into two pieces of equal size and immersed in Golgi-COX solution mixed of the following stock solutions: (i) 5% potassium dichromate (Molar Chemicals Kft., Hungary), (ii) 5% potassium chromate (Molar Chemicals Kft, Hungary), and (iii) 5% mercuric chloride (VWR International, LLC).19 The tissue blocks were incubated for 10 days at room temperature, the solution being refreshed every 2–3 days. The brain samples were then transferred to 30% sucrose to be stored for at least 10 days at 4℃. Coronal slices of 200 µm were cut with a vibrating microtome, mounted on gelatin-coated microscopic slides, and stored overnight in a dark humidity chamber. Finally, the staining was developed with 30% ammonium hydroxide followed by Carestream Kodak Fixer (Sigma). Sections were then dehydrated and coverslipped with Eukitt (O. Kindler, Germany).
The stained brain slices were examined by a light microscope (Nikon Eclipse E600). Fifteen−sixteen cortical pyramidal neurons in layer 3 were studied in samples of each animal. Dendritic spine density of second- or third-order dendrites of the proximal apical dendrite was analyzed on a 50-µm-long segment. Serial z stack images of selected dendritic segments were created using a SPOT RT Slider digital camera (1600 × 1200 dpi in 8 bits) connected to the light microscope (Nikon Eclipse E600) and a computer equipped with an image processing software (Image Pro Plus 4.5; Media Cybernetics, Bethesda). Dendritic spines were counted by four independent investigators blind to the experimental groups, using the software Image J (v1.44, National Institute of Health, Bethesda).
Data analysis
All variables (i.e., DC potential, ECoG, LDF signal and MABP) were simultaneously acquired, displayed live, and stored using a personal computer equipped with a dedicated software (AcqKnowledge 4.2 for MP 150, Biopac Systems, Inc., USA). Data analysis was assisted by the inbuilt tools of the software.
Raw LDF recordings were downsampled to 1 Hz and then expressed relative to baseline by using the average CBF value preceding the first evoked SD (100%) and the recorded biological zero obtained after terminating the experiment (0%) as reference points.
The hyperemic elements of the SD-related CBF response were characterized by the magnitude of hyperemia, which was expressed as peak amplitude with respect to baseline. Hyperemia duration was determined at half amplitude.
ECoG spectral power analysis was applied for individual frequency bands as described previously.15 The parameters obtained were the following: (i) level of baseline (the mean spectral power for the 60-s interval preceding the onset of an SD); (ii) level of depression (the arithmetic mean between the endpoints of the downward and upward segments); (iii) duration of depression; and (iv) level of recovery (the mean spectral power for the 60-s interval following recovery). Along with the 30-week-old group (n = 5), six of the youngest animals (7/8 weeks) with clean ECoG trace (i.e., minimal noise) were selected for the analysis.
In order to determine dendritic spine density, the spine count of 15–16 dendritic segments assessed in each animal was averaged, and, thereby, a single value was taken for each rat for further statistical analysis.
Data are given as mean ± stdev. The software spss (IBM SPSS Statistics for Windows, Version 22.0, IBM Corp.) was used for statistical analysis. A one-way analysis of variance (ANOVA) model was used for the evaluation of dendritic spine density, the SD-associated CBF response, baseline ECoG power, and the duration of SD-related ECoG depression. A two-way ANOVA paradigm was applied for the evaluation of data concerning the electric threshold of SD elicitation (factors: age and ischemia) and ECoG power during the SD-related depression (factors: age and ischemia). A repeated measures ANOVA (factor: age) was used for the analysis of resting CBF, taken at selected time points over the course of experiments, and ECoG power variations over the course of experiments. Wherever appropriate, a Fisher post hoc test was used to reveal the differences between the experimental groups. Pearson two-tailed correlation analysis was carried out to test potential association between data sets. Levels of significance were defined as p < 0.05* and p < 0.01**.
Results
Preliminary screening of the acquired data sets revealed no age-related difference between the 7–10-week-old animals and the 12–16-week-old animals (inserts in Figure 3(a)), therefore, three age groups were created by uniting the 7–10-week-old and the 12–16-week-old populations (Table 1). MABP during baseline was statistically not different across groups (98 ± 4, 95 ± 3, and 107 ± 10 mmHg, 7–10-week-old, 12–16-week-old, and 30-week-old, respectively). Ischemia elevated MABP slightly but not significantly, without any notable impact of age (105 ± 5, 96 ± 4, and 114 ± 2 mmHg, 7–10-week-old, 12–16-week-old, and 30-week-old, respectively). Arterial blood gases were typically within the physiological range, with no significant effect of ischemia or age on either pCO2 or pH. Arterial blood glucose concentration taken during baseline and late ischemia was similar (e.g., 9.23 ± 1.7 vs. 9.20 ± 1.2 mmol/l, ischemia vs. baseline in 7–10-week-old) but significantly increased with advancing age (e.g., 11.95 ± 1.6 vs. 10.08 ± 1.0 vs. 9.2 ± 1.2 mmol/l, 30-week-old vs. 12–16-week-old vs. 7–10-week-old during baseline).
Figure 2.
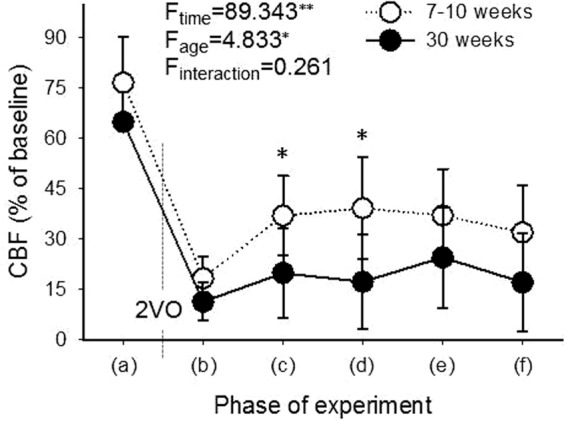
Level of local CBF in the youngest (7–10-week-old) and oldest (30-week-old) age groups, taken at selected time points of the experimental protocol: (a) prior bilateral common carotid artery occlusion (2VO), after the passage of the last SD elicited during baseline; (b) transient drop immediately after 2VO; (c) shortly before the first ischemic SD; (d) shortly before the second ischemic SD; (e) shortly before the third ischemic SD; (f) late ischemia, after the passage of the last SD elicited during ischemia. Data are presented as mean ± stdev. A repeated measures analysis of variance (ANOVA) paradigm considering age as a factor was applied for statistical analysis. Level of significance was defined as p < 0.01**. Post hoc analysis for group comparison at each time point revealed significant difference at (c) and (d). Level of significance was defined as p < 0.05*.
SDs occurred reliably upon electric stimulation of the cortex. In a number of experiments (25 of 38), a single, spontaneous SD evolved immediately after ischemia induction (Figure 1). The analysis of the DC potential signature of SDs demonstrated that the amplitude of spontaneous SDs (23.1 ± 7.8 mV) was statistically not different from SDs evoked during baseline (24.5 ± 3.8 mV) or ischemia (28.8 ± 5.8 mV). However, with spontaneous SDs, the duration at half amplitude of the DC shift was considerably longer—albeit with excessive variation (220.9 ± 316.0 s), as compared with SDs evoked during baseline (19.9 ± 5.1 s) or ischemia (80.7 ± 80.8 s). Such spontaneous events were not distinctively prevalent for any of the age groups, although only 2 of the 25 events were recorded in the 30-week-old group. Spontaneous SDs were not included in further data analysis.
The CBF response to SDs evoked was invariably hyperemic in all age groups under both baseline and ischemia. The CBF response to the first SD in each experiment differed from subsequent SDs in that hyperemia was often preceded by a short drop in CBF and was always followed by long-lasting oligemia.
Ischemia evolution and compensation for the reduction of cerebral blood flow after ischemia onset
In order to estimate how compensation for the reduction of CBF evolved following ischemia induction, CBF values were obtained prior to and shortly after ischemia onset, and in between SD events evoked during ischemia (Figure 2). In the youngest, 7–10-week-old group, CBF dropped to 18 ± 6% immediately after 2VO onset, recovered to 37 ± 12% before the elicitation of the first SD under ischemia, and was maintained over 30% throughout the ischemic period. In contrast, CBF fell to 11 ± 6% after ischemia induction, recovered to 20 ± 13% before initiation of the first ischemic SD, and remained at around only 20% in the 30-week-old group, implying significantly less efficient compensation in the 30-week-old group with respect to the 7–10-week-old group.
Electric threshold of SD elicitation
The electric threshold of SD elicitation was expressed as the lowest electric charge sufficient to trigger SD in the cortex (Figure 3(a)). We chose to trigger SDs by electric stimulation as opposed to high concentration K+ application, because the electric charge delivered can be finely tuned. This offers the accurate estimation of the electric threshold of SD elicitation to uncover any fine variations between age groups of a few weeks difference.
Figure 3.

Electric threshold of SD elicitation, and its association with CBF and the SD-related depression of the ECoG. (a) Electric threshold of SD elicitation prior and during incomplete forebrain ischemia (baseline: open symbols, ischemia: closed symbols). The 7–10-week-old animals and 12-16-week-old animals were treated as single groups, because no impact of age was observed on threshold values (see inserts). Data are represented as mean ± stdev. For the evaluation of statistical significance, a two-way ANOVA paradigm considering age and ischemia as its factors was followed by a Fisher post hoc test for age. Level of significance for the ANOVA was defined as p < 0.01**, and for the post hoc test as p < 0.01##, vs. 7–10 week-old and p < 0.05++, vs. 12–16 week-old. (b) Negative correlation between the electric threshold of SD elicitation and CBF prior SD evolution; each evoked SD was considered for the analysis. Pearson two-tailed correlation analysis including all age groups as one data pool indicated significant association between the threshold and CBF (p < 0.01**). (c) Correlation between the electric threshold of SD elicitation and the duration of SD-related depression on the beta frequency band of the ECoG. Data acquired from animals selected for ECoG spectral analysis are shown. Pearson two-tailed correlation analysis revealed significant association between the data sets (p < 0.01**).
In all age groups, the threshold of SD elicitation was significantly higher during ischemia, as compared with baseline. The initiation of SD required increasingly greater electric charge with older age during both baseline (4743 ± 1282 vs. 3076 ± 915 vs. 1661 ± 649 µC, 30-week-old vs. 12–16-week-old vs. 7–10-week-old) and ischemia (8447 ± 1763 vs. 5343 ± 2170 vs. 2514 ± 1032 µC, 30-week-old vs. 12–16-week-old vs. 7–10-week-old). Finally, with advancing age, the threshold during ischemia progressively departed from the threshold determined for the respective baseline: in other words, the difference between ischemia and baseline thresholds was approximately five times greater in the 30-week-old as compared with the 7–10-week-old group (threshold difference of 4278 ± 2352 vs. 853 ± 839 µC, 30-week-old vs. 7–10-week-old).
Next, we set out to determine any potential association between the electric threshold of SD elicitation and CBF or the cortex’ SD-related electrical activity. Lower CBF taken prior SD elicitation predicted higher threshold of SD elicitation (r = –0.403**) (Figure 3(b)). The threshold of SD elicitation positively correlated with the duration of SD-related depression of the high frequency alpha and beta bands (r = 0.373** and 0.478**, respectively) (Figure 3(c)) but not with the low frequency delta and theta bands (r = 0.247 and 0.234, respectively). No association with any other ECoG variable (i.e., power of baseline, depression, or recovery) emerged.
Density of dendritic spines
We set out to test the hypothesis that the increase in the threshold of SD elicitation due to brain maturation is determined—at least in part—by the dynamic structural development of the cortex, reflected by the morphological plasticity of dendritic spines. The animals admitted to the analysis were naive (i.e., neither ischemia nor SD was induced prior to sampling), therefore, potential dendritic spine density changes due to ischemia or SD propagation were not studied.
Dendritic spines on second- or third-order dendritic branches of layer 3 pyramidal neuronal apical dendrites were investigated (Figure 4(a)). In general, dendritic spines tended to be arranged in clusters rather than individually and appeared to be larger and more complex in shape in the 30-week-old group than in the 8-week-old group (Figure 4(b)). Dendritic spine density significantly increased in the 30-week-old group with respect to the 8-week-old group (55 ± 4 vs. 51 ± 2 spines/50 µm dendritic segment, 30-week-old vs. 8-week-old) (Figure 4(c)).
Figure 4.

Dendritic spine density on second- or third-order dendritic branches of apical dendrites of layer 3 pyramidal neurons. (a) Schematic drawing of a cortical pyramidal neuron to illustrate the position of dendritic segments investigated. (b) Representative images of 50-µm-long segments of second- or third-order dendrites in the 8-week-old and the 30-week-old groups. Images were obtained of original z-stack images by the enhancement of contrast and brightness in order to eliminate background. (c) Dendritic spine density on the selected dendritic segments. Data are given as mean ± stdev. A one-way ANOVA model was used for statistical analysis (n = 5 for each group, F = 6.263, p < 0.05*).
Features of the cerebral blood flow response associated with SD
For the evaluation of the SD-associated CBF response, SDs were sorted into three distinct categories: (i) SD1, (ii) subsequent SDs evoked during baseline, and (iii) SDs initiated under ischemia (Figure 5(a)).
Figure 5.
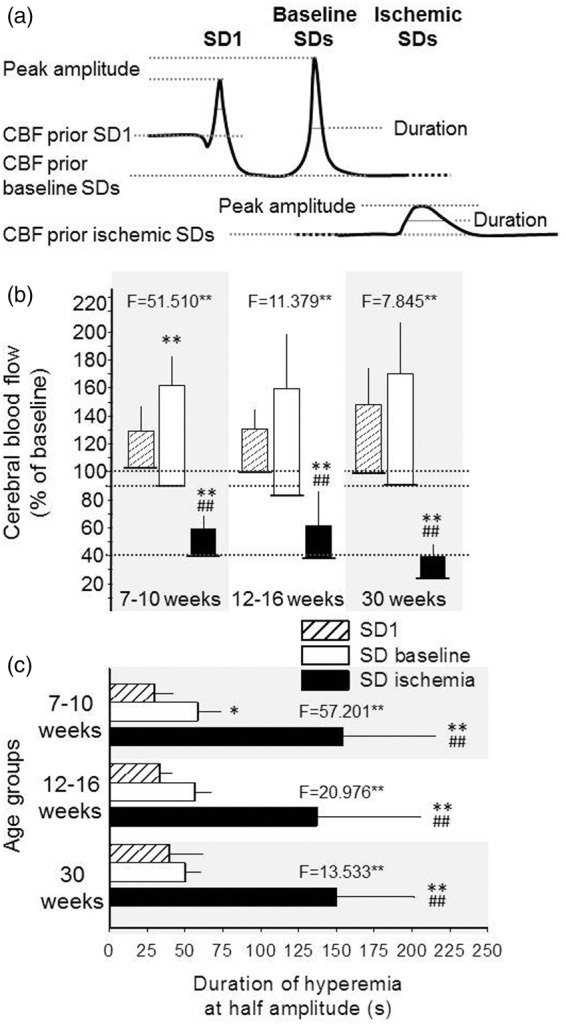
Quantitative analysis of the CBF response associated with SD. (a) Schematic drawings depicting the variables under study: CBF response to SD1, subsequent SDs during baseline (baseline SDs), and SDs evoked during ischemia (ischemic SDs). CBF level prior SD elicitation, peak amplitude, and duration at half amplitude were evaluated. (b) Peak CBF amplitude (bars) respective to CBF baseline prior SD elicitation (base of bars). (c) The duration of hyperemia at half amplitude. Data are expressed as mean ± stdev. For the evaluation of statistical significance, a one-way ANOVA paradigm followed by a Fisher post hoc test was used for each age group. Level of significance for the ANOVA was defined as p < 0.01**, and the F-values are given in each bar chart. Level of significance for the post hoc analysis is indicated as p < 0.05* and p < 0.01** vs. SD1; and p < 0.01## vs. baseline SDs.
As presented in Figure 5(b), CBF prior to the onset of baseline SDs was 10–15% lower than that prior to SD1 in all age groups (e.g., 90 ± 30 vs. 102 ± 12%, baseline SDs vs. SD1 in 7–10-week-old). The CBF response with SDs under ischemia took off from a markedly lower level (39 ± 15 and 38 ± 11%, 7–10-week-old, and 12–16-week-old, respectively), especially in the 30-week-old group (23 ± 14%). The SD-associated hyperemia peaked at around 160–170% in all age groups during baseline (i.e., 163 ± 45, 160 ± 61, and 170 ± 69%, 7–10-week-old, 12–16-week-old, and 30-week-old, respectively), approximately 20–30% higher than with SD1 (129 ± 23, 131 ± 17, and 149 ± 24%, 7–10-week-old, 12-16-week-old, and 30-week-old, respectively). During ischemia, the peak amplitude of the CBF response reached a considerably lower level (59 ± 23 and 61 ± 18%, %, in 7–10-week-old, and 12–16-week-old, respectively) with the lowest value measured in the 30-week-old group (39 ± 22%). Conspicuously, in the 30-week-old group, the CBF response with ischemic SDs set off from the lowest CBF level and reached the lowest peak (not even exceeding the resting CBF prior to SD elicitation in the 7–10- or the 12-16-week-old groups) (Figure 5(b)), although with no statistically significant reduction with respect to the younger age groups.
Figure 5(c) shows that the duration of the SD-related CBF response was shortest with SD1 (30 ± 12, 33 ± 7, and 39 ± 23 s, 7–10-week-old, 12–16-week-old, and 30-week-old, respectively), increased with subsequent SDs elicited during baseline (58 ± 14, 56 ± 11, and 50 ± 10 s, 7–10-week-old, 12–16-week-old, and 30-week-old, respectively), and more than doubled with SDs triggered under ischemia (154 ± 61, 137 ± 68 and 150 ± 52 s, 7-10-week-old, 12-16-week-old and 30-week-old, respectively). No impact of age on the duration of the SD-associated CBF response was observed.
Spectral analysis of the distinct ECoG frequency bands
Baseline ECoG power was assessed at the very beginning of the experiments, prior to any intervention, to test whether anesthesia affects the two age groups differently. No age-related difference was observed concerning any of the frequency bands studied (Figure 6(a)). ECoG power repeatedly sampled prior to SD events demonstrated that ischemia itself imposed a considerable power decrease on the overall ECoG, which was particularly prominent after the passage of the first SD evoked under ischemia. This is illustrated in Figure 6(b) for the theta band.
Figure 6.

Spectrum analysis of the ECoG for individual frequency bands during SD events. (a) ECoG power of each frequency band, for 60 s baseline at the very start of the experimental protocol, prior to any intervention. No significant difference between age groups was observed, for any of the frequency bands examined (one-way ANOVA). Note that the weight of low frequency bands in the spectrum is greater than that of higher frequency waves, which mainly reflects an inherent feature of ECoG spectra. Because the ECoG frequency bands represent a power spectrum, their values will vary exponentially, meaning the lower-frequency bands will have exponentially greater values than the higher-frequency bands. (b) Baseline ECoG power of the theta band, assessed repeatedly prior to events, in order to follow the distribution of baseline over the course of the experimental protocol. The first pair of symbols corresponds with theta in Panel A. Repeated measures ANOVA revealed that the ECoG power of baseline decreased, especially during ischemia, irrespective of age. (c) ECoG power of distinct frequency bands, calculated for the period of SD-related ECoG depression. The power of individual frequency bands is represented by bars positioned behind each other. Two-way ANOVA considering age and ischemia as its factors revealed that age significantly elevated the power of the alpha and theta bands selectively, irrespective of ischemia. Level of significance was defined as p < 0.05* and p < 0.01**. (d) Duration of ECoG depression with SDs evoked under baseline condition. The low frequency bands start to recover significantly sooner than the high frequency bands in the 30-week-old group (one-way ANOVA followed by a Fisher post hoc test, p < 0.05# vs. alpha, p < 0.05* and p < 0.01** vs. beta). (e) Negative correlation between the duration of the SD-related depression on the theta band of the ECoG, and the relative peak of SD-coupled hyperemia. Pearson two-tailed correlation analysis revealed significant association between these data sets (p < 0.01**). (f) Positive correlation between the duration of the SD-related depression on the theta band of the ECoG, and the duration of SD-coupled hyperemia. Pearson two-tailed correlation analysis indicated significant association between the data sets (p < 0.01**).
The novel findings of spectral analysis concerned the SD-related transient depression of the ECoG. Although the power of the four frequency bands during depression was similar under baseline and ischemia (i.e., ischemia exerted no impact), the selectively greater power of the alpha and theta bands in the 30-week-old group as compared with the 7/8-week-old group (e.g., theta band: 0.005 ± 0.003 vs. 0.0025 ± 0.001 V2, 30-week-old vs. 7/8-week-old) indicated incomplete depression of these two bands with the maturation of the brain, under both baseline and ischemic conditions (Figure 6(c)).
As expected, ischemia considerably extended the duration of ECoG depression on all four frequency bands (e.g., alpha band in the 7/8-week-old: 271 ± 126 vs. 139 ± 40 s, ischemia vs. baseline). Curiously, during baseline, the lower frequency delta and theta bands started to recover from the SD-related depression sooner than the higher frequency alpha and beta bands in the 30-week-old group, in contrast with the 7/8-week-old group (e.g., duration of theta band: 123 ± 52 vs. 132 ± 34 s, 30-week-old vs. 7/8-week-old) (Figure 6(d)).
The duration of the SD-related ECoG depression appeared to be associated with the SD-coupled CBF response: the relative peak of SD-associated hyperemia correlated negatively with the duration of ECoG depression on all four frequency bands, as illustrated for the theta band in Figure 6(e) (r = –0.550**). At the same time, the longer duration of hyperemia was strongly linked to the longer duration of ECoG depression on all four frequency bands, being most prominent on the delta and theta bands (r = 0.733** and r = 0.703**, respectively) (Figure 6(f)).
Discussion
Relevance of the findings to human brain injury
Recurrent SDs spontaneously occur in patients of subarachnoid hemorrhage, ischemic stroke, and traumatic brain injury.1–3 The findings of the present study can be interpreted in the context of both ischemic and traumatic brain injury for the following reasons. We studied the brain’s susceptibility to SD under two conditions: (i) in the intact and (ii) in the ischemic brain. The results obtained under ischemia are proposed to be relevant to cerebral ischemia evolving in patients of stroke or subarachnoid hemorrhage. The experiments done in the intact brain have revealed that increasing age, by itself, has a significant effect on the elicitation threshold of SD. Thus, the age-related overall susceptibility of the brain to SD may be a factor to determine the frequency of SD occurrence in any pathophysiological condition, traumatic brain injury being one of them.
In the present study, we relied on electric stimulation to elicit SDs and quantify the electric threshold of SD elicitation with precision. Yet, in the injured brain of patients, SDs occur spontaneously. The exact conditions that give rise to SD generation under ischemia are not absolutely clear but worsening oxygen supply-demand mismatch as a result of somatosensory activation, episodic hypoxemia, or hypotension has been shown to promote SD occurrence.20 Taken together, the risk of SD occurrence in the injured brain must be dependent on a combination of several factors, such as the severity of ischemia, insufficiency of oxygen delivery, and, as proposed here, the brain’s age-related susceptibility to sustain SD. Our argument is also supported by a previous study of ours showing that spontaneous SDs occur significantly less likely in the aged ischemic brain with respect to the young.16
Life span targeted
The present study aimed at investigating the electric threshold of SD elicitation and the evolution of the SD-coupled hemodynamic response in 7–30-week-old rats, with or without cerebral ischemia. This life span corresponds to human adolescence and young adulthood.21 The interpretation of the age-related aspects of the results with respect to previous reports is challenging: Studies on cerebral ischemia, which tackle the issue of age focus mainly either on the very early phase of life (i.e., birth and maturation) or old age (i.e., aging). The data presented here, therefore, may shed light on significant neurophysiological changes that take place during young adulthood.
Electric threshold to elicit spreading depolarization
Our recent studies have demonstrated that the threshold of SD elicitation increases with age: In the intact cortex, K+-induced, recurrent SDs occurred less frequently in 10-month-old rats as compared with their 2-month-old counterparts,18 and increasing concentration of K+ was required to evoke SDs in 2-year-old as compared with 2-month-old rats.15 In addition, spontaneous SDs in the ischemic cortex of 2-year-old rats emerged less likely with respect to 9-month-old animals.16 These findings urged us to determine at what exact age the threshold of SD elicitation starts to rise, especially in ischemic tissue.
Our present data clearly demonstrate that the electric threshold of SD elicitation markedly increases with ischemia as well as with the progression of lifetime during early adulthood (Figure 3(a)). Furthermore, the ischemia-related threshold elevation is increasingly more obvious with older age.
The ischemia-related increase of SD threshold may be the result of the metabolic state of the tissue, as indicated by the correspondence between lower CBF taken prior to evoking an SD with a higher electric threshold of SD elicitation (Figure 3(b)). The availability of glucose or the level of tissue pH may reflect tissue metabolic conditions. As such, high concentration of blood glucose (23–24 mmol/l) was shown to make the tissue resistant to SD in rats.22 Yet, our data on blood glucose level indicated normoglycemic conditions (blood glucose concentration around 9–11 mmol/l) in all age groups and revealed no difference between baseline and late ischemia. Therefore, we suspect that factors other than the availability of glucose must determine the ischemia-related inhibition of SD elicitation as seen here. Indeed, a study relying on live brain slices proved that tissue acidosis (i.e., pH 6.67–6.97, achieved by the elevation of pCO2 or withdrawal of bicarbonate) inhibited the induction and propagation of K+-induced SD.23 Decreasing pH possibly hampers SD propagation by inhibiting the activity of NMDA receptors.24 Tissue acidosis is widely accepted to prevail in cerebral ischemia; 2VO as imposed here shifts extracellular pH in the rat cerebral cortex from pH 7.3 to as low as pH 6.8 (our own measurements in the model used here). Therefore, we suggest that the ischemia-related fall of tissue pH could be a key factor in raising the threshold of SD elicitation as observed here. Finally, increased K+ conductance and the gradual accumulation of extracellular K+ that occur during ischemia generally contribute to membrane hyperpolarization and repolarization thereby depressing neuronal excitability.25 This ionic imbalance may effectively inhibit SD elicitation as well.
The increased threshold of SD elicitation with advancing age during early adulthood may be linked to structural changes in neuronal networks, which may alter the electrophysiological properties of the nervous tissue. The formation and retraction of dendritic spines that host the post-synaptic element of excitatory synapses dynamically changes with brain maturation26 and aging,27 is heavily involved in SD propagation,28 and is negatively affected by SD.29 Therefore, we set out to determine the dendritic spine density in the youngest and the oldest animals admitted to our study to contemplate on any potential link between age-related structural changes in the cortex, and the threshold of SD elicitation. Our results exhibited an increased density of dendritic spines on the apical dendrites of cortical layer 3 pyramidal neurons at 30 weeks of age with respect to 8 weeks of age (Figure 4), proving that the histological organization of the cortex undergoes detectable alterations during the life span investigated in this study. Even though a direct link between such fine structural changes and the excitability of neurons is challenging to establish, we speculate that the threshold of SD elicitation may increase with age during early adulthood because of the histological (and connected biochemical) maturation or consolidation of cortical connections.
CBF compensation following ischemia induction and CBF response to SD
Vascular occlusion is immediately followed by a sharp drop of perfusion pressure below the autoregulatory range and a marked reduction of CBF causing ischemia. In turn, the reduced level of ATP opens KATP channels on vascular smooth muscle cells, causing hyperpolarization and thus vasodilation. In addition, hypoxia rapidly increases adenosine production locally, also promoting vasodilation.30 This, together with compensating collateral flow or vascular remodeling contributes to a partial recovery of perfusion.31 Our previous work focusing on aging demonstrated that the ischemia-related perfusion deficit progressively deepened—rather than partially recovered—in the brain of 2-year-old animals as opposed to young adults in global and focal ischemia models.15,16 Here, we show that the impairment in flow compensation becomes first detectable as early as 30 weeks of age in the Sprague-Dawley rat (Figure 2). Taken the young adult age screened here, declining CBF compensation is suspected to root in altered vasoreactivity, rather than an age-related rarefaction of collateral vascular networks.32 Possibly, altered characteristics of KATP channel opening, ineffective adenosine signaling or restricted NO availability could potentially account for the less efficient flow compensation shortly after ischemia onset in our oldest age group.
The present results on the kinetics of the SD-related CBF response confirmed that the amplitude of hyperemia decreased, while the duration of hyperemia increased under ischemia in the young adult brain.15,33 Nevertheless, inverse neurovascular coupling, as encountered frequently in the aged ischemic brain earlier,15,16 did not evolve. Instead, an augmented, ischemia-related insufficiency of the SD-related CBF response was implied in the 30-week-old animals by the lowest absolute peak of the SD-associated hyperemia under ischemia (Figure 5(b)). Clearly, the failing flow compensation to ischemia set the scene for the reduced absolute amplitude of hyperemia in the 30-week-old group. At the same time, the relative amplitude of hyperemia appeared similar across age groups. Taken together, we conclude that neurovascular coupling during SD was impaired by ischemia, but this impairment was not enhanced by increasing age in young adult rats.
Distinct features of the ECoG power spectrum
Our data demonstrate that the alpha and theta frequency bands are less depressed during SD in the 30-week-old group as compared with the 7/8-week-old group (Figure 6(c)). ECoG was acquired through a glass capillary electrode inserted into the cortex, also used for the recording of the DC potential. The ECoG signal, therefore, represented a local field potential that contains both action potentials and other membrane potential-derived fluctuations in a small neuronal volume, approximately within a few hundred micrometers from the electrode tip.34 A very important factor determining the ECoG signal as recorded here is the cellular-synaptic architectural organization of the neuronal network.34 Here, we show that the dendritic spine density, for example, is age-dependent in young adulthood. It is thus conceivable that the age-related alterations of dendritic geometry may impact on selective frequencies of the ECoG power during the SD-related depression, which might be represented in the less obvious depression of given frequency bands (Figure 6(c)).
The duration of SD-related depression appeared shorter specifically on the delta and theta bands in the 30-week-old group, as compared with the 7/8-week-old group (Figure 6(d)). This suggests that the electrical activity in the low frequency range resumed sooner after the passage of SD at older age. These data are in full agreement with our previous report showing that the SD-related silence of the full ECoG is shortened in 10-month-old as compared with 2-month-old rats.18 Earlier, we speculated that the shorter ECoG depression with SD in the older animals could indicate the involvement of fewer neurons at any given time during SD propagation, thereby creating a narrower wave of depression. Taken that the low frequency component of the ECoG is thought to arrive at the tip of the recording electrode from more distant sites,34 the current data showing the shorter depression of the low frequency ECoG components support the concept of a narrower SD-related depression wave with older age.
The duration of ECoG depression appears to be associated with the features of the SD-coupled CBF response. The present correlation analyses demonstrate that a larger peak of SD-related hyperemia coincides with shorter depression of the ECoG (Figure 6(e)). This is complementary to previous reports describing that deeper initial hypoperfusion of the CBF response coincides with longer ECoG depression,18 and that longer duration of the initial hypoperfusion corresponds with longer DC shift duration with SD, in experimental models, as well as in patients of aneurysmal subarachnoid haemorrhage.35,36 Taken together, a more prominent dilator component in the CBF response (i.e., smaller magnitude of initial hypoperfusion or larger amplitude of hyperemia) appears to facilitate the faster return of the cortex’ electrical activity after the passage of SD.
Longer ECoG depression with SD was also associated with longer hyperemia (Figure 6(f)). Likewise, longer duration of the DC shift indicative of SD coincided with longer hyperemia.15 Since the recovery of resting membrane potential and thus normal electrical activity of the nervous tissue require the activity of the ATP-consuming Na+ pump,4 the return of CBF to baseline after hyperemia may be postponed by the continuing energy need, reflected by the longer duration of the electric silence with SD.
Conclusions
Recurrent SDs occur in ischemic and traumatic brain injury at high incidence and are thought to usher the expansion of tissue damage.1,2,4,37,38 The data presented here reveal that the susceptibility of the nervous tissue to SD is highest at adolescent or young adult age; yet, the prospect of successful recovery from ischemic or traumatic brain injury is considerably better for young as compared with old patients.39,40 These pieces of information would be apparently conflicting if all SDs possessed equally injurious potential.
Researchers now agree that SDs coupled with spreading ischemia promote lesion progression.4 Yet, individual SDs with hyperemic CBF response have not been explicitly proven either harmless or injurious in tissue at risk, especially because the SD-coupled CBF response, which appears hyperemic at the site of detection might turn into spreading ischemia as it propagates in areas not screened. Further, even though the longer cumulative duration of recurrent SDs was associated with the expansion of tissue damage in focal ischemia,11 this does not directly infer that the longer cumulative duration is the outcome of a higher number of events—indeed, the duration of individual SD events can vary considerably.4 Finally, we have previously demonstrated that although only a few SDs occur spontaneously in the aged ischemic brain, these events cause more damage than a higher number of SDs in the young brain, as indicated by a remarkable delay of repolarization after SD and the associated evolution of perfusion deficit.16
Taken together, the low threshold of SD elicitation indicates the brain’s high susceptibility for SD generation at young age, but it may not directly put the tissue at higher risk for SD-related injury. This notion needs to be explored further in subsequent experimental and clinical studies.
Funding
The author(s) disclosed receipt of the following financial support for the research, authorship, and/or publication of this article: This work was supported by grants from the Hungarian Scientific Research Fund (Grant No. K111923); the Hungarian Brain Research Program (Grant No. KTIA_13_NAP-A-I/13); TÁMOP-4.2.2.D-15/1/KONV-2015-0024; and the Bolyai János Research Scholarship of the Hungarian Academy of Sciences (BO/00327/14/5, to EF).
Declaration of conflicting interests
The author(s) declared no potential conflicts of interest with respect to the research, authorship, and/or publication of this article.
Authors’ contributions
Contributions are defined as listed among the “Editorial Policies” document of JCBFM^—Péter Hertelendy: acquisition, analysis and interpretation of data, drafting the article; Ákos Menyhárt: acquisition and interpretation of data, drafting the article; Péter Makra: analysis of data, drafting the article; Zoltán Süle: acquisition and analysis of data, drafting the article; Tamás Kiss: acquisition and analysis of data; Gergely Tóth: acquisition of data; Orsolya Ivánkovits-Kiss: acquisition and analysis of data, drafting the article; Ferenc Bari: revising the manuscript critically for important intellectual content, final approval of the version to be published; Eszter Farkas: substantial contributions to conception and design, drafting the article and revising it critically for important intellectual content, final approval of the version to be published.
References
- 1.Dreier JP, Woitzik J, Fabricius M, et al. Delayed ischaemic neurological deficits after subarachnoid haemorrhage are associated with clusters of spreading depolarizations. Brain 2006; 129: 3224–3237. [DOI] [PubMed] [Google Scholar]
- 2.Hartings JA, Watanabe T, Bullock MR, et al. Spreading depolarizations have prolonged direct current shifts and are associated with poor outcome in brain trauma. Brain 2011; 134: 1529–1540. [DOI] [PubMed] [Google Scholar]
- 3.Woitzik J, Hecht N, Pinczolits A, et al. Propagation of cortical spreading depolarization in the human cortex after malignant stroke. Neurology 2013; 80: 1095–1102. [DOI] [PubMed] [Google Scholar]
- 4.Dreier JP. The role of spreading depression, spreading depolarization and spreading ischemia in neurological disease. Nat Med 2011; 17: 439–447. [DOI] [PubMed] [Google Scholar]
- 5.Somjen GG. Mechanisms of spreading depression and hypoxic spreading depression-like depolarization. Physiol Rev 2001; 81: 1065–1096. [DOI] [PubMed] [Google Scholar]
- 6.Ayata C, Lauritzen M. Spreading depression, spreading depolarizations, and the cerebral vasculature. Physiol Rev 2015; 95: 953–993. [DOI] [PMC free article] [PubMed] [Google Scholar]
- 7.Dreier JP, Körner K, Ebert N, et al. Nitric oxide scavenging by hemoglobin or nitric oxide synthase inhibition by N-nitro-L-arginine induces cortical spreading ischemia when K+ is increased in the subarachnoid space. J Cereb Blood Flow Metab 1998; 18: 978–990. [DOI] [PubMed] [Google Scholar]
- 8.Chen RL, Balami JS, Esiri MM, et al. Ischemic stroke in the elderly: an overview of evidence. Nat Rev Neurol 2010; 6: 256–265. [DOI] [PubMed] [Google Scholar]
- 9.Ingall T, Asplund K, Mähönen M, et al. A multinational comparison of subarachnoid hemorrhage epidemiology in the WHO MONICA stroke study. Stroke 2000; 31: 1054–1061. [DOI] [PubMed] [Google Scholar]
- 10.Bruns J, Jr, Hauser WA. The epidemiology of traumatic brain injury: a review. Epilepsia 2003; 44: 2–10. [DOI] [PubMed] [Google Scholar]
- 11.Dijkhuizen RM, Beekwilder JP, van der Worp HB, et al. Correlation between tissue depolarizations and damage in focal ischemic rat brain. Brain Res 1999; 840: 194–205. [DOI] [PubMed] [Google Scholar]
- 12.Nedergaard M. Spreading depression as a contributor to ischemic brain damage. Adv Neurol 1996; 71: 75–84. [PubMed] [Google Scholar]
- 13.Richter F, Lehmenkühler A, Fechner R, et al. Postnatal conditioning for spreading cortical depression in the rat brain. Brain Res Dev Brain Res 1998; 106: 217–221. [DOI] [PubMed] [Google Scholar]
- 14.Maslarova A, Alam M, Reiffurth C, et al. Chronically epileptic human and rat neocortex display a similar resistance against spreading depolarization in vitro. Stroke 2011; 42: 2917–2922. [DOI] [PubMed] [Google Scholar]
- 15.Menyhárt Á, Makra P, Szepes BÉ, et al. High incidence of adverse cerebral blood flow responses to spreading depolarization in the aged ischemic rat brain. Neurobiol Aging 2015; 36: 3269–3277. [DOI] [PubMed] [Google Scholar]
- 16.Clark D, Institoris A, Kozák G, et al. Impact of aging on spreading depolarizations induced by focal brain ischemia in rats. Neurobiol Aging 2014; 35: 2803–2811. [DOI] [PubMed] [Google Scholar]
- 17.Leão AAP. Spreading depression of activity in the cerebral cortex. J Neurophysiol 1944; 7: 359–390. [DOI] [PubMed] [Google Scholar]
- 18.Farkas E, Obrenovitch TP, Institóris Á, et al. Effects of early aging and cerebral hypoperfusion on spreading depression in rats. Neurobiol Aging 2011; 32: 1707–1715. [DOI] [PubMed] [Google Scholar]
- 19.Glaser EM, Van der Loos H. Analysis of thick brain sections by obverse-reverse computer microscopy: application of a new, high clarity Golgi-Nissl stain. J Neurosci Methods 1981; 4: 117–125. [DOI] [PubMed] [Google Scholar]
- 20.von Bornstädt D, Houben T, Seidel JL, et al. Supply-demand mismatch transients in susceptible peri-infarct hot zones explain the origins of spreading injury depolarizations. Neuron 2015; 85: 1117–1131. [DOI] [PMC free article] [PubMed] [Google Scholar]
- 21.Sengupta P. The laboratory rat: relating its age with human’s. Int J Prev Med 2013; 4: 624–630. [PMC free article] [PubMed] [Google Scholar]
- 22.Hoffmann U, Sukhotinsky I, Eikermann-Haerter K, et al. Glucose modulation of spreading depression susceptibility. J Cereb Blood Flow Metab 2013; 33: 191–195. [DOI] [PMC free article] [PubMed] [Google Scholar]
- 23.Tong CK, Chesler M. Modulation of spreading depression by changes in extracellular pH. J Neurophysiol 2000; 84: 2449–2457. [DOI] [PubMed] [Google Scholar]
- 24.Tang CM, Dichter M, Morad M. Modulation of the N-methyl-D-aspartate channel by extracellular H+. Proc Natl Acad Sci USA 1990; 87: 6445–6449. [DOI] [PMC free article] [PubMed] [Google Scholar]
- 25.Shah NH, Aizenman E. Voltage-gated potassium channels at the crossroads of neuronal function, ischemic tolerance, and neurodegeneration. Transl Stroke Res 2014; 5: 38–58. [DOI] [PMC free article] [PubMed] [Google Scholar]
- 26.Harris KM, Jensen FE, Tsao B. Three-dimensional structure of dendritic spines and synapses in rat hippocampus (CA1) at postnatal day 15 and adult ages: implications for the maturation of synaptic physiology and long-term potentiation. J Neurosci 1992; 12: 2685–2705. [DOI] [PMC free article] [PubMed] [Google Scholar]
- 27.Dickstein DL, Weaver CM, Luebke JI, et al. Dendritic spine changes associated with normal aging. Neuroscience 2013; 251: 21–32. [DOI] [PMC free article] [PubMed] [Google Scholar]
- 28.Herreras O, Somjen GG. Propagation of spreading depression among dendrites and somata of the same cell population. Brain Res 1993; 610: 276–282. [DOI] [PubMed] [Google Scholar]
- 29.Risher WC, Ard D, Yuan J, et al. Recurrent spontaneous spreading depolarizations facilitate acute dendritic injury in the ischemic penumbra. J Neurosci 2010; 30: 9859–9868. [DOI] [PMC free article] [PubMed] [Google Scholar]
- 30.Cippola MJ. The cerebral circulation, Morgan & Claypool Life Sciences: San Rafael, CA, 2009. [PubMed] [Google Scholar]
- 31.Lapi D, Colantuoni A. Remodeling of cerebral microcirculation after ischemia-reperfusion. J Vasc Res 2015; 52: 22–31. [DOI] [PubMed] [Google Scholar]
- 32.Faber JE, Zhang H, Lassance-Soares RM, et al. Aging causes collateral rarefaction and increased severity of ischemic injury in multiple tissues. Arterioscler Thromb Vasc Biol 2011; 31: 1748–1756. [DOI] [PMC free article] [PubMed] [Google Scholar]
- 33.Feuerstein D, Takagaki M, Gramer M, et al. Detecting tissue deterioration after brain injury: regional blood flow level versus capacity to raise blood flow. J Cereb Blood Flow Metab 2014; 34: 1117–1127. [DOI] [PMC free article] [PubMed] [Google Scholar]
- 34.Buzsáki G, Anastassiou CA, Koch C. The origin of extracellular fields and currents-EEG, ECoG, LFP and spikes. Nat Rev Neurosci 2012; 13: 407–420. [DOI] [PMC free article] [PubMed] [Google Scholar]
- 35.Sukhotinsky I, Dilekoz E, Moskowitz MA, et al. Hypoxia and hypotension transform the blood flow response to cortical spreading depression from hyperemia into hypoperfusion in the rat. J Cereb Blood Flow Metab 2008; 28: 1369–1376. [DOI] [PubMed] [Google Scholar]
- 36.Dreier JP, Major S, Manning A, et al. Cortical spreading ischaemia is a novel process involved in ischaemic damage in patients with aneurysmal subarachnoid haemorrhage. Brain 2009; 132: 1866–1881. [DOI] [PMC free article] [PubMed] [Google Scholar]
- 37.Hartings JA, Strong AJ, Fabricius M, et al. Spreading depolarizations and late secondary insults after traumatic brain injury. J Neurotrauma 2009; 26: 1857–1866. [DOI] [PMC free article] [PubMed] [Google Scholar]
- 38.Hinzman JM, Andaluz N, Shutter LA, et al. Inverse neurovascular coupling to cortical spreading depolarizations in severe brain trauma. Brain 2014; 137: 2960–2972. [DOI] [PubMed] [Google Scholar]
- 39.Hukkelhoven CW, Steyerberg EW, Rampen AJ, et al. Patient age and outcome following severe traumatic brain injury: an analysis of 5600 patients. J Neurosurg 2003; 99: 666–673. [DOI] [PubMed] [Google Scholar]
- 40.Lanzino G, Kassell NF, Germanson TP, et al. Age and outcome after aneurysmal subarachnoid hemorrhage: why do older patients fare worse? J Neurosurg 1996; 85: 410–418. [DOI] [PubMed] [Google Scholar]