

Abstract
Haemodynamic responses to spreading depolarizations (SDs) have an important role during the development of secondary brain damage. Characterization of the haemodynamic responses in larger brains, however, is difficult due to movement artefacts. Intrinsic optical signal (IOS) imaging, laser speckle flowmetry (LSF) and electrocorticography were performed in different configurations in three groups of in total 18 swine. SDs were elicited by topical application of KCl or occurred spontaneously after middle cerebral artery occlusion. Movement artefacts in IOS were compensated by an elastic registration algorithm during post-processing. Using movement-compensated IOS, we were able to differentiate between four components of optical changes, corresponding closely with haemodynamic variations measured by LSF. Compared with ECoG and LSF, our setup provides higher spatial and temporal resolution, as well as a better signal-to-noise ratio. Using IOS alone, we could identify the different zones of infarction in a large gyrencephalic middle cerebral artery occlusion pig model. We strongly suggest movement-compensated IOS for the investigation of the role of haemodynamic responses to SDs during the development of secondary brain damage and in particular to examine the effect of potential therapeutic interventions in gyrencephalic brains.
Keywords: Brain imaging, intrinsic optical imaging, spreading depression, acute stroke, animal models
Introduction
Spreading depolarization (SD) is a wave of neural and glia electrical depolarization that propagates at a rate of 2–5 mm/min through cerebral gray matter.1 It occurs after brain tissue damage, such as traumatic brain injury,2 malignant hemispheric stroke,3 subarachnoid haemorrhage4 and intracerebral haemorrhage.5 SD plays an important role in the pathophysiology of the aura in migraine patients6–8 and exhibits a close relationship to epilepsy.9,10 SD is coupled to a strong haemodynamic response, which in the injured brain may potentially lead to secondary brain injury because the normal hyperemic response is inverted into the opposite, an ischemic response (spreading ischemia), which can cause widespread necrosis.11–15 These findings turn SD into a potential target for novel therapeutic strategies against secondary brain injury.16,17 However, the caveat is added that SD may also have beneficial effects and its pharmacology is highly complex.18,19
Whereas the mouse brain shows some peculiarities,20 both the electrophysiological and haemodynamic signals of SD are remarkably similar between rat and human brain.21 Thus, SD and its haemodynamic responses are among the very few examples in the field of stroke in which translation from rats to humans was successful.22 This also includes fundamental pharmacological observations such as the sensitivity of SD to N-methyl-D-aspartate receptor antagonists.23,24 Experiments in rats show the advantage over experiments in larger animals that they are easier to perform, the throughput is higher and ethical justification is less difficult. It is nevertheless also interesting to study certain specific questions in larger animals such as swine because structural and functional homologies between pig and human brain are evidently higher. For example, there are important differences in SD propagation and in the compartment sizes between gyrencephalic and lissencephalic brains.25 Whether there are fundamental differences in SD pharmacology between rats and pigs is largely unknown up until now but pharmacokinetics and modes of drug application are certainly better modelled in pigs than rats.
Studying higher evolved species with larger brains is challenging, since the encephalon is prone to strong movements and artefacts produced mainly by respiration, heartbeat and slow brain shift. Therefore, methods are required to characterize haemodynamic changes in large brains with high spatial and temporal resolution and with large cortical field-of-view: first, to understand SDs evolution over long distance propagation over variably perfused tissues in an irregular surface with variable vessel anatomy and irrigation and, second, to examine the effect of potential therapeutic interventions in a more human-like brain.
SD can be measured electrically using electrocorticography (ECoG), which is the gold standard for detection in humans. However, electrical recordings have the disadvantage of not providing information about the haemodynamic changes. Laser speckle flowmetry (LSF) is able to measure regional cerebral blood flow (rCBF) changes, but when used in the movement-prone environment of a large gyrencephalic cortex, LSF exhibits a considerable decrease in signal-to-noise ratio, as well as resolution. Intrinsic optical signal (IOS) imaging enables the visualization of optical changes of cortical tissue, which are well correlated with regional haemoglobin concentration changes corresponding to changes in regional cerebral blood volume (rCBV). A good correlation between ECoG changes and IOS waves to depolarization development has been previously addressed,26 turning IOS into a suitable method for the detection of SDs. It has been used to characterize SDs in chicken retina,27 brain slices28 and in vivo small animal models.29
The purpose of this study is: (a) to develop a method for effective compensation of movement artefacts in IOS images acquired in large craniotomized gyrencephalic swine brains and (b) to demonstrate the validity of this IOS system for the study of the SD haemodynamic changes, compared with the already well-established methods ECoG and LSF, as well as (c) to investigate haemodynamic patterns and spatiotemporal dynamics of SDs in the gyrencephalic swine brain.
Materials and methods
Animal preparation and conditions
We monitored three different groups from a total of 18 swine. The first group consisted of eight swine used for the development and validation of the IOS system. The second group consisted of seven animals with intact brain surface and manual KCl stimulations. The third group of three swine underwent a left middle cerebral artery occlusion (MCAO) stroke.
The protocol for the experiments was approved by the Institutional Animal Care and Use Committee in Karlsruhe, Baden-Württemberg, Germany. Experiments were conducted in the Interfaculty Biomedical Research Facility (IBF 347) in accordance with the University of Heidelberg Animal Ethics Policy. The ARRIVE (Animal Research: Reporting In Vivo Experiments) guidelines were considered for the report of the study.
Male swine (German landrace) weighing 28–32 kg, 3 to 4 months of age, were anesthetized with midazolam (8 mg/kg) and azaperone (60 mg/kg) administered intramuscularly, followed by a 20–30 mg IV application of propofol. Animals were orally intubated and mechanically ventilated (FiO2 = 0.3). Anaesthesia was maintained using isoflurane (0.6–1.0%, all groups) and, additionally, a midazolam perfusor (in the KCl group) for the duration of the experiment. A 2–3 mg bolus of propofol IV was administered for sedation whenever necessary. Deep sedation was maintained throughout the procedure, in order to minimize animal movement, discomfort and pain. A venous line was placed in the right ear vein and capillary SO2 was monitored from the left ear. After surgical exposure of the right femoral artery, a 4-French probe was placed for permanent monitoring of the mean arterial blood pressure (Raumedic AG, Helmbrechts, Germany). A blood-gas analysis was performed every 3–4 h. Heart rate was kept at between 50 and 120 bpm. Mean arterial pressure was maintained at 60–110 mmHg, temperature between 36.5 and 38℃, SO2 > 90%, pCO2 35–45 mmHg, pO2 > 80 mmHg and glucose > 80 mg/dl. All relevant physiological parameters, such as mean arterial pressure, rectal temperature, heart rate and SO2 were continuously monitored. The heads of the animals were firmly held in a custom-made stereotactic frame. At the end of the experiment, euthanasia was performed with an overdose of KCl under anaesthesia.
Depending on the group, different procedures and interventions were undertaken during the experimental phase:
IOS setup development group
An extensive craniotomy and dura mater excision were performed to expose both hemispheres. An ECoG recording strip (Ad-tech, Racine, Wisconsin, USA) was placed on the cortex surface for ECoG monitoring. The strip was fixed to the dura mater to minimize movements. In four animals, brains were preconditioned for 5 min with an elevated K+ concentration (11 mmol/l) in standard ringer lactate solution (37℃). In other two animals, the brains were preconditioned for 20 min and in another two animals preconditioning was performed for 40 min. Preconditioning was performed at the beginning of the experiment, in order to make the brain more susceptible to SDs. The cortex was flushed hourly with a 37℃ physiologic NaCl solution. Every 20 min, SDs were induced chemically using a rounded syringe needle tip (∅ = 0.4 mm) with a small drop of KCl solution (0.05–2 µL, 1 mmol/mL). The monitoring time for this set of experiments was between 8 and 10 h per experiment. Because of variations in conditions due to experimental changes to optimize, e.g. illumination or exposure, no statistical analysis was performed with the data acquired from these animals.
KCl-group
Surgical procedures and measurements were performed as in the IOS development group. However, in this group, brains were preconditioned for 40 min with an elevated K+ concentration (11 mmol/l) in standard Ringer’s lactate solution (37℃) and, after preconditioning, the exposed cortex was protected with a mineral oil pool (Paraffin oil, Keller Chemikalien, Germany) to improve image quality and protect the cortex from drying. Then, SDs were induced by KCl application every 30 min. Animals were monitored for about 12 to 14 h.
MCAO-group
A left side craniotomy was conducted, and the dura mater was removed. The exposed cortex was protected with a liquid mineral oil pool. The stroke was induced by a permanent clipping of a left MCAO transorbitally after eye enucleation under microscopic vision. We additionally measured cortical perfusion by LSF in two animals. No ECoG measurement was undertaken in this group. Monitoring time was between 8 and 10 h.
Instrumentation
IOS imaging
The optical properties of brain tissue often change as a consequence of physiological changes. The rCBV and haemoglobin oxygenation of the cortex are the most prominent factors influencing reflection of light in the visible and near infrared spectrum.
We measured rCBV changes semi-quantitatively with an IOS imaging system, which measured the reflectance of light at the cortex around a wavelength of 564 nm. This is near a wavelength where oxygenated and deoxygenated haemoglobin exhibit the same light absorption (isosbestic point at 569 nm30). Hence, the proportion of diffusely reflected light is approximately inversely proportional to the amount of total haemoglobin concentration in the tissue and independent from oxygenation.
The setup consisted of a camera (Smartec GC1621M, 8 bit gray-scale, 1628 × 1236 pixels, MaxxVision GmbH, Stuttgart, Germany), directed to the exposed cortex at a distance of about 25 cm. A full-spectrum LED light source (1 W) or the surgical lights illuminated the cortex. In front of the lens (Fujinon HR25HA-1B, 2/3″, 25 mm, 1:1.4, MaxxVision GmbH, Stuttgart, Germany), an optical band-pass filter in the green range of the spectrum (564 nm, 14 nm FWHM, Schott, Germany) was mounted. Images were acquired at a rate of one to five images per second with a computer that provided a live view of the exposed cortex and also showed the amplified image intensity differences from a manually chosen reference image. The images within a predefined time-range could continuously be played back and forth to review the intensity changes caused by the SDs. Thus, we were able to directly observe the propagation, and in some cases, the initiation and termination, of SDs during the experiments.
Head movements were reduced by proper fixation of the head of the animals in a stereotactic frame. Remaining artefacts caused by the movement of the brain itself due to, e.g. heartbeats, mechanical ventilations or slow brain shift, were compensated for by an extensive post-processing.
ECoG
Parallel ECoG measurements were performed in all but the MCAO stroke group. Strips of 10 ECoG electrodes (Ad-Tech, Racine, WI, USA) were placed on the cortex. The silicone of the electrode strip was transparent and allowed for measurement of IOS from the tissue directly surrounding the electrodes. ECoG electrodes were connected in a sequential monopolar fashion. Sampling of monitoring was set at 1 kHz, using the amplifier Powerlab 16/SP analogue-to-digital converter. LabChart v.7 software (AD Instruments, New South Wales, Australia) was used for registration and analysis. ECoG was used to verify that the measured IOS intensity changes indeed originated from SDs.
LSF
In two animals of the MCAO-stroke group, we recorded LSF in parallel with IOS. LSF consisted of a laser (laser diode DL7140201S, 785 nm, max. 70 mW, Sanyo; controlled by the laser controller LDC 205 C, Thorlabs, Newton, NF, USA), which illuminated the cortex with coherent light. The light is reflected by the haemoglobin in red blood cells and then projected onto the sensor of a CCD camera (A602f-2, 656 × 491 pixels, 8 bit grayscale, Basler, Ahrensburg, Germany) through a macro lens (MicroNikkor, 55 mm, 1:2.8). A speckle pattern occurs on the sensor, due to interference of the coherent light. In regions of red blood cell movement, the speckles will move and thus movement blur occurs. The amount of blur can be measured by the speckle contrast, which is defined as the ratio of the standard deviation and the mean of the pixel intensity in a 5–7 pixel square window. Here, we assume as a fact that the resulting speckle contrast is inversely correlated with the local blood flow. LSF was used in this study to validate IOS by examining the relationship between the haemoglobin concentration measured by IOS and the red blood cell speed, as measured with LSF.
Data processing
The procedure to compensate for movements, using an elastic registration algorithm, is a result of this study and described further below.
IOS analysis
We analysed SDs in the KCl- and MCAO-groups at distinct points of interest (POIs) on the cortical surface. In the KCl-group, for each SD, POIs of about 5 × 5 pixels (0.03–0.12 mm2) were distributed in a radial direction from the stimulation point. The area directly affected by the KCl-stimulation was excluded from the analysis. For the MCAO-group, POIs of the same size were placed in a radial direction from the ischemic core. The intensity differences caused by changes of rCBV in the cortical tissue at the POIs were analysed to get minima/maxima intensities and durations of the different haemodynamic phases. A self-developed software based on ImageJ was used to view the large amounts of images and to set the POIs at regions without major blood vessels. The extracted time series of IOS intensities at the various POIs were visualized and analysed using the LabChart v.7 software. Where not noted otherwise, amplitudes are stated as the percentage of intensity change in relation to the baseline intensity immediately before the occurrence of an SD.
ECoG analysis
In ECoG, SDs were identified in the KCl-group by the simultaneous occurrence of a SPC and depression of high frequency activity, in addition to the sequential appearance on at least two channels. In this study, ECoG was used for validation of the IOS and not analysed quantitatively. All ECoG files were analysed using LabChart v.7.
Data presentation of IOS and LSF
In the figures, time courses of the acquired IOS intensity and LSF speckle contrast values are presented inversely (denoted as IOSinv and LSFinv), such that larger intensity and speckle contrasts are drawn downwards and lower intensities and speckle contrasts are drawn upwards. This leads to a more intuitive interpretation of the values as correlating CBV and CBF values. For the IOS intensities, however, we want to note, that haemoglobin concentration is indeed the major, but surely not the only influencing factor, so interpretation of IOSinv as a measure of CBV must be handled with care.
Results
Algorithm for movement compensation of IOS images
Movement compensation is performed in four steps, as illustrated in Figure 1:
Figure 1.
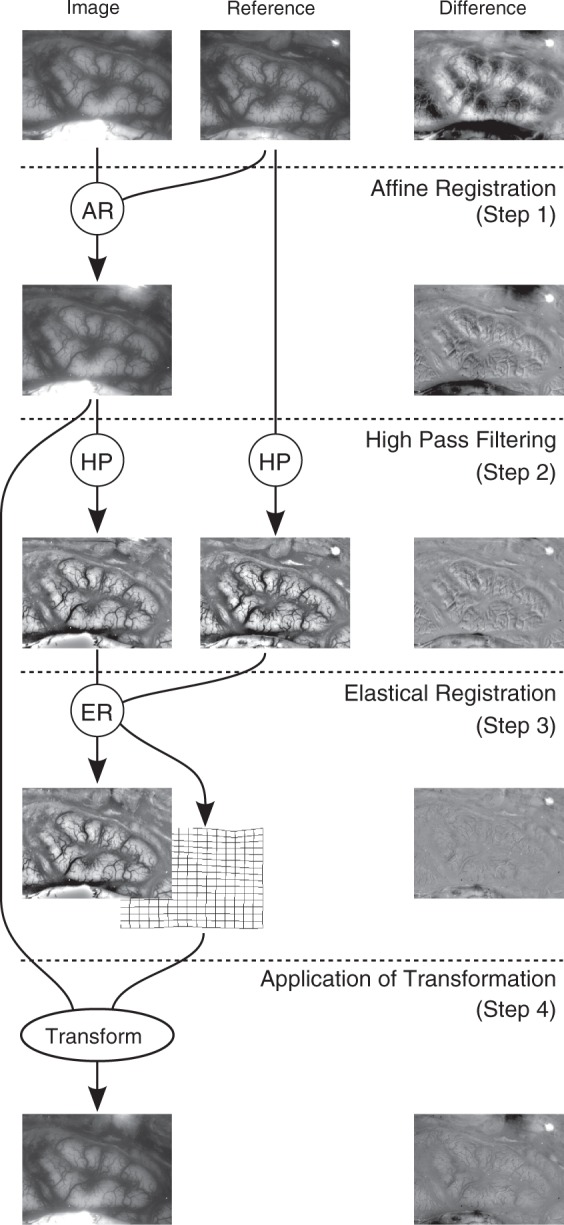
Illustration of the process to warp an image for an optimal fit to the reference image. In the right column, the difference images of the left and middle images are shown. Note, how the difference decreases successively until Step 3. Most of the remaining difference in Step 3 can be explained by changed vessel diameters that are not compensated. In Step 4, the difference increases again due to low frequency portions, which have been eliminated in Step 2 and are reintroduced in this step. The entire process is described in detail in the text. AR: affine registration; HP: high-pass filter; ER: elastic registration.
Step 1
Major shifts and rotations are compensated by applying an affine landmark-based registration to the images. Landmarks are extracted by the ImageJ plug-in SIFT for scale invariant feature extraction, similar to Lowe.31
Step 2
A high-pass filter is applied to the image, which emphasizes blood vessels and decreases illumination differences. The filter is implemented as the difference of the original image and a Gaussian smoothed version of the image. The width σ = 20 for the Gaussian kernel worked well for images of between 500,000 and 2 million pixels in size.
Step 3
An elastic registration algorithm determines a transformation that makes the vessels of both high-pass filtered images fit best by minimization of the sum of squared differences. Elastic registration is performed by the bUnwarpJ algorithm with B-spline regularization, as described by Arganda-Carreras et al.32 We used unidirectional registration and settings that optimize registration quality rather than processing time.
Step 4
The resulting transformation of this optimal fit from Step 3 is applied to the not high-pass filtered image that resulted from Step 1. Because of the massive amount of data in combination with the computationally expensive registration algorithm, we parallelized the registration on a cluster of up to 60 personal computers. The entire registration process is implemented in Java, using the image processing framework Fiji with ImageJ at its core.33
To view the effect of the movement compensation of randomly chosen IOS images, please refer to the Supplementary Video 1. For inspection, intensity changes were visually amplified by subtraction of a manually selected reference image and contrast intensification. Additionally, time courses of the intensity of manually selected POIs were extracted. Where not noted otherwise, the profiles shown in the figures are normalized by their first value, which is approximately the baseline intensity.
Evaluation of the robustness and quality of the movement compensation
Our experiments, containing several hundreds of thousands of images, rarely show misaligned images. Major obstacles for good registration were reflections, which were nearly eliminated in the later experiments by the mineral oil pool. Bleedings originating from the craniotomy or dura mater were not problematic in most cases. This robustness is provided by the separation of the registration algorithm into two steps: first, compensating for larger movements with the landmark-based affine registration and, only then, fine-tuning the transformation with the elastic registration of the high-pass filtered images. Figure 2(a) shows a cross-section of a registered and an unregistered data set to illustrate the matching accuracy.
Figure 2.

Illustration of movement-compensation quality. (a) (I): Part of one hemisphere after MCAO. The white line shows the line of interest for (II) and (III). The arrow points to the point of interest shown in (IV). (II, III): Intensity along the line of interest (along the horizontal axis) over a timespan of 1 h (vertical axis). The image in (II) is taken from the unprocessed data and exhibits strong movement artefacts. The image in (III) is extracted from the movement-compensated images series and shows the successful compensation of the movement artefacts. Three SDs are visible as nearly vertical stripes of first brighter and later slightly darker intensity. Horizontal dark stripes are caused by blood vessels. The arrows on the left point to the line for which the time course of inverted intensities is shown in (IV). (IV) Time courses of IOSinv at a selected POI in unprocessed (upper trace) and registered data (lower trace). The vertical and horizontal scales are the same in both traces. (b) Exemplary IOSinv profiles of relative intensity changes of paper (POIs 1 and 2) and normal perfused tissue (POIs 3 to 6). Changes of intensity in POIs 3 to 6 are mainly caused by low frequency vascular fluctuations and a propagating SD, which was elicited by KCl-application at the location marked with the cross. Vertical scaling is the same for all POIs.
Only movement itself is compensated by the registration process, but other artefact sources, like changed illumination conditions, remain. To measure these remaining artefacts, we placed pieces of paper (∼3 × 4 mm2) on the cortex. Given that the optical properties of the paper can be assumed to remain constant, we can attribute intensity changes in POIs on the paper directly to movement related effects. Figure 2(b) shows exemplary profiles for POIs covering pieces of paper and for POIs on the cortex. The considerably larger variations in the POIs on the cortical tissue can be linked to physiological or pathological changes in the underlying tissue.
Validation of post-processed IOS by parallel ECoG measurements in the KCl model
All SDs evidenced at an ECoG electrode within the visual field of the IOS could also be detected in IOS, showing characteristically propagating intensity changes. However, the inverse was not true in all cases: About 20% of the SDs occurring during cyclic excitation in the KCl model identified in IOS would not have been doubtlessly identified with the ECoG data alone (45 vs. 35 SDs, respectively). This was mainly observed when SDs developed sequentially within a short time interval, leading only to subtle ECoG changes but characteristically propagating IOS changes with decreased but clearly observable amplitudes.
Validation of post-processed IOS by parallel LSF measurements in the MCAO model
In the swine with MCAO, we measured IOS and LSF in parallel. This enabled us to perform a comparison between the two methods. We found a significantly better signal-to-noise ratio for IOS, as shown in Figure 3(a). This may explain the finding of stepwise and SD-like propagating intensity increase in the developing ischemic core could only be observed by IOS, as previously described by our group.34 Figure 3 shows that IOS and LSF, at least in our model, exhibit a close relationship for their intensity changes during SDs, not only qualitatively, but also quantitatively, although the methods measure different parameters. In the MCAO model, both signals decorrelated directly after MCAO for the area affected by the occlusion, indicating higher rCBV and lower rCBF. When, after some minutes, an ischemic core develops, rCBV decreases considerably in this area.
Figure 3.
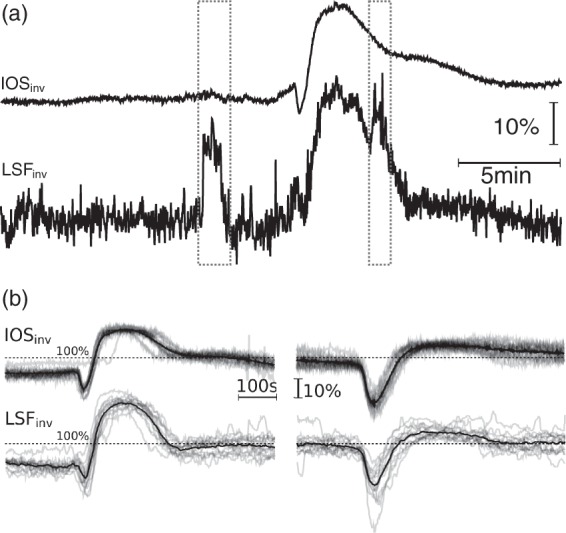
Comparison of IOS and LSF in an MCAO model. (a) Movement-related artefacts in IOSinv (top) and LSFinv (bottom). Dashed boxes mark the occurrence of (unusually) strong general movements, which cause considerable artefacts in LSF, whereas the artefact is hardly visible in movement-compensated IOS. However, even outside of episodes of general movement, mechanical ventilation and heart beat lead to more noise in LSF than in IOS. (b) IOSinv and LSFinv of 14 consecutive SDs at two different POIs. Upper traces are IOSinv and lower traces are LSFinv. Horizontal and vertical scalings are the same for all charts. The signals were divided by the mean intensity of the shown period to normalize both modalities and diminish illumination differences. The black, thicker line represents the mean of all 14 SDs of the corresponding POI. To improve signal-to-noise ratio, only the LSF signal was smoothed by a median filter (with a width of 10 samples at a sampling rate of one image per second). Left side: Mainly normoxic response from tissue outside of the affected area. Right side: Mainly inverse responses from tissue of a hypoperfused area.
Spatiotemporal initiation and propagation patterns observed in IOS
In both models, KCl and MCAO, in vivo SDs were successfully obtained. The spatiotemporal dynamics were classified as previously described by our group.25 In the KCl-group, SDs initiated as either concentric-radial (50%) or irregular-broken-radial (50%) waves that propagated in several semi-planar (100%) fronts, following the gyri. Mostly single SDs developing from the KCl stimulation point were observed; however, reverberating waves due to a continuous cycling were also observed, resulting in SD clusters.
In the MCAO-group, the clipping caused considerable changes in the rCBV, which could be observed in the IOS and LSF images (Figure 4(b)), although not the whole surface affected by the clipping was within the visible cranial window. Ninety seconds after the MCAO the first SD could be observed propagating from the margin of the exposed cortex within the future penumbra into the visual field (supplementary Video 2). Subsequent SDs continued to appear spontaneously, mainly from one side of the expected lesions (supplementary Video 3). SDs initiated mainly as irregular-broken-radial waves with semi-planar fronts, with propagation following the gyri structure. Deterioration of the hypoperfused cortex could be observed as a gradual strong decrease in rCBV after the development of several SDs (supplementary Video 4). In the area most affected by the clipping only one propagating step-wise intensity increase could be observed (4 min after the clipping), after which the IOS intensity slowly and steadily increased, suggesting the development of an ischemic core.
Figure 4.

Spatial distribution of various haemodynamic parameters from a single exemplary SD, which propagated over the whole visible part of the cortex about 1 h after MCAO. (a) Reference image with the ROIs shown in (c). The dotted region is the most hypoperfused visible area, presumably the core at the moment of the SD. (b) Effect of the clipping as maximum IOSinv decrease during the first seconds after clipping (upper image) and the subsequent IOSinv increase at 60 s after clipping, caused by lateral perfusion (lower image). (c) Parameters and IOS from the POIs shown in A with increasing distance from the supposed core. The first column denotes the POI number, the middle two columns quantify the effect of the clipping and subsequent lateral perfusion. The last column states the LSFinv baseline reduction just before the SD as compared with just before clipping. Example: In POI 3, the clipping lead to a 9% IOSinv decrease with a subsequent increase to a level of 18% above baseline. The LSFinv just before the shown SD was 47% lower than just before the clipping. We can observe an inverse response in both modalities. (d–f) Amplitudes (IOS and LSF) and durations (only IOS) of initial hypoperfusion, hyperemia and oligemia, respectively. Duration of oligemia could not be determined, because of subsequent SDs.
Characterization and comparison of IOS intensity change patterns during SDs
SDs were visible in the IOS images as a change in the parenchymal reflectance that propagated over the cerebral cortex. We were able to identify the four different haemodynamic components described by Ayata and Lauritzen35 and a heterogeneity of haemodynamic patterns: first, an initial hypoperfusion, followed by a rebound hyperemia and post-SD oligemia. The subtler late hyperemia could also be observed in several animals. The amplitude, or even presence, of the various components could differ greatly, from pure hypoperfusion or pure hyperemia up to four phasic combinations of all components. We also frequently observed a short hyperemia phase occurring immediately before the hypoperfusion phase, which may actually be the beginning of the hyperemia, which is subsequently superposed by the hypoperfusion phase. Refer to Figure 1 of the supplemental material for example patterns observed in an gyrencephalic MCAO-model.
The parallel LSF data of two of the MCAO swine confirmed that the IOS changes indeed correlated with perfusion changes. In the MCAO model, the individual amplitudes of the various haemodynamic components varied considerably, depending on the location of the measurement (Figure 4): The penumbra exhibits large hypoperfusion amplitudes with reduced but longer lasting hyperemic amplitudes. Further away from the clipping, hypoperfusions are small or not present at all, but strong hyperemia can be measured. Large oligemic components could sometimes be observed in irregular intervals and on varying gyri (Figure 4(f)). The shapes of the different components, as measured by IOS and LSF, correlated closely (Figure 3(b)).
The most commonly detected haemodynamic patterns in IOS were the biphasic and triphasic rCBV changes (Figure 5). Considering the total of both patterns, the biphasic pattern with an hypoperfusion front followed by hyperemia was registered in 33% of the placed POIs in the KCl-group and 51% POIs in the MCAO-group. The biphasic pattern with a hyperemic front followed by oligemia was seen in 45% in the KCl-group and in 31% in the MCAO-group and, finally, the triphasic pattern with mixed responses was observed in 22% of POIs the KCl-group and 18% of the MCAO-group. A more detailed analysis of these patterns in both models, indicating differences in amplitude and duration, is shown in Table 1.
Figure 5.

Patterns of IOSinv time courses. (a) Exemplary profiles of IOSinv of the most frequently observed patterns. From left to right: Hypoperfusion with following hyperemia; hypoperfusion with following hyperemia and oligemia; hyperemia with following oligemia. Below: Bar graph of the fraction of POIs with these three patterns for KCl (upper bar) and MCAO (lower bar). Of importance in the MCAO model is the larger proportion of the first two patterns, which include a considerable initial hypoperfusion, resulting from the region affected by the clipping. (b, c) Two clusters of SDs with different blood flow responses and subsequently following prolonged oligemia after termination of the cluster.
Table 1.
Amplitudes of IOS intensity changes as relative values in relation to the baseline intensity immediately before the SD, for biphasic and triphasic patterns (Figure 5) and their durations.
| Morphology | Model | # POIs | Amplitude of intensity change (% ± STD) |
Duration of intensity change (min ± STD) |
||||
|---|---|---|---|---|---|---|---|---|
| Initial hypoperfusion | Hyperemia | Oligemia | Initial hypoperfusion | Hyperemia | Oligemia | |||
| Hypoperfusion – hyperemia | KCl | 54 | 14.1 ± 11.7 | 4.8 ± 4.0 | – | 1.5 ± 0.4 | 2.3 ± 1.2 | – |
| MCAO | 73 | 19.2 ± 8.1 | 13.4 ± 2.9 | – | 1.4 ± 0.3 | 5.2 ± 0.9 | – | |
| Hyperemia – oligemia | KCl | 72 | – | 11.3 ± 7.8 | 10.0 ± 7.3 | – | 2.9 ± 1.1 | 5.9 ± 4.7 |
| MCAO | 45 | – | 18.2 ± 3.9 | 4.1 ± 3.5 | – | 4.2 ± 0.6 | 8.0 ± 3.0 | |
| Triphasic | KCl | 36 | 12.4 ± 11.1 | 11.3 ± 10.2 | 12.1 ± 11.2 | 1.6 ± 1.0 | 2.8 ± 2.0 | 4.4 ± 2.4 |
| MCAO | 25 | 4.1 ± 2.3 | 19.9 ± 2.6 | 7.8 ± 5.1 | 1.2 ± 0.4 | 3.4 ± 0.7 | 5.4 ± 1.5 | |
Amplitudes may not be comparable between different models, however (see Discussion).
In the KCl-group, outside of the region directly affected by the stimulation, no apparent dependency of haemodynamic parameters on the distance of the KCl-stimulus could be observed. Larger regions of increased amplitude of the initial hypoperfusion developed in most animals. In clusters of SDs consisting of several repetitive mono- or biphasic intensity changes (duration 4.3 ± 1.8 min), we found the occurrence of prolonged oligemia after the last SD of the cluster (duration 25.9 ± 11.2 min; Figure 5(b) and (c)).
Discussion
Our results show that the large field-of-view movement-compensated IOS in a large gyrencephalic brain provides data that would otherwise either not be accessible, or would only be accessible with a worse signal-to-noise ratio. Parallel measurements of IOS with ECoG and LSF verified that IOS not only identifies SDs with a very high specificity but can also characterize the various components of the haemodynamic response in a large brain and the spatial distribution of SDs with a high spatiotemporal resolution. This enables broad application of IOS to study SDs in various contexts, where brain movement could limit the analysis, including neurosurgical operations. In the experimental setting, the improved imaging quality for a better translatable model may contribute to lower the number of animals necessary for significant results.
Surgical preparation
Like most other imaging methods for SDs, our setup requires a craniotomy to obtain visual access to the cortical surface. Excision of the dura mater exposes the cortex to air and temperature gradients. A mineral oil pool was introduced to compensate at least partly for these influences. The higher incidence of SDs per stimulation in animals without mineral oil pool in comparison with animals with a mineral oil pool25 is a hint that the factors introduced by the craniotomy are facilitating SD development. However, since hemicraniotomy is also one of the standard treatments after malignant infarction, the findings could be used to understand the pathophysiology of stroke during these situations. Nevertheless, low intracranial pressure and brain exposition during the long experimental duration produce a change in the physiologic conditions that may alter the wave patterns and characteristics.36
Validity of our IOS setup for measurement of haemodynamic changes
The close correlation of LSF and IOS during haemodynamic changes caused by SDs are a strong hint that the major influencing factor for IOS is related to the tissue haemoglobin concentration. The connection can be explained by the close relationship between rCBV (mainly measured by IOS) and rCBF (measured by LSF) described by the mean transit time37 (MTT): MTT = rCBV/rCBF. Thus, for most cases, changes in rCBV correlate with changes in the rCBF, if the MTT remains constant. The variations of the MTT during an SD, however, require further research.
The single case of strong deviations between LSF and IOS supports the hypothesis of IOS measuring mainly the rCBV: Both signals decorrelated temporarily after MCAO, indicating lower rCBF and higher rCBV for areas affected by the occlusion and thus a higher MTT. This might be the penumbra, where rCBF is decreased, but rCBV is increased, due to widening of vessels.
There is a study which questions the validity of IOS to even detect the propagation of SDs: Using a combination of LDF and IOS in 20 patients with malignant stroke during a craniotomy,14 SDs could be detected in 7 out of the 20 patients. However, not all SDs detected by LDF were detectable by IOS. Reasons might be a worse signal–noise ratio than in our setup, maybe caused by the used wavelength of 785 nm, which in contrast to 564 nm as used in our setup is less sensitive to haemoglobin concentration.
The origin of the IOS itself – although closely correlated with the rCBV – is a matter of dispute. Many different factors, such as cell swelling or several metabolic processes, have an influence on the IOS, but the most dominant component within the context of the haemodynamic response to SDs is mainly seen in rCBV38,39 or even rCBF.40 The very heterogeneous results in this area of research may originate from the different wavelengths used in the setups of the individual groups. A very differentiated examination of Yin et al.41 using nine simultaneously measured wavelengths suggests that the use of one single wavelength does not allow for quantitative measurements. Furthermore, Mané and Müller42 report IOS reflectance increases in brain tissue slices during hypoxia induced SDs without any blood flow. Considerable reflectance increases (over 20% under conditions like e.g. hypertonicity or Ca2+-withdrawal) were attributed to “a metabolic component and to reflect changes in cellular organelles, especially increases in the size of mitochondria, as well as dendritic changes.”42 Although such conditions are not present in our models, blood flow independent changes are without a doubt contained in our IOS signal and may e.g. explain the frequently more prominent IOS amplitude during the initial hypoperfusion phase as compared with the LSF signal. As electrophysiological and ionic changes of SD clearly start earlier than the changes in CBF,43 we would also expect IOS changes before blood flow changes. Nevertheless, the strong correlation between LSF and IOS in our data suggests that for the MCAO model, IOS provides valid data regarding the major components and their durations. For some other models or under different conditions, however, IOS is likely not suitable to allow valid assumptions about duration or character of haemodynamic changes during SD.
Using IOS to identify the various infarction zones
In the MCAO model, we were able to show the impact of the clipping on the development and propagation of SDs. The area affected by the clipping as well as an approximate impact could be observed in IOS and LSF. The amplitudes of the haemodynamic components during SD, as measured congruently in LSF and IOS, varied depending on the perfusion changes caused by the MCAO: We observed large hyperemic amplitudes in the regions of the cortex not directly affected. In the areas directly affected by the clipping, we observed large hypoperfusion amplitudes with accompanying hyperemias of smaller amplitudes but longer duration. In the parts of the area most affected by the clipping, only IOS was able to record a single propagating event 4 min after clipping, but neither LSF nor IOS could record any SDs thereafter, while slowly increasing IOS intensity/lower rCBV values were recorded. These different characteristics likely correspond to the different penumbra zones and core of the infarction, as previously described by Strong et al.,44 and may in future studies be used for the identification of different zones by their haemodynamic response.
Haemodynamics of SD registered in IOS
The movement-compensated IOS enabled tracking of the initiation, propagation and continuation during the dispersion of SDs over the cortex, with a high spatiotemporal resolution in two different gyrencephalic models: a KCl- and a MCAO stroke model. In both models, we successfully obtained in vivo SDs and identified differences between responses in IOS. The observed perfusion changes during the SD covered the continuum of the haemodynamic responses from the normal to the inverse response as previously described by other groups.21,45,46 The interpretation of the often prominent initial hypoperfusion phase both in the KCl group (with KCl preconditioning) and the MCAO group (without preconditioning) is open. In rats, initial hypoperfusions under physiologic conditions are nearly absent, but appear under increased potassium concentrations47 or under NO synthesis inhibition.48 Further studies are needed to clarify if the initial hypoperfusions observed in pigs are part of the physiological haemodynamic response or already a sign of a disturbed metabolic equilibrium.
Previous experimental studies have analysed the haemodynamic changes with SDs in the lissencephalic mouse and rat brain and in the gyrencephalic cat brain, after various stroke models using Laser Doppler and/or LSF.44,49,50 There is also the already discussed evidence in the human cortex of a spatiotemporal propagation and haemodynamic response of SDs using LSF and IOS after malignant hemispheric stroke.45 They all show variations in the haemodynamic responses, which seem to be species-dependent and influenced by various factors, such as K+ or glutamate diffusion, nitric oxide availability, tissue perfusion pressure, haemodynamic reserved, neurovascular unit functionality and temporal proximity.44,49,50 The current findings in a large gyrencephalic brain corroborate the previous observations of the regional morphological heterogeneity of haemodynamic responses to depolarizations after stroke.
A variation rarely observed was the presence of a prolonged oligemic phase in the last SD of a cluster, which was preceded by biphasic changes within a close temporal proximity to each other. In our set of experiments, it was not possible to show cycling around the ischemic core in the hypoperfused area as reported by others,49,51 because only a part of the presumed core was in the visible field. Anatomical structures such as sulci, gyri and large pial vessels contributed to direction modification and represented barriers for depolarization expansion, adding more complexity to the propagation patterns.
It is likely that the type of the haemodynamic response has an impact on cerebral tissue outcome.51 Identification of adverse haemodynamic patterns and their mechanism by IOS measurements may lead to finding more specific and more effective therapeutic targets. It may be that the SDs that should be blocked are those with specific oligemic patterns. The results acquired in large gyrencephalic models may serve to translate gyrencephalic brain experimental data more effectively to the clinical setting in the future.
Limitations and possible future enhancements
It is well known that the signal obtained using IOS is concordant with the electrical measurement and in this study we also observed that all SDs measured through ECoG could also be observed in IOS. Other researchers report the close connection of the optical and electrical signals.26,52 Unfortunately, we did not record ECoG in the MCAO model and so cannot provide the electrophysiological criterion for spreading ischemia in the penumbra, which is the local prolongation of the negative DC shift.47 Nevertheless, initial hypoperfusions with longer duration in the penumbra are a strong indicator for spreading ischemia, because the durations of initial hypoperfusion and the negative DC shift are usually well correlated in animals and humans.10,13,53
Although already usable in the experimental setting, the algorithm in its current implementation is quite slow, providing only about one 0.5 megapixel image per second on a current quad core processor (Intel Core i7-2600, 3.4 GHz). Optimization and parallelization of major parts on modern GPUs could provide a performance allowing for real-time application.
As demonstrated, movement-related artefacts are nearly absent in the post-processed signal. However, the presence of above mentioned other factors than haemoglobin concentration in the IOS signal is a major drawback of our current setup. To overcome this limitation, one could measure multiple wavelengths simultaneously,39,41 which would not only allow for a determination of haemoglobin concentration but would also provide data of other metabolic changes. Another improvement would be the parallel measurement of LSF through the same lens. This would enable a movement-compensation of LSF, resulting in a higher spatial resolution of the acquired LSF images. However, the movement artefacts introduced into LSF speckle contrast by its inherent measurement principle would remain, leaving still a lower signal–noise ratio.
In general, every other optical imaging method could be movement-compensated in this way, allowing for e.g. high resolution and large field of view voltage sensitive dye imaging together with IOS. By proofing the effectiveness and making the algorithm publicly available, we hope that other groups may replicate and refine this method of measurement improvement.
Conclusions
Our results show that IOS measurements in a large gyrencephalic brain provide meaningful data, which is partly not accessible by LSF or ECoG, or only with a worse signal-to-noise ratio. Parallel measurements of IOS with ECoG and LSF verified that IOS allows SDs to be identified with a high sensitivity and also enables the characterization of the various components of the haemodynamic response and the spatial distribution of its parameters. This enables broad application fields for IOS to study SDs in various contexts, such as for the examination of novel therapeutic strategies in more translational models or even directly in humans.
Funding
The author(s) disclosed receipt of the following financial support for the research, authorship, and/or publication of this article: This research was supported by the German State Baden-Württemberg within the program Innovative Projekte/Kooperationsprojekte. Edgar Santos was supported by the Postdoc Fellowship Program of the Faculty of Medicine Heidelberg. Renan Sanchez-Porras was supported by the National Council of Science and Technology (CONACyT), Mexico. Humberto Silos was supported by the National Council of Science and Technology (CONACyT) and by the Council of Science and Technology of San Luis Potosi (COPOCyT), Mexico.
Supplementary Material
Declaration of conflicting interests
The author(s) declared no potential conflicts of interest with respect to the research, authorship, and/or publication of this article.
Authors’ contributions
MJS: Developed the IOS setup, the movement compensation and the analysis software, performed experiments and wrote the manuscript. ES and RSP: Designed the project, performed experiments, analysed data, performed statistical analysis and wrote the manuscript. MK, MG, ZZ, YG, HS, AJS, RG, OWS and HD: Took part in the experiments and/or analysis, and critically reviewed the manuscript. AU: Critically reviewed the manuscript. HD: Consulted the development of the IOS setup and the post processing.
Supplementary material
Supplementary material for this paper can be found at http://jcbfm.sagepub.com/content/by/supplemental-data
References
- 1.Strong AJ, Fabricius M, Boutelle MG, et al. Spreading and synchronous depressions of cortical activity in acutely injured human brain. Stroke J Cereb Circ 2002; 33: 2738–2743. [DOI] [PubMed] [Google Scholar]
- 2.Hartings JA, Bullock MR, Okonkwo DO, et al. Spreading depolarisations and outcome after traumatic brain injury: a prospective observational study. Lancet Neurol 2011; 10: 1058–1064. [DOI] [PubMed] [Google Scholar]
- 3.Dohmen C, Sakowitz OW, Fabricius M, et al. Spreading depolarizations occur in human ischemic stroke with high incidence. Ann Neurol 2008; 63: 720–728. [DOI] [PubMed] [Google Scholar]
- 4.Dreier JP, Woitzik J, Fabricius M, et al. Delayed ischaemic neurological deficits after subarachnoid haemorrhage are associated with clusters of spreading depolarizations. Brain J Neurol 2006; 129: 3224–3237. [DOI] [PubMed] [Google Scholar]
- 5.Fabricius M, Fuhr S, Bhatia R, et al. Cortical spreading depression and peri-infarct depolarization in acutely injured human cerebral cortex. Brain J Neurol 2006; 129: 778–790. [DOI] [PubMed] [Google Scholar]
- 6.Santos E, Sánchez-Porras R, Dohmen C, et al. Spreading depolarizations in a case of migraine-related stroke. Cephalalgia Int J Headache. 2012; 32: 433–436. [DOI] [PubMed] [Google Scholar]
- 7.Hadjikhani N, Sanchez Del Rio M, Wu O, et al. Mechanisms of migraine aura revealed by functional MRI in human visual cortex. Proc Natl Acad Sci USA. 2001; 98: 4687–4692. [DOI] [PMC free article] [PubMed] [Google Scholar]
- 8.Olesen J, Larsen B, Lauritzen M. Focal hyperemia followed by spreading oligemia and impaired activation of rCBF in classic migraine. Ann Neurol. 9: 344–352. [DOI] [PubMed] [Google Scholar]
- 9.Fabricius M, Fuhr S, Willumsen L, et al. Association of seizures with cortical spreading depression and peri-infarct depolarisations in the acutely injured human brain. Clin Neurophysiol Off J Int Fed Clin Neurophysiol. 1981; 119: 1973–1984. [DOI] [PMC free article] [PubMed] [Google Scholar]
- 10.Dreier JP, Major S, Pannek H-W, et al. Spreading convulsions, spreading depolarization and epileptogenesis in human cerebral cortex. Brain J Neurol. 2012; 135: 259–275. [DOI] [PMC free article] [PubMed] [Google Scholar]
- 11.Dreier JP, Körner K, Ebert N, et al. Nitric oxide scavenging by hemoglobin or nitric oxide synthase inhibition by N-nitro-L-arginine induces cortical spreading ischemia when K+ is increased in the subarachnoid space. J Cereb Blood Flow Metab. 1998; 18: 978–990. [DOI] [PubMed] [Google Scholar]
- 12.Dreier JP, Ebert N, Priller J, et al. Products of hemolysis in the subarachnoid space inducing spreading ischemia in the cortex and focal necrosis in rats: a model for delayed ischemic neurological deficits after subarachnoid hemorrhage? J Neurosurg. 2000; 93: 658–666. [DOI] [PubMed] [Google Scholar]
- 13.Dreier JP, Major S, Manning A, et al. Cortical spreading ischaemia is a novel process involved in ischaemic damage in patients with aneurysmal subarachnoid haemorrhage. Brain J Neurol. 2009; 132: 1866–1881. [DOI] [PMC free article] [PubMed] [Google Scholar]
- 14.Woitzik J, Hecht N, Pinczolits A, et al. Propagation of cortical spreading depolarization in the human cortex after malignant stroke. Neurology. 2013; 80: 1095–1102. [DOI] [PubMed] [Google Scholar]
- 15.Hinzman JM, Andaluz N, Shutter LA, et al. Inverse neurovascular coupling to cortical spreading depolarizations in severe brain trauma. Brain J Neurol. 2014; 137: 2960–2972. [DOI] [PubMed] [Google Scholar]
- 16.Sánchez-Porras R, Zheng Z, Sakowitz OW. Pharmacological modulation of spreading depolarizations. Acta Neurochir Suppl. 2015; 120: 153–157. [DOI] [PubMed] [Google Scholar]
- 17.Zheng Z, Sanchez-Porras R, Santos E, et al. Delayed cerebral ischemia after subarachnoid hemorrhage: from vascular spasm to cortical spreading depolarizations. Curr Neurovasc Res. 2012; 9: 310–319. [DOI] [PubMed] [Google Scholar]
- 18.Dreier JP, Reiffurth C. The stroke-migraine depolarization continuum. Neuron. 2015; 86: 902–922. [DOI] [PubMed] [Google Scholar]
- 19.Pietrobon D, Moskowitz MA. Chaos and commotion in the wake of cortical spreading depression and spreading depolarizations. Nat Rev Neurosci. 2014; 15: 379–393. [DOI] [PubMed] [Google Scholar]
- 20.Ayata C, Shin HK, Salomone S, et al. Pronounced hypoperfusion during spreading depression in mouse cortex. J Cereb Blood Flow Metab. 2004; 24: 1172–1182. [DOI] [PubMed] [Google Scholar]
- 21.Offenhauser N, Windmüller O, Strong AJ, et al. The gamut of blood flow responses coupled to spreading depolarization in rat and human brain: from hyperemia to prolonged ischemia. Acta Neurochir Suppl. 2001; 110: 119–124. [DOI] [PubMed] [Google Scholar]
- 22.Dirnagl U, Hakim A, Macleod M, et al. A concerted appeal for international cooperation in preclinical stroke research. Stroke J Cereb Circ. 44: 1754–1760. [DOI] [PMC free article] [PubMed] [Google Scholar]
- 23.Sakowitz OW, Kiening KL, Krajewski KL, et al. Preliminary evidence that ketamine inhibits spreading depolarizations in acute human brain injury. Stroke J Cereb Circ. 2009; 40: e519–522. [DOI] [PubMed] [Google Scholar]
- 24.Hertle DN, Dreier JP, Woitzik J, et al. Effect of analgesics and sedatives on the occurrence of spreading depolarizations accompanying acute brain injury. Brain J Neurol. 2012; 135: 2390–2398. [DOI] [PubMed] [Google Scholar]
- 25.Santos E, Schöll M, Sánchez-Porras R, et al. Radial, spiral and reverberating waves of spreading depolarization occur in the gyrencephalic brain. NeuroImage. 2014; 99: 244–255. [DOI] [PubMed] [Google Scholar]
- 26.Peixoto NL, Fernandes de Lima VM, Hanke W. Correlation of the electrical and intrinsic optical signals in the chicken spreading depression phenomenon. Neurosci Lett. 2001; 299: 89–92. [DOI] [PubMed] [Google Scholar]
- 27.Dahlem MA, Müller SC. Self-induced splitting of spiral-shaped spreading depression waves in chicken retina. Exp Brain Res. 1997; 115: 319–324. [DOI] [PubMed] [Google Scholar]
- 28.Müller M, Somjen GG. Intrinsic optical signals in rat hippocampal slices during hypoxia-induced spreading depression-like depolarization. J Neurophysiol. 1999; 82: 1818–1831. [DOI] [PubMed] [Google Scholar]
- 29.Obrenovitch TP, Chen S, Farkas E. Simultaneous, live imaging of cortical spreading depression and associated cerebral blood flow changes, by combining voltage-sensitive dye and laser speckle contrast methods. NeuroImage. 2009; 45: 68–74. [DOI] [PubMed] [Google Scholar]
- 30.Takatani S, Graham MD. Theoretical analysis of diffuse reflectance from a two-layer tissue model. IEEE Trans Biomed Eng. 1979; 26: 656–664. [DOI] [PubMed] [Google Scholar]
- 31.Lowe DG. Distinctive image features from scale-invariant keypoints. Int J Comput Vis. 2004; 60: 91–110. [Google Scholar]
- 32.Arganda-Carreras I, Sorzano COS, Marabini R, et al. Consistent and elastic registration of histological sections using vector-spline regularization. In: Beichel RR, Sonka M. (eds). Computer vision approaches to medical image analysis, Berlin, Heidelberg: Springer Berlin Heidelberg, 2006, pp. 85–95. [Google Scholar]
- 33.Schindelin J, Arganda-Carreras I, Frise E, et al. Fiji: an open-source platform for biological-image analysis. Nat Methods. 2012; 9: 676–682. [DOI] [PMC free article] [PubMed] [Google Scholar]
- 34.Schöll M, Gramer M, Santos E, et al. Comparison of laser speckle flowmetry and intrinsic optical signal imaging in gyrencephalic swine brain during cortical spreading depolarisations. Biomed Eng Biomed Tech. 2012; 57: 323–326. [Google Scholar]
- 35.Ayata C, Lauritzen M. Spreading depression, spreading depolarizations, and the cerebral vasculature. Physiol Rev. 2015; 95: 953–993. [DOI] [PMC free article] [PubMed] [Google Scholar]
- 36.Chang JC, Shook LL, Biag J, et al. Biphasic direct current shift, haemoglobin desaturation and neurovascular uncoupling in cortical spreading depression. Brain J Neurol. 2010; 133: 996–1012. [DOI] [PMC free article] [PubMed] [Google Scholar]
- 37.Meier P, Zierler KL. On the theory of the indicator-dilution method for measurement of blood flow and volume. J Appl Physiol. 1954; 6: 731–744. [DOI] [PubMed] [Google Scholar]
- 38.Brennan KC, Beltrán-Parrazal L, López-Valdés HE, et al. Distinct vascular conduction with cortical spreading depression. J Neurophysiol. 2007; 97: 4143–4151. [DOI] [PubMed] [Google Scholar]
- 39.Ba AM, Guiou M, Pouratian N, et al. Multiwavelength optical intrinsic signal imaging of cortical spreading depression. J Neurophysiol. 2002; 88: 2726–2735. [DOI] [PubMed] [Google Scholar]
- 40.Wang Z, Li P, Luo W, et al. Peri-infarct temporal changes in intrinsic optical signal during spreading depression in focal ischemic rat cortex. Neurosci Lett. 2007; 424: 133–138. [DOI] [PubMed] [Google Scholar]
- 41.Yin C, Zhou F, Wang Y, et al. Simultaneous detection of hemodynamics, mitochondrial metabolism and light scattering changes during cortical spreading depression in rats based on multi-spectral optical imaging. NeuroImage. 2013; 76: 70–80. [DOI] [PubMed] [Google Scholar]
- 42.Mané M, Müller M. Temporo-spectral imaging of intrinsic optical signals during hypoxia-induced spreading depression-like depolarization. PloS One. 2012; 7: e43981. [DOI] [PMC free article] [PubMed] [Google Scholar]
- 43.Hansen AJ, Quistorff B, Gjedde A. Relationship between local changes in cortical blood flow and extracellular K+ during spreading depression. Acta Physiol Scand. 1980; 109: 1–6. [DOI] [PubMed] [Google Scholar]
- 44.Strong AJ, Anderson PJ, Watts HR, et al. Peri-infarct depolarizations lead to loss of perfusion in ischaemic gyrencephalic cerebral cortex. Brain J Neurol. 2007; 130: 995–1008. [DOI] [PubMed] [Google Scholar]
- 45.Woitzik J, Dreier JP, Hecht N, et al. Delayed cerebral ischemia and spreading depolarization in absence of angiographic vasospasm after subarachnoid hemorrhage. J Cereb Blood Flow Metab. 2012; 32: 203–212. [DOI] [PMC free article] [PubMed] [Google Scholar]
- 46.Bere Z, Obrenovitch TP, Kozák G, et al. Imaging reveals the focal area of spreading depolarizations and a variety of hemodynamic responses in a rat microembolic stroke model. J Cereb Blood Flow Metab. 2014; 34: 1695–1705. [DOI] [PMC free article] [PubMed] [Google Scholar]
- 47.Dreier JP. The role of spreading depression, spreading depolarization and spreading ischemia in neurological disease. Nat Med. 2011; 17: 439–447. [DOI] [PubMed] [Google Scholar]
- 48.Duckrow RB. A brief hypoperfusion precedes spreading depression if nitric oxide synthesis is inhibited. Brain Res. 1993; 618: 190–195. [DOI] [PubMed] [Google Scholar]
- 49.Kumagai T, Walberer M, Nakamura H, et al. Distinct spatiotemporal patterns of spreading depolarizations during early infarct evolution: evidence from real-time imaging. J Cereb Blood Flow Metab. 2011; 31: 580–592. [DOI] [PMC free article] [PubMed] [Google Scholar]
- 50.Luckl J, Zhou C, Durduran T, et al. Characterization of periinfarct flow transients with laser speckle and Doppler after middle cerebral artery occlusion in the rat. J Neurosci Res. 2009; 87: 1219–1229. [DOI] [PubMed] [Google Scholar]
- 51.Nakamura H, Strong AJ, Dohmen C, et al. Spreading depolarizations cycle around and enlarge focal ischaemic brain lesions. Brain J Neurol. 2010; 133: 1994–2006. [DOI] [PMC free article] [PubMed] [Google Scholar]
- 52.Santos E, Schöll M, Sanchez-Porras R, et al. Cortical spreading depression dynamics can be studied using intrinsic optical signal imaging in gyrencephalic animal cortex. Acta Neurochir Suppl. 2013; 118: 93–97. [DOI] [PubMed] [Google Scholar]
- 53.Sukhotinsky I, Dilekoz E, Moskowitz MA, et al. Hypoxia and hypotension transform the blood flow response to cortical spreading depression from hyperemia into hypoperfusion in the rat. J Cereb Blood Flow Metab. 2008; 28: 1369–1376. [DOI] [PubMed] [Google Scholar]
Associated Data
This section collects any data citations, data availability statements, or supplementary materials included in this article.