

Abstract
Glioblastoma multiforme (GBM), WHO grade IV astrocytoma, is the most common primary neoplasm of the central nervous system (CNS) and has the highest malignancy and mortality rates. The invasive nature of GBM complicates surgical resection and restricts chemotherapeutic access, contributing to poor patient prognosis. The migration of tumor cells is closely related to the tumor cell proliferation. The acquisition of migratory capability, in addition to intracellular factors, is proposed to be a crucial mechanism during the progression of invasion. Using qRT-PCR analysis, we determined that the expression of miR-451 in glioma tissue was lower than in control brain tissue, especially in the central portions of the tumor. In glioma cell lines, we found that decreased miR-451 expression suppressed tumor cell proliferation but enhanced migration with a concomitant low level of CAB39/AMPK/mTOR pathway activation and high level of Rac1/cofilin pathway activation, respectively. Notably, the effect of miR-451 on cytological behavior and on the activation of mTOR and Rac1 was limited when AMPKα1 expression was knocked-down with a synthetic shRNA. We suggest that the glioma microenvironment results in heterogeneity of miR-451 expression. Our data indicated that miR-451 relays environmental signals by upregulating the activity of AMPK signaling, thereby modulating the activation of mTOR and Rac1/cofilin which, in turn, play key roles in glioma cell proliferation and migration, respectively. Our results highlight the need to consider opposing roles of a therapeutic target which, while suppressing tumor cell proliferation, could also promote cell infiltration.
Keywords: glioma, miR-451, migration, AMPK, mTORC1, Rac1, cofilin
Introduction
Malignant gliomas are the most common primary brain tumors in adults. Most patients present with glioblastoma multiforme (GBM), WHO grade IV tumor at diagnosis. The prognosis for these patients is poor; the median survival is 15 months, even with the current standard of care, surgical resection of the tumor followed by concomitant radio-chemotherapy and sequential temozolomide administration (1–3). The invasion and migration of the tumor is one of the intrinsic characteristics of GBM, demonstrated by both local recurrence and metastasis and it is a major cause of death in GBM patients (4). Ironically, the aggressive potential of GBM may also be increased by radiotherapy and chemotherapy in vivo (5,6). It is believed that the initial acquisition of migratory and invasive capabilities by glioma cells is the rate-limiting step of the invasion cascade, and the progression from a non-migratory to a migratory cellular phenotype is a critical step in the invasive progression of GBM (7,8).
It has been shown that phenotypic progression of malignant cells from a proliferating to a migrating state is initially driven by the harsh microenvironment where the cells propagate. Generally, this process is controlled by a complex signaling network with different regulatory levels. In glioma cells, mTOR (mammalian target of rapamycin), a highly conserved serine/threonine kinase found in all eukaryotic cells, is considered to be a central regulator of cell growth (9). In contrast, Ras-related C3 botulinum toxin substrate 1 (Rac1), a member of the Rho family of GTPases, promotes cell migration by regulating actin polymerization at the front of migrating cells and induces the formation of membrane ruffles and lamellipodia (10,11). It is reasonable to assume that the switching of cellular phenotype from proliferation to migration might be alternatively regulated by mTOR or Rac1 activation. Therefore, the master regulator of mTOR and Rac1 is a compelling subject for further investigation.
Endogenous microRNAs (miRNAs, miRs) are 18- to 24-nucleotide (nt) single-stranded RNA (ssRNA) molecules that function in the regulation of gene expression (12). Translation of the targeted mRNAs is inhibited post-transcriptionally by the binding of miRs to sequences in the 3′untranslated region (3′UTR) (13–15). It has been demonstrated that miRs play critical roles in biological processes including positive and negative effects on tumor cell development, differentiation, proliferation, apoptosis, invasion and pluripotency in various cancers (16–18). In malignant gliomas, the dysregulation of a number of miRs has been confirmed, including miR-21, miR-451, miR-23a, miR-145, miR-155, miR-218, miR329 and others (19,20). Of these dysregulated miRs, miR-451 is peculiar in that its expression is responsive to metabolic stress in the microenvironment. A recent study suggested that elevated miR-451 suppresses the expression of calcium-binding protein 39 (CAB39, also known as MO25α), leading to repression of LKB1 activity and its downstream substrate AMP-activated protein kinase (AMPK). This repression facilitates unrestrained mTOR activation and maintains high cellular proliferation rates (21). However, it is still unknown whether reduced expression of miR-451, in contrast, would induce AMPK activity, thereby activating Rac1 and promoting cell motility. Further investigation is also essential to determine whether AMPK is, in fact, the master regulator through which miR-451 functions to regulate the switch between mTOR or Rac1 activation.
Materials and methods
Human tissue
Human tissue specimens were obtained at the General Hospital of Tianjin Medical University (Tianjin, China). Forty GBM specimens and 25 control brain tissue specimens were collected from surgeries for tumor resection or temporal lobe epilepsy, respectively. Tissue samples were immediately frozen in liquid nitrogen and stored at −80°C. All procedures used in the present study were approved by the Ethics Committee of Tianjin Medical University and informed consents were obtained from all patients included in the study.
Cells and cell culture
The human GBM cell lines U-87, SNB-19 and U-251 were purchased from the Institute of Biochemistry and Cell Biology, Chinese Academy of Science. All cell lines were cultured in Dulbecco's modified Eagle's medium (DMEM; Gibco, Waltham, MA, USA) supplemented with 10% fetal bovine serum (FBS; Invitrogen, Carlsbad, CA, USA) in a 37°C, 5% CO2 incubator.
miRNA overexpression and knockdown
Simulated overexpres-sion of miR-451 was accomplished using the oligonucleotide 5′-AAACCGUUACCAUUACUGAGUU-3′, whereas its knockdown was achieved with the complementary oligonucleotide 5′-AACUCAGUAAUGGUAACGGUUU-3′. Synthetic miR-451, miR-451 inhibitor and scrambled negative control ssRNA were purchased from Shanghai GenePharma, Co., Ltd. (Shanghai, China). U-87, U-251 or SNB-19 cells were seeded into 6-well culture plates and transfected with 100 pmol of miR oligonucleotides using Lipofectamine RNAiMAX (Invitrogen) when the cells reached 70% confluency. After 6 h, the medium was changed to DMEM or McCoy's 5A supplemented with 1% phosphate-buffered saline (PBS). Cells were harvested 24 or 48 h after transfection. The expression level of miR-451 was analyzed by quantitative reverse transcription-PCR (qRT-PCR).
AMPKα1 knockdown
The lentiviral vectors expressing an AMPKα1 shRNA or fluorescence protein (as a negative control) were synthesized by Shanghai GenePharma. AMPKα1 shRNA and the control vector (1 µg/ml medium) was transfected into the human U-87, SNB-19 or U-251 cells according to the manufacturer's protocol.
Real-time PCR analysis
Total RNA extractions were performed using TRIzol (Invitrogen), according to the manufacturer's instructions. Integrity of the isolated RNA quality was determined by electrophoresis in a 1% agarose-formaldehyde gel. First strand cDNA was generated by reverse transcription. Subsequent PCR amplification was performed using a real-time PCR cycler (ABI 7500; Applied Biosystems, Foster City, CA, USA). Expression levels of mature miR-451 were quantified by miR-qRT-PCR using Hairpin-it™ miRNA qPCR Quantitation kit (Shanghai GenePharma). The amplification reaction (40 µl) included 2X real-time buffer, 5 µM miR-specific primer set (0.80 µl), ddH2O (15 µl), cDNA (4 µl), and 0.2 µl Taq DNA polymerase (5 U/µl). The reaction conditions were as follows: an initial denaturation at 95°C for 3 min; 40 cycles of denaturation at 95°C for 12 sec followed by extension at 62°C for 60 sec; and a final ramping from 62°C up to 95°C followed by cooling to 0.2°C for 2 sec. The results of the real-time PCR were analyzed using the ΔΔCt method: ΔCt = Ctselected gene − Ctu6, ΔΔCt = ΔCttherapy group − ΔCtcontrol group, RQ (Relative Quantitation)therapy group = 2−ΔΔCT, RQcontrol group = 1. The results of the real-time PCR were presented as the ratio between the selected genes and U6 transcripts.
Annexin V/PI analysis
The apoptosis induced by VP-16 was assessed by staining cells with an Annexin V-fluorescein isothiocyanate (FITC) apoptosis detection kit (556547; BD Biosciences, San Jose, CA, USA). Cells were treated similarly as in the cell cycle assay. The cells were collected and then washed with cold PBS twice. Then, they were resuspended in 100 µl of Annexin V binding buffer and incubated with 5 µl of FITC-conjugated Annexin V and 5 µl of propidium iodide for 15 min in the dark. Annexin V binding buffer (200 µl) was then added to each tube. Finally, the cells were examined using a BD FACSCanto II flow cytometer (BD Biosciences).
MTT assay
Transfected and control cells in the log-phase of growth were seeded into 96-well plates at a density of 0.4×10⁴ cells/well in 0.1 ml supplemented DMEM. Each day, for seven consecutive days, 20 µl of MTT (5 mg/ml) was added to the corresponding well, and cells were incubated at 37°C for an additional 4 h. The reaction was stopped by lysing the cells with 200 µl of dimethyl sulfoxide (DMSO) for 20 min. Optical density was measured at 570 nm, and the data were expressed as a percentage of the control well.
Transwell migration assay
Transwell filters (Corning Costar, Corning, NY, USA) were coated with Matrigel (3.9 µg/µl, 60–80 µl) on the upper surface of the polycarbonic membrane (diameter 6.5 mm, pore size 8 µm). Following incubation for 30 min at 37°C, the Matrigel solidified and served as the extracellular matrix for tumor cell invasion analysis. Harvested cells (1×10⁵) of the transfected or control groups in 100 µl of serum-free DMEM were added into the upper compartment of the chamber, and 200 µl of conditioned medium from U-87, SNB-19 or U-251 cells was used as the chemoattractant and placed in the bottom chamber. After incubation for 24 h at 37°C and 5% CO2, the medium was removed from the upper chamber. The non-invaded cells on the upper side of the chamber were scraped off with a cotton swab. The cells that had migrated from the Matrigel into the pores of the inserted filter were fixed with 100% methanol, stained with hematoxylin, mounted and dried at 80°C for 30 min. The number of cells invading the Matrigel was counted from three randomly selected visual fields, each from the central and peripheral portions of the filter, using an inverted microscope at ×200 magnification. Each test was performed in triplicate.
Immunofluorescence
The glioma cells under different treatments were grown on glass coverslips for 24 h. The cells were washed and then fixed with 4% paraformaldehyde for 25 min. Fixed cells were permeabilized by treatment with 0.5% Triton X-100 for 5 min and blocked by incubation with 5% BSA in PBS for 1 h. The cells were then incubated overnight at 4°C with p-cofilin (rabbit) antibodies at a dilution of 1:100. The cells were washed three times with PBS and then incubated for 1 h with Alexa 488-conjugated goat anti-rabbit secondary antibody at a dilution of 1:1,000 for 1 h at 37°C. The cells were washed with PBS and then counterstained with rhodamine phalloidin for 20 min to stain actin filaments and DAPI to stain DNA. The cells were imaged under a confocal microscope (Olympus FV1000; Research Center of Basic Medical Science of Tanjin Medical University; Olympus, Tokyo, Japan).
Rac1 activation assay
Rac1 activation assays were conducted as previously described to test the activation of Rac1 in cells (22). Briefly, cells were rinsed with cold PBS and lysed in ice-cold radioimmunoprecipitation assay (RIPA) buffer. Lysates were cleared by centrifugation and the protein concentration in the clarified supernatant was measured. Equal amounts of protein (400–600 µg) were incubated with 50 µg of PAK1 agarose beads (Assay Designs, Farmingdale, NY, USA), and the reaction mixture was gently rocked at 4°C for 60 min. The agarose beads were collected by pulsing for 5 sec in a microcentrifuge at 14,000 × g and the supernatant was removed and discarded. The beads were washed thrice with lysis buffer, and the agarose beads were resuspended in 40 µl of 2× Laemmli buffer and boiled for 10 min to elute the bound proteins. Eluted proteins were resolved in 12% polyacrylamide gels, transferred to polyvinylidene difluoride (PVDF) membranes, and immunoblotted with the anti-Rac1 antibody (Abcam, Cambridge, UK).
Western blot analysis
U-87, SNB-19 and U-251 cells were lysed in 1% Nonidet P-40 lysis buffer 48 h after transfection with negative control ssRNA, miR-451, or miR-451 inhibitor oligonucleotide. Homogenates were clarified by centrifugation at 20,000 × g for 15 min at 4°C, and protein concentration was measured by the Lowry method. SDS-PAGE gels were loaded with 40 µg of protein from each sample, and resolved proteins were transferred to PVDF membranes (Millipore, Billerica, MA, USA) and incubated with primary antibodies against Rac1 (1:1,000 dilution; Abcam), AMPKα1, p-AMPKα1, mTORC1, p-mTORC1, confilin or p-confilin (1:1,000 dilution; Cell Signaling Technology, Danvers, MA, USA), followed by incubation with an HRP-conjugated secondary antibody (1:1,000 dilution; Zymed, San Diego, CA). The specific protein was detected using the SuperSignal protein detection kit (Pierce, Waltham, MA, USA). After washing with stripping buffer, the membrane was reprobed with antibody against GAPDH (1:1000 dilution; Santa Cruz Biotechnology, Santa Cruz, CA, USA).
Results
miR-451 is downregulated in glioma tissues, especially in the central portions of tumors
We first determined the relative expression of miR-451 in human glioma tissues and control brain tissues by qRT-PCR analysis. The data demonstrated that the level of miR-451 was significantly suppressed (P<0.01) in glioma tissues when compared to the control brain tissues (Fig. 1).
Figure 1.
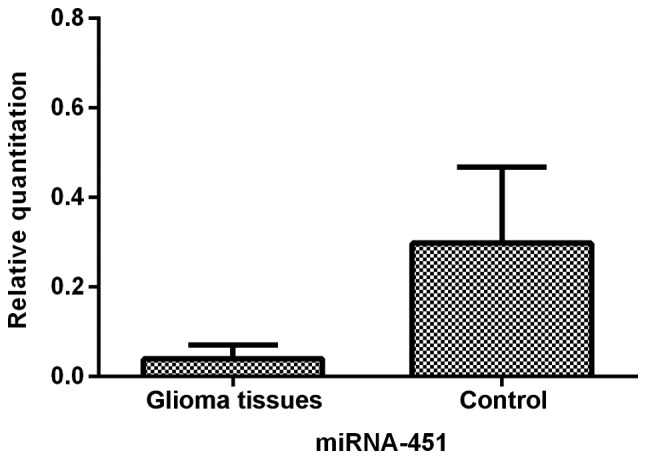
miR-451 expression in gloma tissue and control brain tissue determined by qRT-PCR. The level of miR-451 in glioma tissues was 13.09% of that in brain tissues (P<0.01).
To characterize miR-451 expression in glioma tissues further, we analyzed the heterogeneous expression of miR-451 between the central and periphery regions of sixteen glioma tissues. The data showed that cells in the periphery region of glioma tissues expressed 6.88-fold (±1.91) greater levels of miR-451 than cells in the central region (P<0.05; Fig. 2). The tumor cells in the central region of the glioma tissues appeared to express much less miR-451, indicating that downregulation of miR-451 expression is sensitive to hypoxic-hypoglycemic microenvironments.
Figure 2.
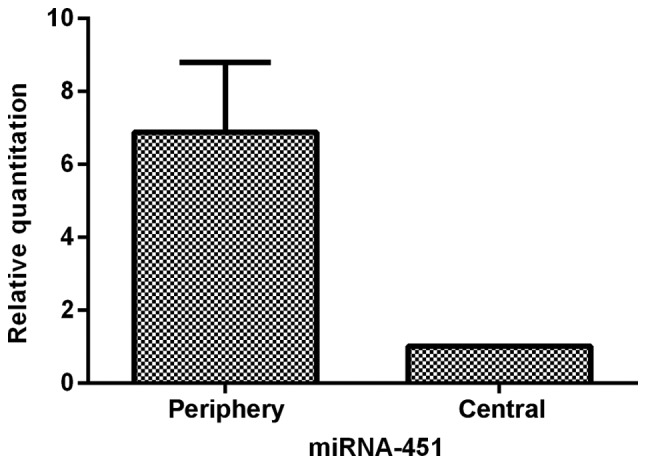
The comparison of miR-451 expression between peripheral area and central area of GBM determined by qRT-PCR. The data showed that cells in peripheral area of GBM harbored (5.88±1.91) (P<0.05) fold higher expression of miR-451 than cells in central area.
miR-451 enhances the proliferation in glioma cells regulating CAB39/AMPK/mTOR pathway
To clarify the role of miR-451 and downstream molecular targets in glioma cells, we prepared synthetic miR-451 and miR-451 inhibitor and used them to alter the expression levels of miR-451 in three glioma cell lines: U-87, U-251 and SNB-19. After transfection of the oligonucleotides into the cells, qRT-PCR was performed to test the efficiency of expression dysregulation. Compared to the control groups, the miR-451 level was increased in the synthetic miR-451-treated U-87, U-251 and SNB-19 cells with an RQ of 250.60±47.53, 187.46±52.64 and 137.63±29.14, respectively. In contrast, expression decreased in the miR-451 inhibitor-treated U-87, U-251 and SNB-19 cells with an RQ of 0.017±0.003, 0.025±0.013 and 0.019±0.007 (each of the three cell lines P<0.01), respectively (Fig. 3).
Figure 3.
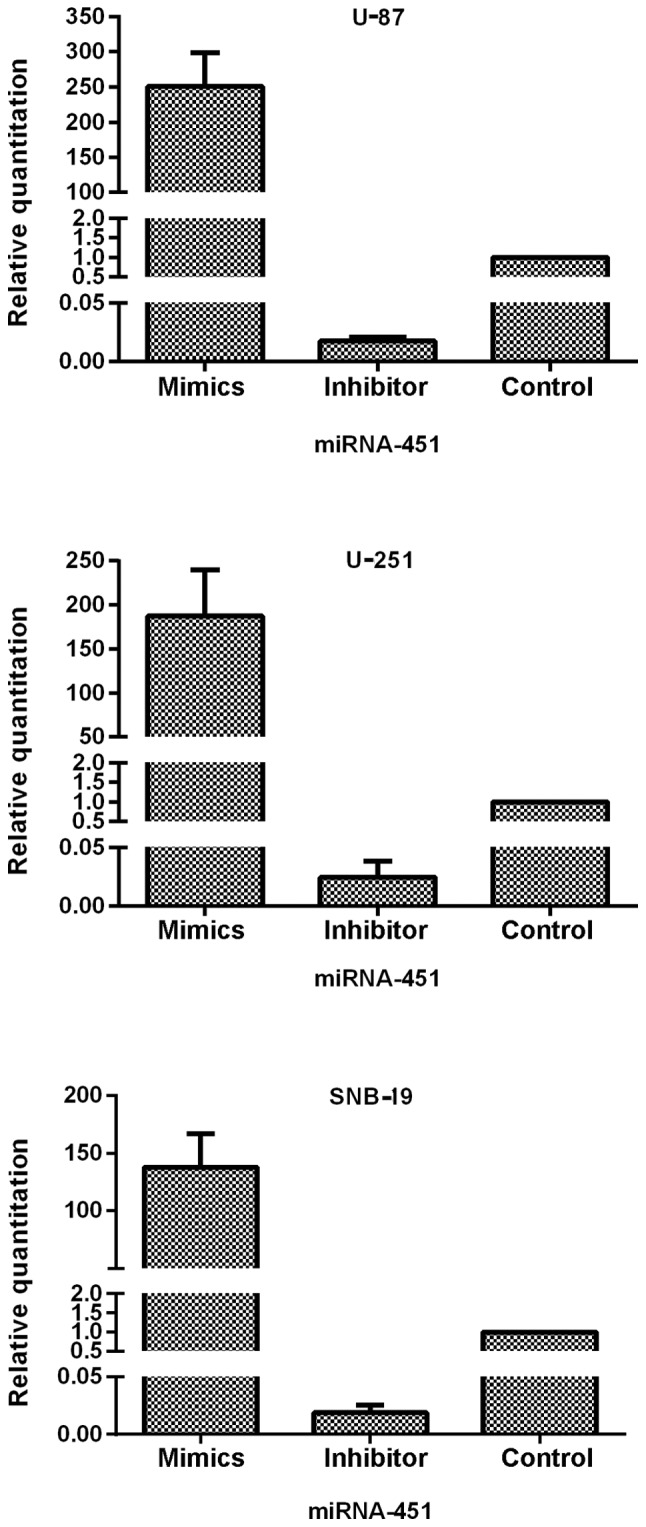
The efficiency of oligonucleotide transfection determined by qRT-PCR. The expression of miR-451 was elevated in miR-451 mimics-treated cells was elevated and suppressed in miR-451 inhibitor-treated cells compared with control group. The miR-451 mimics and miR-451 inhibitor transfected with Lipofectamine 2000 in U-87, U-251 and SNB-19 cells, respectively. Cells were incubated with oligonucleotide as described for 24 h, and miR-451 mRNA was quantified by qRT-PCR. In U-87 cells, miR-451 expression was 250.60±47.53-fold increased in mimics-treated group and depressed with the RQ of 0.017±0.003 in inhibitor-treated group. In U-251 cells, miR-451 expression was 187.46±52.64-fold increased in mimics-treated group and depressed with the RQ of 0.025±0.013 in inhibitor-treated group. In SNB-19 cells, miR-451 expression was 137.63±29.14-fold increased in mimics-treated group and depressed with the RQ of 0.019±0.007 in inhibitor-treated group. Data represent mean ± SD of three independent experiments (P<0.05).
Furthermore, MTT assays and Annexin V/PI analysis were performed to measure the role of miR-451 in cellular proliferation. Cell growth was followed on days 2 through 7 following transfection with miR-451 or the inhibitor in all three cell lines compared with the control group. Transfection of U-87, U-251 and SNB-19 cells with synthetic miR-451 resulted in 127.21±3.06, 140.20±4.61 and 135.46±5.21% increased cell growth rates, respectively. In contrast, miR-451 inhibitor-treated cells showed a slower growth rate of 40.23±3.97, 37.31±4.13 and 43.97±5.37%, respectively, compared to the control group (each cell line P<0.01) (Fig. 4A). Whereas, miR-451 had no effect on apoptosis in oligonucleotides treated and non-treated glioma cells. The percentage of viable cells had no significant difference among the three groups in each cell line (P>0.05; Fig. 4B). The cells with highest expression levels of miR-451 showed the fastest rates of cellular proliferation.
Figure 4.

The effect of miR-451 on cell proliferation of glioma cell lines. (A) According to the MTT assay, cellular survival following miR-451 mimics transfection was increased and following miR-451 inhibitor transfection was decreased in the three glioma cell lines. Cell survival was quantified by MTT assay at each day from 2nd to 7th day following treatment as described. The survival rate in the control group is presented as 100%. Cells with miR-451 mimic oligonucleotides result in 127.21±3.06% increased growth rate of cells in U-87 cell line. Cells with miR-451 mimic oligonucleotides result in 140.20±4.61% increased growth rate of cells in U-251 cell line. Cells with miR-451 mimic oligonucleotides result in 135.46±5.21% increased growth rate of cells in SNB-19 cell line. In contrast, miR-451 inhibitor-treated U-87 cells showed a lower proliferative rate of 40.23±3.97% compared to the control group cells. miR-451 inhibitor-treated U-251 cells showed a lower proliferative rate of 37.31±4.13%. miR-451 inhibitor-treated SNB-19 cells showed a lower proliferative rate of 43.97±5.37%. (B) The percentage of viable cells had no significant difference among the three group in each cell line in the Annexin V/PI analysis (P>0.05). Data represent mean ± SD of three independent experiments (P<0.05).
To investigate the downstream molecular targets affected by miR-451 upregulation or downregulation in glioma cells, we transfected synthetic miR-451 or miR-451 inhibitor into U-87, U-251 and SNB-19 cells. The levels of CAB39, p-AMPK and AMPK expression were assessed semi-quantitatively by western blotting. The data showed no significant difference in AMPKα1 expression (P>0.05), while CAB39 expression (40.53±4.61, 39.91±4.23 and 41.06±9.87 in U-87, U-251 and SNB-19 cells, respectively) and p-AMPKα1 expression (36.44±3.76, 35.63±2.06 and 29.47±6.59% in U-87, U-251 and SNB-19 cells, respectively) declined after treatment with synthetic miR-451. These results indicate that elevated miR-451 inhibits the expression of the immediate downstream target CAB39, which subsequently leads to decreased AMPK activation.
To determine the activation state of mTOR after miR-451 upregulation in glioma cells, mTOR and p-mTOR expression levels were evaluated by western blotting. No significant difference was found in mTOR expression levels, while p-mTOR expression was elevated (207.62±19.64, 228.85±23.10 and 188.97±16.73% in U-87, U-251 and SNB-19 cells, respectively). In short, increased expression of miR-451 enhances mTOR activation regulating the dominance of downstream mTOR-dependent pathways (Fig. 5).
Figure 5.

The effect of miR-451 downstream of CAB39/AMPK/mTOR pathway in glioma cell lines determined by western blot analysis. Impact of miR-451 mimics and inhibitor oligonucleotides on the expression of CAB39, p-AMPK, AMPK, mTOR and p-mTOR. U-87, U-251 and SNB-19 cells were treated with oligonucleotides, as described. CAB39, p-AMPK, AMPK, mTOR, p-mTOR and GAPDH expression was determined following treatment by western blot analysis. Expression of CAB39 was declined in miR-451 mimics group. No statistical difference of total AMPKα1 and mTOR was found. When we evaluated the activation of p-AMPKα1 and p-mTOR expression level, representing activation of AMPK and mTOR, was elevated in miR-451 mimics-treated cells. Data are from one of three representative experiments in U-87, U-251 and SNB-19 cell lines.
Decreased miR-451 triggers the enhanced cell motility in glioma cells
To evaluate the impact of miR-451 expression on cell migration, the Transwell migration assay was conducted. Glioma cells were seeded 6 h after the transfection with the miR-451 oligonucleotides. In the Transwell migration assay, we counted the number of cells that migrated onto the Transwell chamber membrane. The cell number counted in the synthetic miR-451-treated U-87 (34.67±2.08), U-251 (35.67±8.50) and SNB-19 (13±4.58) groups were less than in the respective control groups (P<0.01), whereas, the number of cells on the Transwell chamber membrane in the miR-451 inhibitor-treated groups of U-87 (91.67±7.51), U-251 (106.00±5.57) and SNB-19 (75.00±8.89) were much greater than in the respective control groups (P<0.01; Fig. 6B).
Figure 6.

The effect of miR-451 on cell migration of glioma cell lines evaluated by Transwell migration assay. The Transwell migration assay were conducted to assess the migration ability of different treatment groups of glioma cells as described. The data showed that miR-451 suppressed the migration of cell lines. (A) In the Transwell migration assay, cells that had migrated through the membrane were stained by crystal violet and photographed after a 16-h incubation in chambers. The number of cells of miR-451 inhibitor group on surface of the membrane was the largest of the three groups, and it was the least in miR-451 mimics group. (B) Quantified data showed that the number of cells, which were on the chamber membranes, of miR-451 inhibitor-treated group were much more than the number of the control group (*P<0.05).
These results suggest that elevated miR-451 levels in cultured glioma cells might promote cell proliferation in vitro, while decreased miR-451 levels might trigger enhanced cell motility.
Consequently, the fluctuation of miR-451 expression in glioma cells appears to be associated with the phenotypic switch between cellular proliferation and migration.
Activation of Rac1/cofilin pathway is required for the enhanced migration of miR-451 decreased glioma cells
We recruited the immunofluorescence and western blot analysis to investigate lamellipodia and Rac1/confilin activation in decreased miR-451 glioma cells. miR-451 inhibitor enhanced the formation of lamellipodia in glioma cells increasing the fluorescence intensity (Fig. 7A).
Figure 7.

Decreased expression of miR-451 triggers Rac1 activation, thereby regulating the dominance of downstream Rac1-dependent pathway. (A) miR-451 inhibitor enhanced the formation of lamellipodia in glioma cells increasing the fluorescence intensity in glioma cells. After treatment with miR-451 inhibitor for 24 h, the glioma cells of both treatment groups were grown on glass coverslips for 24 h and then IF was performed. The images showed that lamellipodia were bigger following treatment with miR-451 inhibitor. Images were captured using a confocal microscope. Actin (red), Cortactin (green) and nuclei (blue). IF, immunofluorescence. (B) The effect of miR-451 downstream of Rac1 in glioma cell lines determined by western blot analysis and Rac1 activation assay. No statistical difference of total AMPKα1, mTOR and Rac1 was found, while expression of GTP-Rac1, representing activation of Rac1 was increased in miR-451 inhibitor-treated cells. (C) The decreased expression of miR-451 enhanced the activation of Rac1/cofilin pathway. The expression of Rac1 is required for this miR-451 effect.
To determine the activation state of Rac1 after miR-451 upregulation in glioma cells, Rac1 expression levels were evaluated by western blotting, and the Rac1 activation assay was utilized to analyze GTP-Rac1 expression. No significant difference was found in Rac1 expression levels, while GTP-Rac1 expression decreased in the synthetic miR-451-treated cells (32.76±6.31, 32.19±3.84 and 24.76±1.69% in U-87, U-251 and SNB-19 cells, respectively) compared to the control groups (P<0.01; Fig. 7B).
siRNA-Rac1 were then transfected into the miR-451 inhibitor-treated group and control group cells separately. The data of western blot analysis suggested that the inhibition of miR-451 increased the the expression of p-confilin with the activation of Rac1, whereas, siRNA-Rac1 suppressed the enhanced activation of confilin in glioma cells with lower miR-451 expression (Fig. 7B).
In short, increased expression of miR-451 decreases Rac1 activation, thereby regulating the dominance of downstream Rac1-dependent pathways.
AMPK is essential for miR-451 regulation of proliferation and migration
Considering the previous results, AMPK activation appears to be deeply involved in the miR-451-dependent phenotypic switch between cellular proliferation and migration in glioma cells. As shown in Fig. 8, we used a synthetic shRNA to knock down AMPKα1, and established three cell line derivatives; U-87-N.A, U-251-N.A and SNB-19-N.A. qRT-PCR and western blotting were used to test the efficiency of AMPKα1 knockdown. The mRNA expression levels of AMPKα1 in the U-87-N.A (15.91±4.50), U-251-N.A (15.16±6.69) and SNB-19-N.A (13.81±3.75%) cell lines were markedly decreased, as were the levels of AMPKα1 protein (26.72±5.93, 24.87±3.28 and 21.97±6.72% in U-87-N.A, U-251-N.A and SNB-19-N.A cells, respectively), compared to the control groups (P<0.01; Fig. 8).
Figure 8.

The efficiency of shRNA transfection determined by qRT-PCR and western blot analysis. We employed a synthetic shRNA to knock down the AMPKα1 in glioma cell lines establishing three new cell lines, U-87-N.A, U-251-N.A and SNB-19-N.A. qRT-PCR and western blot were performed to test the efficiency of RNAi. (A) qRT-PCR showed that the expression of AMPKa1 mRNA in shRNA-AMPKα1 group was significantly decreased (*P<0.05 and #P>0.05). (B) 1, 2 and 3 stand for the shRNA-AMPKα1 group, shRNA-N.C group and control group. Western blot analysis showed that AMPKα1 was markedly knocked down in shRNA-AMPKα1 group (P<0.05).
The glioma cell line derivatives were subsequently transfected with the synthetic miR-451 or the miR-451 inhibitor oligonucleotides. MTT assays were performed to determine the rates of cell growth. Following treatment with synthetic miR-451, the proliferation rate was 109.67±6.71, 104.71±5.43, and 110.46±5.73% in U-87-N.A, U-251-N.A and SNB-19-N.A cells, respectively, compared to the parental glioma cell lines. Moreover, following transfection with the miR-451 inhibitor, the proliferation rate was 108.99±6.55, 103.78±5.32 and 110.21±5.68% in U-87-N.A, U-251-N.A and SNB-19-N.A cells, respectively. These data clearly show that no significant difference was found in the cellular growth rates between synthetic miR-451-treated AMPKα1 knockdown cells and the respective parental glioma cells, nor between miR-451 inhibitor-treated AMPKα1 knockdown cells and the respective parental glioma cells (P>0.05; Fig. 9). These results imply that miR-451 fails to regulate glioma cell proliferation in the absence of AMPKα1, regardless of the level of miR-451 expression.
Figure 9.

The effect of miR-451 on cell proliferation of AMPKα1 knocked-down glioma cell lines evaluated by MTT assay. Cellular survival following miR-451 mimics and inhibitor oligonucleotide transfection. U-87-N.A, U251-N.A and SNA-19-N.A cells were plated into 96-well plate at densities of 0.4×10⁴ cells/well and treated with miR-451 mimics or inhibitor oligonucleotides or controls, respectively. Cell survival was quantified by MTT assay at each day from 2nd to 7th day following treatment. The survival rate in the control group is presented as 100%. Data represent mean ± SD of three independent experiments. No statistical difference was found between miR-451 mimics treated group and miR-451 inhibitor treated group (P>0.05).
As reported previously, the migration ability of the newly established U-87-N.A, U-251-N.A and SNB-19-N.A cell lines was investigated. After treatment with synthetic miR-451, the number of glioma cells migrating onto the Transwell membrane was 73.33±12.50 in U-87-N.A, 45.67±11.72 in U-251-N.A, and 51.00±7.21 in SNB-19-N.A cells. After treatment with miR-451 inhibitor, the number of glioma cells migrating onto the Transwell membrane was 67.67±9.07 in U-87-N.A, 43.33±7.51 in U-251-N.A and 57.33±9.71 in SNB-19-N.A cells. By comparison, in the control groups the number of glioma cells migrating onto the Transwell membrane was 78.67±9.61 in U-87-N.A, 49.67±11.24 in U-251-N.A and 58.67±6.51 in SNB-19-N.A cells. Thus, the number of cells migrating onto the Transwell chamber membrane showed no significant difference among the treatment conditions (P>0.05) (Fig. 10). These results imply that miR-451 fails to regulate glioma cell migration in the absence of AMPKα1, regardless of the level of miR-451 expression.
Figure 10.

The effect of miR-451 on cell migration of AMPKα1 knocked-down glioma cell lines evaluated by Transwell migration assay. No statisitical difference of cell number on Transwell chamber membrane was demonstrated in the 3 AMPK-knockdown glioma cell lines (P>0.05).
miR-451 regulates activation of mTOR and Rac1 via AMPK
To further investigate the downstream molecular targets in AMPK-knockdown glioma cells in response to miRNA-451 dysregulation, we examined mTOR, p-mTOR, Rac1 and GTP-Rac1 expression by western blotting in the knockdown derivative cell lines treated with synthetic miR-451, miR-451 inhibitor, or the control oligonucleotide. Neither mTOR nor p-mTOR protein expression showed a significant difference in the three AMPKα1-knockdown glioma cell lines under any treatment condition, nor did Rac1 or GTP-Rac1 (Fig. 11). These results imply that miR-451 fails to regulate mTOR and Rac1 activation in glioma cells lacking AMPKα1, regardless of miR-451 expression levels.
Figure 11.

The effect of miR-451 downstream of CAB39, AMPK, mTOR and Rac1 in AMPKα1 knocked down glioma cell lines determined by western blot analysis and Rac1 activation assay. Western blot analysis were performed to evaluate the expression of activation of AMPK, mTORC1 and Rac1. The data indicated that expression level of AMPK, mTOR and Rac1 had no statistical difference. In addition, expression of p-AMPK, p-mTOR and GTP-Rac1 had no statistical difference in the three groups (P>0.05).
Discussion
The microenvironment within and around tumors is an important determinant in the phenotype of tumor cells. The 'go or grow' hypothesis, first described in 1996, suggests that a dichotomy exists between cellular proliferation and motility, and such hypothesis has been corroborated by several in vitro studies and through mathematical modeling (8,23). In the stereotypical environment, tumor cells have higher proliferation rates, but when the conditions become unfavorable (e.g., acidic pH, decreased nutrient availability, or decreased oxygen level), cells begin to migrate away in search of better conditions at the expense of their proliferation ability (24,25). Thus, it seems that the preference between proliferation or migration is driven by microenvironmental conditions and is an intrinsic property of tumor cells, largely complying with the law of macroecology, similar to the migration of human beings. Antiangiogenic GBM therapy with bevacizumab is a good example to demonstrate the relationship between a harsh microenvironment and the migration of tumor cells. de Groot et al (26) noted an apparent phenotypic shift to a predominantly infiltrative pattern of tumor progression after treatment with bevacizumab.
Because miR-451 was reported to have a prominent role in glioma, a study of miR profiles in glioblastoma cell lines, GBM tissue, and brain tissue showed that miR-451 had reduced expression levels in GBM compared to normal brain tissues (11). In fact, the microenvironment is also heterogeneous within a tumor. Microenvironmental conditions in the center of a GBM tumor are harsher compared to the periphery of the tumor. In the central hypoxic-hypoglycemic microenvironment, the growth of tumor cells is inhibited, and necrosis is apparent, while in the peripheral portions of the tumor, the survival of tumor cells is enhanced, and the tumor cells actively proliferate and infiltrate into the surrounding parenchyma. In the present study, we compared miR-451 expression not only between tumor tissue and control brain tissue but also between central and peripheral tissues of GBM tumors. We found that miR-451 expression was lower in central regions and higher in peripheral regions through the qRT-PCR analysis, a result indicating that miR-451 expression is also heterogeneous, acting in coordination with the microenvironmental heterogeneity. The results further emphasized that miR451 expression is regulated by the microenvironmental conditions and is related to the phenotypic switch between cellular proliferation and migration.
In our in vitro study, miR-451 levels were elevated or reduced in GBM cell lines following transfection with synthetic miR-451 or miR-451 inhibitor, respectively. We confirmed that the higher miR-451 level in the glioma cells could facilitate cellular proliferation while suppressing migration; in contrast, lower miR-451 levels promoted cell migration while suppressing cellular proliferation. In fact, miR-451 regulates the 'go or grow' biological behavior of tumor cells by epigenetic mechanisms. Understanding the downstream signaling pathways and identifying the master regulator controlling the phenotypic switch is essential to determine the utility of these therapeutic targets in clinical applications.
AMPK is a highly conserved sensor of cellular energy status in eukaryotes and is known as a regulator of cellular metabolism (27). It consists of a hetero-trimetric complex of two regulatory β/γ subunits and a single catalytic α subunit (28,29). AMPK is activated in response to an increase in the ratio of AMP to ATP within the cell and is phosphorylated at Thr172 within the activation domain of the α subunit by upstream kinases LKB1 (30–32) and calmodulin dependent protein kinase kinase β (CaMKKβ) (6,33–35). Under suitable conditions, normal or upregulated levels of miR-451 suppress the activation of the LKB1/AMPK pathway via downregulation of CAB39 expression. As a consequence, cellular proliferation is promoted because of unrestricted activity from mTORC1, an essential factor linking growth factor abundance to cell growth and proliferation (36). Godlewski et al (21) showed that the concentration of glucose in the microenvironment of glioma tumors is one of the triggers of this cascade.
In the present study, we found that upregulation of miR-451 suppressed the activation of the AMPK/mTOR pathway via downregulation of CAB39 expression, while downregulation of miR-451 facilitated the activation of the AMPK/mTOR pathway via increased expression of CAB39. The mechanism of miR-451/AMPK-mediated migration in glioma cells is not fully understood and is evident in the finding of Rac1 activation in both upregulated or downregulated miR-451 scenarios in the present study.
Cell migration begins with an initial protrusion or extension of the plasma membrane at the leading edge of the cell. The protrusion is driven by the polymerization of a network of cytoskeletal actin filaments and is stabilized through the formation of an adhesive complex (37). Rac1, a highly expressed protein in glioma and glioma stem cells, promotes cell spreading, lamellipodia formation and cell migration. Its activation and phosphorylation, the regulatory mechanism of Rho GTPase activation, are independent of GDP-GTP cycling (38,39). It is therefore possible that the activation of small GTPases or regulatory proteins of small GTPases, such as guanine nucleotide exchange factors, GDP dissociation inhibitors, and GTPase activating proteins could be promoted by the phosphorylation or activation of AMPK. Our data indicate a role for the miR-451/AMPK/Rac1 pathway in glioma cell migration.
At this time, we propose that miR-451 may function in glioma cells to control the phenotypic switch between proliferation and migration through AMPK/mTOR or AMPK/Rac1 activation. Whether AMPK plays the pivotal role in this process, activating mTOR and stimulating cellular proliferation or activating Rac1 and stimulating migration required further investigation. We found that RNAi knockdown of AMPK expression in glioma cells prevented miR-451-mediated regulation of mTOR and Rac1 activation, and also prevented the typical pattern of cellular proliferation or migration of glioma cells. These findings indicate that AMPKα1 involvement is essential in the miR-451-mediated regulation of proliferation and migration of glioma cells in response to the tumor micro-environment.
In conclusion, we demonstrated that miR-451 is down-regulated in GBM tissues, especially in the central regions of glioma tissues, compared to control brain tissues. The inclination toward proliferation or migration of glioma cells is influenced by the expression level of miR-451. By regulating the activity of AMPK, the master regulator in the downstream pathway, miR-451, reconfigures the activation of mTOR and Rac1, which play key roles in cellular proliferation and migration in glioma cells, respectively and enables cells to adapt to microenvironmental conditions in the tumor. This study demonstrates that any therapeutic target aimed to suppress proliferation of tumor cells should be carefully examined for potential roles in cell infiltration. In the case of GMB, reducing AMPK expression, compared to simply inhibiting AMPK activity, produces more desirable global effects that disrupt the regulation of mTOR and Rac1 activation.
Acknowledgments
The present study was supported by grants from the National Natural Science Foundation of China (no. 81472352, no. 81272782 and no. 81502171), Natural Science Foundation of Tianjin City (no. 15JCZDJC36200) and Science Projects of Logistics University of The Chinese People's Armed Police Force (WHJ2016027).
References
- 1.Furnari FB, Fenton T, Bachoo RM, Mukasa A, Stommel JM, Stegh A, Hahn WC, Ligon KL, Louis DN, Brennan C, et al. Malignant astrocytic glioma: Genetics, biology, and paths to treatment. Genes Dev. 2007;21:2683–2710. doi: 10.1101/gad.1596707. [DOI] [PubMed] [Google Scholar]
- 2.Chen J, Li Y, Yu TS, McKay RM, Burns DK, Kernie SG, Parada LF. A restricted cell population propagates glioblastoma growth after chemotherapy. Nature. 2012;488:522–526. doi: 10.1038/nature11287. [DOI] [PMC free article] [PubMed] [Google Scholar]
- 3.Westermark B. Glioblastoma: a moving target. Ups J Med Sci. 2012;117:251–256. doi: 10.3109/03009734.2012.676574. [DOI] [PMC free article] [PubMed] [Google Scholar]
- 4.Giese A, Bjerkvig R, Berens ME, Westphal M. Cost of migration: Invasion of malignant gliomas and implications for treatment. J Clin Oncol. 2003;21:1624–1636. doi: 10.1200/JCO.2003.05.063. [DOI] [PubMed] [Google Scholar]
- 5.Wild-Bode C, Weller M, Rimner A, Dichgans J, Wick W. Sublethal irradiation promotes migration and invasiveness of glioma cells: Implications for radiotherapy of human glioblastoma. Cancer Res. 2001;61:2744–2750. [PubMed] [Google Scholar]
- 6.Di Nicolantonio F, Mercer SJ, Knight LA, Gabriel FG, Whitehouse PA, Sharma S, Fernando A, Glaysher S, Di Palma S, Johnson P, et al. Cancer cell adaptation to chemotherapy. BMC Cancer. 2005;5:78. doi: 10.1186/1471-2407-5-78. [DOI] [PMC free article] [PubMed] [Google Scholar]
- 7.Wu Y, Zhou BP. New insights of epithelial-mesenchymal transition in cancer metastasis. Acta Biochim Biophys Sin (Shanghai) 2008;40:643–650. doi: 10.1111/j.1745-7270.2008.00443.x. [DOI] [PMC free article] [PubMed] [Google Scholar]
- 8.Hatzikirou H, Basanta D, Simon M, Schaller K, Deutsch A. 'Go or grow': the key to the emergence of invasion in tumour progression? Math Med Biol. 2012;29:49–65. doi: 10.1093/imammb/dqq011. [DOI] [PubMed] [Google Scholar]
- 9.Wullschleger S, Loewith R, Hall MN. TOR signaling in growth and metabolism. Cell. 2006;124:471–484. doi: 10.1016/j.cell.2006.01.016. [DOI] [PubMed] [Google Scholar]
- 10.Liu X, Zhang X, Xiang J, Lv Y, Shi J. miR-451: Potential role as tumor suppressor of human hepatoma cell growth and invasion. Int J Oncol. 2014;45:739–745. doi: 10.3892/ijo.2014.2446. [DOI] [PubMed] [Google Scholar]
- 11.Nan Y, Han L, Zhang A, Wang G, Jia Z, Yang Y, Yue X, Pu P, Zhong Y, Kang C. MiRNA-451 plays a role as tumor suppressor in human glioma cells. Brain Res. 2010;1359:14–21. doi: 10.1016/j.brainres.2010.08.074. [DOI] [PubMed] [Google Scholar]
- 12.Bartel DP. MicroRNAs: Genomics, biogenesis, mechanism, and function. Cell. 2004;116:281–297. doi: 10.1016/S0092-8674(04)00045-5. [DOI] [PubMed] [Google Scholar]
- 13.Grimson A, Farh KK, Johnston WK, Garrett-Engele P, Lim LP, Bartel DP. MicroRNA targeting specificity in mammals: Determinants beyond seed pairing. Mol Cell. 2007;27:91–105. doi: 10.1016/j.molcel.2007.06.017. [DOI] [PMC free article] [PubMed] [Google Scholar]
- 14.Bartel DP. MicroRNAs: Target recognition and regulatory functions. Cell. 2009;136:215–233. doi: 10.1016/j.cell.2009.01.002. [DOI] [PMC free article] [PubMed] [Google Scholar]
- 15.Kloosterman WP, Plasterk RH. The diverse functions of microRNAs in animal development and disease. Dev Cell. 2006;11:441–450. doi: 10.1016/j.devcel.2006.09.009. [DOI] [PubMed] [Google Scholar]
- 16.Hatziapostolou M, Iliopoulos D. Epigenetic aberrations during oncogenesis. Cell Mol Life Sci. 2011;68:1681–1702. doi: 10.1007/s00018-010-0624-z. [DOI] [PMC free article] [PubMed] [Google Scholar]
- 17.Iorio MV, Croce CM. microRNA involvement in human cancer. Carcinogenesis. 2012;33:1126–1133. doi: 10.1093/carcin/bgs140. [DOI] [PMC free article] [PubMed] [Google Scholar]
- 18.Zhang Y, Dutta A, Abounader R. The role of microRNAs in glioma initiation and progression. Front Biosci (Landmark Ed) 2012;17:700–712. doi: 10.2741/3952. [DOI] [PMC free article] [PubMed] [Google Scholar]
- 19.Gits CM, van Kuijk PF, Jonkers MB, Boersma AW, Smid M, van Ijcken WF, Coindre JM, Chibon F, Verhoef C, Mathijssen RH, et al. MicroRNA expression profiles distinguish liposarcoma subtypes and implicate miR-145 and miR-451 as tumor suppressors. Int J Cancer. 2014;135:348–361. doi: 10.1002/ijc.28694. [DOI] [PubMed] [Google Scholar]
- 20.Liu D, Liu C, Wang X, Ingvarsson S, Chen H. MicroRNA-451 suppresses tumor cell growth by down-regulating IL6R gene expression. Cancer Epidemiol. 2014;38:85–92. doi: 10.1016/j.canep.2013.12.005. [DOI] [PubMed] [Google Scholar]
- 21.Godlewski J, Nowicki MO, Bronisz A, Nuovo G, Palatini J, De Lay M, Van Brocklyn J, Ostrowski MC, Chiocca EA, Lawler SE. MicroRNA-451 regulates LKB1/AMPK signaling and allows adaptation to metabolic stress in glioma cells. Mol Cell. 2010;37:620–632. doi: 10.1016/j.molcel.2010.02.018. [DOI] [PMC free article] [PubMed] [Google Scholar]
- 22.Azab AK, Azab F, Blotta S, Pitsillides CM, Thompson B, Runnels JM, Roccaro AM, Ngo HT, Melhem MR, Sacco A, et al. RhoA and Rac1 GTPases play major and differential roles in stromal cell-derived factor-1-induced cell adhesion and chemo-taxis in multiple myeloma. Blood. 2009;114:619–629. doi: 10.1182/blood-2009-01-199281. [DOI] [PMC free article] [PubMed] [Google Scholar]
- 23.Giese A, Loo MA, Tran N, Haskett D, Coons SW, Berens ME. Dichotomy of astrocytoma migration and proliferation. Int J Cancer. 1996;67:275–282. doi: 10.1002/(SICI)1097-0215(19960717)67:2<275::AID-IJC20>3.0.CO;2-9. [DOI] [PubMed] [Google Scholar]
- 24.Tamaki M, McDonald W, Amberger VR, Moore E, Del Maestro RF. Implantation of C6 astrocytoma spheroid into collagen type I gels: Invasive, proliferative, and enzymatic char-acterizations. J Neurosurg. 1997;87:602–609. doi: 10.3171/jns.1997.87.4.0602. [DOI] [PubMed] [Google Scholar]
- 25.Yu SP, Yang XJ, Zhang B, Ming HL, Chen C, Ren BC, Liu ZF, Liu B. Enhanced invasion in vitro and the distribution patterns in vivo of CD133+ glioma stem cells. Chin Med J (Engl) 2011;124:2599–2604. [PubMed] [Google Scholar]
- 26.de Groot JF, Fuller G, Kumar AJ, Piao Y, Eterovic K, Ji Y, Conrad CA. Tumor invasion after treatment of glioblastoma with bevacizumab: Radiographic and pathologic correlation in humans and mice. Neuro Oncol. 2010;12:233–242. doi: 10.1093/neuonc/nop027. [DOI] [PMC free article] [PubMed] [Google Scholar]
- 27.Hardie DG. AMP-activated/SNF1 protein kinases: Conserved guardians of cellular energy. Nat Rev Mol Cell Biol. 2007;8:774–785. doi: 10.1038/nrm2249. [DOI] [PubMed] [Google Scholar]
- 28.Hardie DG, Carling D. The AMP-activated protein kinase: Fuel gauge of the mammalian cell? Eur J Biochem. 1997;246:259–273. doi: 10.1111/j.1432-1033.1997.00259.x. [DOI] [PubMed] [Google Scholar]
- 29.Hardie DG, Scott JW, Pan DA, Hudson ER. Management of cellular energy by the AMP-activated protein kinase system. FEBS Lett. 2003;546:113–120. doi: 10.1016/S0014-5793(03)00560-X. [DOI] [PubMed] [Google Scholar]
- 30.Carling D. The AMP-activated protein kinase cascade - a unifying system for energy control. Trends Biochem Sci. 2004;29:18–24. doi: 10.1016/j.tibs.2003.11.005. [DOI] [PubMed] [Google Scholar]
- 31.Hardie DG. The AMP-activated protein kinase pathway - new players upstream and downstream. J Cell Sci. 2004;117:5479–5487. doi: 10.1242/jcs.01540. [DOI] [PubMed] [Google Scholar]
- 32.Kahn BB, Alquier T, Carling D, Hardie DG. AMP-activated protein kinase: Ancient energy gauge provides clues to modern understanding of metabolism. Cell Metab. 2005;1:15–25. doi: 10.1016/j.cmet.2004.12.003. [DOI] [PubMed] [Google Scholar]
- 33.Hawley SA, Pan DA, Mustard KJ, Ross L, Bain J, Edelman AM, Frenguelli BG, Hardie DG. Calmodulin-dependent protein kinase kinase-beta is an alternative upstream kinase for AMP-activated protein kinase. Cell Metab. 2005;2:9–19. doi: 10.1016/j.cmet.2005.05.009. [DOI] [PubMed] [Google Scholar]
- 34.Hurley RL, Anderson KA, Franzone JM, Kemp BE, Means AR, Witters LA. The Ca2+/calmodulin-dependent protein kinase kinases are AMP-activated protein kinase kinases. J Biol Chem. 2005;280:29060–29066. doi: 10.1074/jbc.M503824200. [DOI] [PubMed] [Google Scholar]
- 35.Woods A, Dickerson K, Heath R, Hong SP, Momcilovic M, Johnstone SR, Carlson M, Carling D. Ca2+/calmodulin-dependent protein kinase kinase-beta acts upstream of AMP-activated protein kinase in mammalian cells. Cell Metab. 2005;2:21–33. doi: 10.1016/j.cmet.2005.06.005. [DOI] [PubMed] [Google Scholar]
- 36.Fan QW, Cheng C, Knight ZA, Haas-Kogan D, Stokoe D, James CD, McCormick F, Shokat KM, Weiss WA. EGFR signals to mTOR through PKC and independently of Akt in glioma. Sci Signal. 2009;2:ra4. doi: 10.1126/scisignal.2000014. [DOI] [PMC free article] [PubMed] [Google Scholar]
- 37.Horwitz AR, Parsons JT. Cell migration: 'movin' on. Science. 1999;286:1102–1103. doi: 10.1126/science.286.5442.1102. [DOI] [PubMed] [Google Scholar]
- 38.Forget MA, Desrosiers RR, Gingras D, Béliveau R. Phosphorylation states of Cdc42 and RhoA regulate their interactions with Rho GDP dissociation inhibitor and their extraction from biological membranes. Biochem J. 2002;361:243–254. doi: 10.1042/bj3610243. [DOI] [PMC free article] [PubMed] [Google Scholar]
- 39.Zhang B, Sun J, Yu SP, Chen C, Liu B, Liu ZF, Ren BC, Ming HL, Yang XJ. Rac1 cells distributed in accordance with CD 133 cells in glioblastomas and the elevated invasiveness of CD 133 glioma cells with higher Rac1 activity. Chin Med J. 2012;125:4344–4348. [PubMed] [Google Scholar]