Abstract
Cytology of sparingly available cell samples from both clinical and experimental settings would benefit from high-selectivity protein tools. To minimize cell handling losses in sparse samples, we design a multi-stage assay using a lab-on-a-disc that integrates cell handling and subsequent single-cell western blotting (scWestern). As the two-layer microfluidic device rotates, the induced centrifugal force directs dissociated cells to dams, which in turn localize the cells over microwells. Gravity-based sedimentation then settles the cells down into the microwells, where the cells are lysed and subjected to scWestern. Taking into account cell losses from capillary loading, centrifugation, and lysis-buffer exchange, our lab-on-a-disc device handles cell samples with as few as 200 cells with 75% cell settling efficiencies. Over 70% of microwells contain single cells after the centrifugation. In addition to cell settling efficiency, cell-size filtration from a mixed population of two cell lines is also realized by tuning the cell flight-of-time during centrifugation (58.4% settling efficiency with 6.4% impurity). Following the upstream cell handling, subsequent scWestern is demonstrated by detection of four proteins (GFP, β-TUB, GAPDH, and STAT3) in a glioblastoma cell line. By integrating the lab-on-a-disc cell preparation and scWestern analysis, our platform measures proteins from sparse cell samples at a single-cell resolution.
TOC image
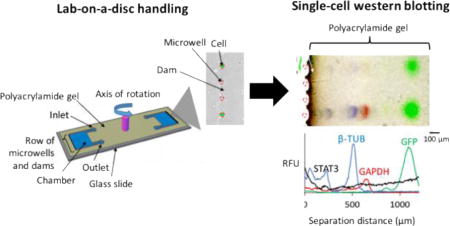
We demonstrate a lab-on-a-disc western blotting device that integrates sparse cell handling (< 200) and single-cell protein analysis.
Introduction
Immunocytochemistry (ICC) and immunohistochemistry (IHC) are workhorse immunoassays routinely employed for assessing cancer grade from biopsy samples. Single-cell resolution is important, as the degree of cellular heterogeneity can provide insight into cancer diagnosis,1–3 prognosis,4 and the selection of therapeutic regime.5–7 Yet, in these cytology assays, multiplexing is constrained to a sub-set of 4–5 protein targets per cell.8 Selectivity is limited by unavailable immunoreagents and poor immunoreagent performance, which can yield substantial off-target and background signals.9, 10 Deep profiling of protein-mediated signalling would complement conventional clinical protein assays as well as supplement single-cell resolution genomics and transcriptomics.
In contrast to immunoassays (i.e., single-stage protein assays), multi-stage protein assays enhance selectivity by prepending a protein sizing (electrophoresis) stage to the downstream immunoassay stage. These so-called immunoblots report both protein molecular mass and immunoreactivity, thus offering more comprehensive information on both the targets and any confounding signals. While providing powerful analytical specificity, contemporary slab-gel western blotting requires pooling of cells to achieve sufficient analytical sensitivity.11 Slab-gel western blotting typically requires 105 – 106 cells, thus making the assay ill-suited for analysis of small volume biopsies. More broadly, the pooling of cell populations obscures cell-to-cell variation in protein expression. To overcome this limitation, our recent studies report microfluidic single-cell western blotting (scWestern).12–15 While promising, the analytical module has not yet been integrated with an upstream cell handling module suitable for preparation of dissociated tumour cells, as is needed for clinical impact.
That said, downstream cellular analyses have been successfully integrated with upstream cell preparation using microfluidic design. In one class of microfluidic cell preparation tools, a pressure-driven flow directed cell suspensions through microscale features (dams) that passively trapped (immobilized) individual cells for subsequent in-situ enzymatic activity assays.16, 17 In order to yield 200 immobilized single cells, starting populations of 300,000 cells (100 μL of ~3 × 10⁶ cells/mL) were required due to 50% trapping single-cell efficiencies.16
Another class of cell handling tools utilized applied fields and field gradients. In one example, local magnetic fields enriched antibody-functionalized magnetic beads, which isolated cells expressing specific surface receptor proteins from suspension.18 Dependent on antibody specificity and sensitivity, this bulk process of cell capture usually required > 1 × 10⁶ cells.18, 19 While useful for enrichment, antibody binding could alter cellular gene expression.20 In a label-free variant, dielectrophoretic (DEP) forces, created by non-uniform electric fields based on dielectric properties, finely controlled the spatial location of individual cells.21–23 Embedded electrodes and low conductivity buffers limited the damage to cell membranes or DNA.24–26 Light has also been used to tune conductivity, thus generating local electric field gradients useful for non-contact manipulation of cells.21 However, before DEP, cell losses due to dead volumes and a driving pressure-driven flow were substantial.22, 23 Despite a slow flow rate (10 μL/min), high cell concentrations (5 × 10⁵ – 1 × 10⁶ cells/mL) were needed to settle hundreds of cells for viability testing and immunostaining.22, 23, 27 Overall, existing single-cell protein assays, which apply hydrodynamic or external-field techniques, require at least 1000 cells as a starting number of cells.15, 28–30
Owing to our interest in robust integration of sparse cell handling and subsequent scWestern analysis, we explore centrifugation for cell preparation. So-called lab-on-a-disc tools readily maneuver sparse cell samples with < 10% cell handling losses.31, 32 The centrifugal force is nearly independent of buffer properties and compatible with subsequent electrophoretic analysis of cells from samples.31, 33, 34 With minimal usage of cell sample and reagents, we developed a low-loss and rapid lab-on-a-disc device that measures proteins from single cells. Here, we report on the design, demonstration, and characterization of a centrifugal cell preparation module to direct cells from sparse starting cell populations to single-cell occupancy of microwells for subsequent scWestern.
Materials and methods
SU-8 soft lithography
A two-layer polyacrylamide gel was polymerized against a silicon wafer with SU-8 features. The bottom layer of the gel houses chamber walls and dams, and the top layer houses microwell pillars. A mechanical grade silicon wafer (University Wafers) was pre-treated with isopropanol and acetone to clean the wafer surface. An 80-μm SU-8 3050 (Y311075; MicroChem) layer was coated by spinning at 1750 RPM for 30 s and soft baked at 95 °C for 30 min. To create an SU-8 mold of the chambers, the wafer was exposed to UV (Model 200IR, OAI) at 40 mW/cm2 for 6 s through a Mylar mask (CAD/Art Services), which has a transparent area with the chamber design. After a post-exposure baking at 65 °C for 1 min and 95 °C for 5 min, another layer of 40-μm SU-8 3050 was spin-coated at 4000 RPM for 30 s on top of the previous SU-8 layer to make microwell posts. Then, the wafer was soft baked at 95 °C for 15 min, and exposed to UV (40 mW/cm2, 5 s) under another Mylar mask with the microwell design. Followed by post-exposure baking (65 °C for 1 min, 95 °C for 5 min), the wafer was submerged in SU-8 developer (Y020100; Microchem) and rinsed with 2-propanol. In the end, the wafer was composed of an 80-μm bottom layer with chamber posts and a 40-μm top layer with microwell post. Before casting a polyacrylamide gel, the wafer was coated with 100 μL hydrophobic dichlorodimethylsilane (DCMC, 440272; Sigma-Aldrich) via vapor-deposition for 40 min under vacuum. The SU-8 mold’s thickness was measured by using a surface profiler (Sloan Dektak 3030) with a 0.10 mN stylus force.
Device materials and fabrication
Two chambers with microwells and dams were fabricated on a standard microscope glass slide by casting a polyacrylamide gel against the wafer with SU-8 features. The final gel with 8 %T and 2.7 %C was chemically polymerized from a stock 30 %T, 2.7 %C acrylamide/bis-acrylamide solution (A3699; Sigma) with a 3 mM N-[3-[(3-Benzoylphenyl)formamido]propyl] methacrylamide (BPMAC, custom synthesized by PharmAgra Laboratories) and 75 mM Tris HCl pH 8.8 (T1588; Teknova). Ammonium persulfate (A3678; Sigma) and TEMED (T9281; Sigma) were used as reagents for chemical polymerization. The dried gel’s thickness was measured by using Sloan Dektak 3030. To hold the cell suspension inside each chamber during centrifugation, a polyester film (GelBond®; Lonza) was used as a lid (Fig. S1†). Holes were punched in the lid using a Herm Sprenger Revolving Hole Punch (#10809). A liquid superglue (Loctite) was applied along the edges between the glass slide and the lid to act as a seal.
Cell line/microbead preparation
A U251 glioblastoma cell line with stable expression of turboGFP (U251-GFP) was kindly provided by Prof. S. Kumar’s Laboratory at the University of California, Berkeley. The U251-GFP cells were cultured in high glucose Dulbecco’s Modified Eagle Medium (11965; Life Technologies), supplemented with 10% of fetal bovine serum (JR Scientific), 1% penicillin/streptomycin (15140122; Invitrogen), 1 mM sodium pyruvate (11360–070; Life Technologies), and 1× MEM nonessential amino acids (11140050; Life Technologies). The cell line was incubated at 37°C with 5% CO2. For cell detachment from a tissue-culture flask, U251-GFP cells were incubated with 0.05% trypsin-EDTA (400–150; Gemini) at 37°C for 5 min. Detached cells were counted with a hemocytometer and diluted accordingly with ice-cold 1× PBS. For cell-viability testing, 1 mg/mL propidium iodide (P1304MP) was diluted 1:100 with cells in 1× PBS.
The SEM cell line, a B cell precursor leukemia, was generously received from Prof. R. Stam’s Laboratory at the Erasmus University Rotterdam via Deutsche Sammlung von Mikroorganismen und Zellkulturen GmbH (DSMZ). The SEM cells were cultured in RPMI 1640 medium (11875093; ThermoFisher Scientific) with 10% fetal bovine serum (JR Scientific) and 1% penicillin/streptomycin (15140122; Invitrogen). The SEM cell line was maintained in a humidified 37 °C incubator with 5% CO2. For nucleic acid staining, SEM cells were incubated with 1 μg/mL Hoechst 33342 (H3570; ThermoFisher Scientific) for 10 min. The excess stain was removed by centrifuging the cells at 450 ×g for 5 min and aspirating the supernatant. FITC-labeled, 15-μm diameter polystyrene microbeads (F21010; Invitrogen) were used to measure particle drift velocities at different rotational speeds. Before introducing into the lab-on-a-disc device, microbeads were diluted in 1× PBS and vortexed thoroughly.
Cell loading simulation
We simulated the cell loading in a 2D environment using COMSOL Multiphysics version 5.0 (COMSOL Inc.). The device geometry was drawn in AutoCAD (Autodesk, Inc.) and exported to COMSOL. Laminar flow and particle tracing fluid flow physics modules were used. In the fluid flow physics module, material properties of water (density ρ of 0.995 g/ml, dynamic viscosity μ of 8.90 × 10⁻⁴ Pa s), no-slip wall boundary conditions, and an average inlet velocity of 0.006 m/s were implemented. In the particle tracing module, one hundred 30-μm particles with a density of 1.050 g/ml were added with a drag force. The drag force was calculated from the fluid flow physics module.
scWestern
Microwells were spaced 160 μm apart and configured with the 1.5 mm gel for scWestern. The microwell post area was increased from 700 μm2 to 3100 μm2, while maintaining the post height at 40 μm. Also, the microwells were modified from a circular to trapezoidal geometry to increase the microwell area.
After centrifugation, the polyester lid was removed. The device was cut in half for concurrent chemical lysis and electrophoresis in scWestern. To dice the slide in half, we used a laser cutter (H-Series Desktop CO2 Laser, Full Spectrum Laser). 1% SDS (L3771; Sigma), 0.1% v/v Triton X-100 (X100; Sigma), 0.25% sodium deoxycholate (D6750; Sigma), 12.5 mM Tris, and 96 mM glycine (161–0734; Bio-Rad) were combined to make a Radioimmunoprecipitation-like (RIPA-like) buffer. 10 mL of the RIPA-like buffer was slowly poured over the device for 25 s. Then, an electrical field of 40 V/cm was applied across the slide to electrophorese proteins for 25 s. Immediately after the protein electrophoresis, we exposed the slide to UV at 100% power for 45 s (Lightningcure LC5; Hamamatsu) to immobilize proteins. The slide was washed with 1× TBS with Tween 20 (TBST, 77500; Affymetrix) before antibody probing. Primary and secondary antibodies were diluted with 1× TBST with 2% BSA. At room temperature, 0.1 g/L of primary antibodies and 0.05 g/L of secondary antibodies were used to probe the slide for 2 h. Between and after each probing step, 1× TBST was used as a washing buffer. Then, the slide was dried and imaged under a fluorescence microarray scanner (4300A; Genepix). A half-slide seats stably on the four-pin mount located in the sample chamber of the imaging instrument. For Genepix laser settings, PMT gain was set at 500, power at 50%, and focus position at 10 μm for all fluorescence channels. The slide was held in place by four prongs inside Genepix. Primary GAPDH, β-Tubulin, turboGFP, STAT3, and H3K79me2 antibodies were purchased from Sigma (SAB2500450), Abcam (ab6046), Pierce (PA5–22688), Cell Signalling (9139), and Abcam (ab3594), respectively. Anti-goat antibody with Alexa Fluor 555 (A-21432; ThermoFisher), anti-mouse antibody with Alexa Fluor 594 (A-11032), and anti-rabbit antibody conjugated with Alexa Fluor 647 (A-21245) were used as secondary antibodies.
Image acquisition
An inverted microscope (Olympus IX71) equipped with a motorized stage (MS-2000; Applied Scientific Instrumentation) and an X-cite mercury light lamp source (Lumen Dynamic) imaged cells. 10×-objective brightfield and fluorescence images were taken with the iXon+ EMCCD camera (Andor Technology Ltd.) and stitched together with Metamorph software (Molecular Devices). Standard FITC/GFP and DAPI filter cubes were used to detect U251-GFP and DAPI-stained SEM cells, respectively.
Image analysis and quantitation
All images were analysed by ImageJ 1.49v (NIH). Cell diameters were estimated by adjusting image threshold and using the built-in ImageJ particle analyser command. In scWestern, protein peaks were quantified by performing Gaussian fitting with an R-squared value > 0.7. Fluorescence intensity was obtained by summing the area under curve (AUC). The AUC and separation resolution were calculated by using our in-house MATLAB (R2015b) code.15 Statistical analyses were performed using EXCEL and existing MATLAB functions.
Results and discussion
Integrating centrifugal cell handling with scWestern analysis
We designed a microfluidic lab-on-a-disc device that integrates our previously reported scWestern with a new bulk approach to handle sparse, heterogeneous cell samples (Fig. 1A). Minimal cell loss during device operation and analysis of the sparse starting populations of cells. The analytical module comprises an array of microwells directly molded into a photo-active polyacrylamide gel layered onto a glass microscope slide. The scWestern blot isolates a single cell in a microwell, chemically lyses in-situ, and injects the lysate electrophoretically through the microwell walls and into the molecular sieving matrix (Fig. 1B, Fig. S2†). After the completion of electrophoresis, the proteins are covalently immobilized onto the hydrogel (photo-immobilization) and probed with a series of antibodies to report protein target identity.
Fig. 1.
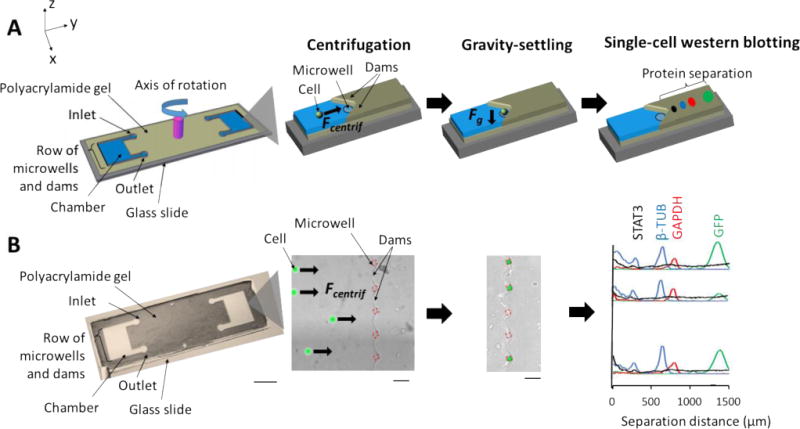
Lab-on-a-disc couples the handling of sparse cell samples with single-cell western blotting (scWestern). The microfluidic design (A) and device (B) consists of two chambers with dams and arrays of microwells that are built by patterning a polyacrylamide gel on a microscope glass slide, sandwiched with a polyester lid. After an injection of 1 – 20 μL of cells via an inlet, the device is centrifuged on an upright spinner. In a rotation frame of reference, the centrifugal force leads to migration of the cells towards the microwells. Subsequently, gravity sediments the cells into the microwells. Finally, the patterned polyacrylamide gel with single cells is used as a medium for scWestern. Scale bar left, 1 cm. Scale bars middle and right, 100 μm.
The integrated cell handling module consists of two chambers, flanked by an array of 100 microwells, with an inlet at the axis of rotation (Fig. 1A). As described, the microwells isolate cells for subsequent scWestern. To localize cells to the microwells, we use a two-layer polyacrylamide gel with microwells molded into the bottom layer and U-shaped “cell trapping” dams located above and around each microwell. Cell trapping dams have been used to physically trap single cells under a pressure-driven flow or centrifugation.16, 17 Here, we develop a two-layer fabrication process using the same hydrogel material that is used for the electrophoresis and immunoprobing steps of the scWestern (Fig. S2†). Then, the lab-on-a-disc device is placed in the spin coater (SoftLithoBox®; Elveflow) for centrifugation. Once centrifugation drives cells into the U-shaped dams on the periphery of the fluidic chamber, each cell then gravity settles into the microwell directly below. To create fully enclosed fluidic chambers, the device is capped with a layer of transparent polyester film (GelBond®). Once cells are seated in the microwells, this lid layer is removed, and the lysis buffer is applied to initiate the analytical stage of the assay (Fig. 1, Fig. S2†).
Characterization of a lab-on-a-disc design for cell handling
By using a lab-on-a-disc approach to localize cells to the microwells flanking the fluidic chambers, we sought to understand three operational aspects of the device and centrifugation scheme: (i) cell drift velocities across the fluidic chambers, (ii) suitable centrifugation forces for moving cells to the microwell array, and (iii) final uniformity of the cell distribution along the linear microwell array.
First, we estimate the drag force expected on a cell migrating in the fluidic chamber under centrifugation. With our device design and a rotational velocity of a 5000 RPM (980 ×g), the Reynolds number is << 1, so Stokes’ Law is applied. Although cells do not reach terminal velocities during centrifugation, the radial drift velocity across the chamber is relatively constant and allowed estimates of suitable operating conditions. We calculate and also measure the drift velocities of FITC-labelled polystyrene microbeads (15 μm, 1.06 g/cm3) under various RPMs and found appreciable agreement between theory and experiment (Fig. 2A).
Fig. 2.
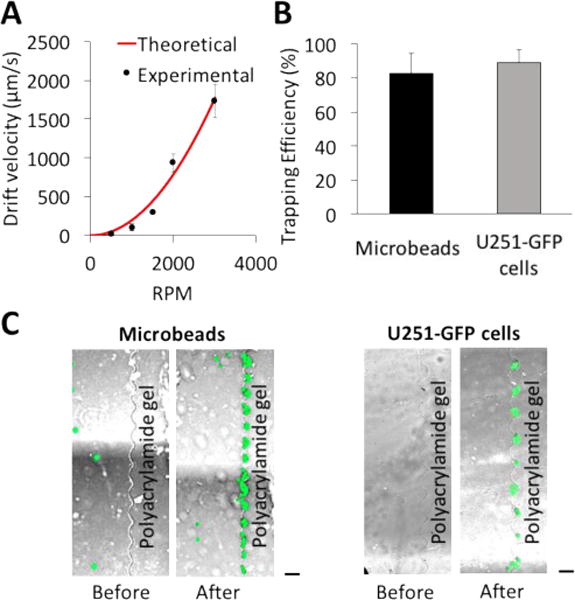
Characterization of particle drift velocities as a function of rotational velocity. (A) A plot of theoretical and experimental drift velocities. Based on forces acting on a 15-μm, FITC microbead in a rotational reference frame, drift velocities are calculated to estimate particle velocity. By injecting 3~5 microbeads into the device, microbeads are imaged before and after centrifugation to measure distance and calculate velocities. Theoretical and experimental data follow a similar behavior. (B, C) Measurement of trapping efficiencies and false-color epifluorescence micrographs of microbeads and U251-GFP cells. Centrifugal effect is tested by using FITC microbeads and a U251-GFP cell line. Rotating at 2000 RPM for 2 min, more than 80% of microbeads and U251-GFP cells migrate to microwells. Scale bars, 100 μm.
Second, we investigate suitable centrifugal conditions for directing mammalian cells to microwells. After 2 min of operation at 2000 RPM (157 ×g), 82% of the 15-μm polystyrene microbeads (n = 3 chambers) and 90% of human glioblastoma cells (U251-GFP, 30-μm diameter, n = 5 chambers) are localized to the microwell array (Fig. 2B, C). Under higher rotational speeds, we observe appreciable cell lysis (e.g., 3000 RPM; 353 ×g; 4.15 nN of centrifugal force; Fig. S3†). Cell lysis under these conditions might be attributable to shear forces, as notable cell lysis had been observed under ~1.4 nN of shear force.35 Cells may be more susceptible to lysis by shear forces than by compressive forces.35, 36 We further investigated cell viability under the suitable 2000 RPM conditions and observed no dead cells by propidium iodide (PI) stain (Fig. S3†) as well as no visible changes in cell morphology after centrifugation.
Third, we sought to numerically and empirically assess the cell distribution in the fluidic chamber. In a first aspect, we consider a system where capillary flow is utilized for sample introduction into the fluidic chamber. Through the inlet, we applied a microbead suspension (1 – 20 μL of 1× PBS solution) and generated a capillary force by applying a task wipe at the chamber outlet for 1 s (Fig. 3). Both the COMSOL® simulation and empirical results for 15-μm microbeads demonstrated capillary flow as a feasible and passive means to introduce cells across the chamber width (Fig. 3A). In the experimental study, we observed a similar distribution of cells except with a higher concentration of microbeads near the top wall of the chamber, possibly due to a backflow generated by pressing the task wipe on the outlet port.
Fig. 3.
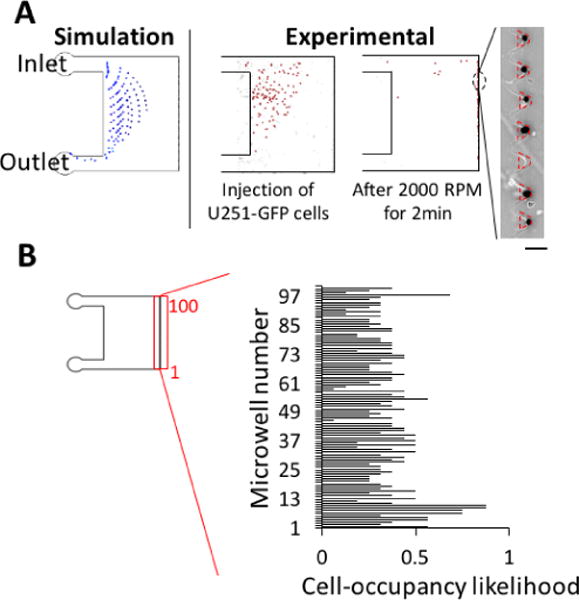
Cell loading by capillary force results in a uniform cell distribution across the array of microwells. (A) False-color epifluorescence micrographs of U251-GFP cells during cell loading. Particle tracing simulations show capillary force-based introduction of cells into the fluidic chamber results in uniformly dispersed cells, corroborating empirical results. (B) A plot of cell-occupancy likelihood across the array of microwells. After cell loading, centrifugation is applied for 2 min at 2000 RPM. In 8 replicates with 569 cells, cell-occupancy likelihood is calculated for each microwell. Based on Pearson’s chi-squared statistic test, the distribution of cells settled into the microwells does not differ from the anticipated distribution of cells settled randomly without any bias (95% CI). Scale bar, 100 μm.
In a second aspect, after loading and centrifuging the cells (2 min, 2000 RPM), we assessed the final distribution of cells across the flanking microwell array. We determined that glioblastoma cells (U251-GFP) settled uniformly across the length of the linear microwell array (Pearson’s chi-squared statistic test; 8 devices, 569 cells; Fig. 3B). A cell-occupancy likelihood is calculated by enumerating cells in each microwell via microscopy, across 8 replicate runs. For a uniform distribution with 569 cells, the expected value for cell-occupancy likelihood for each microwell is 5.69. The chi-squared value, calculated here from 8 devices, is 95.5 which is less than the critical value 120. The analysis suggests that no significant difference exists between the experimental data and a random distribution of cells (95% CI).
Analysis of single-cell settling and cell losses in lab-on-a-disc cell handling
For scWestern, the cell occupancy of each microwell (i.e., number of cells seated in each microwell) has to be one. To characterize the effectiveness of the lab-on-a-disc design for manipulating – and then analysing – individual cells, we first assessed the number of microwells containing individual cells at the end of the preparatory stage. After applying 100 U251-GFP cells and completing the centrifugation based handling (2 min, 2000 RPM), we observed 84% of trapezoidal microwells (n = 8 devices) contained single cells after centrifugation (Fig. 4A, Fig. S4†). When microwell occupancy exceeded unity, visual inspection suggested that cell clumping in the initial suspension was a factor.
Fig. 4.
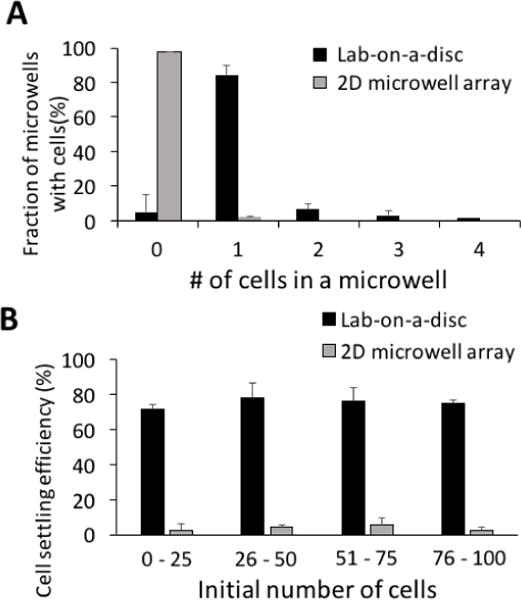
Lab-on-a-disc handling enhances single-cell microwell occupancy from sparse cell samples. (A) With less than 100 starting cells, over 80% of microwells are occupied with single cells in the lab-on-a-disc device, as compared to 3% of microwells in the 2D microwell array device with gravity settling.15, 37 (B) Over 70% of cells settled in microwells in the lab-on-a-disc device, while less than 5% in the 2D microwell device with passive-gravity settling (n = 4 devices for each case).
Next, cell losses during handling were characterized for biospecimens comprised of small numbers of cells. We assessed cell losses for starting populations at and then below 100 cells. To benchmark suitability of the lab-on-a-disc preparatory module, we compared cell losses with a gold-standard of passive-gravity sedimentation into a 2D array of microwells per our previous planar scWestern blot, which was not optimized for handling sparse cell suspensions.37 Benchmarking with a sample of sparse cells on the 2D microwell array yielded < 5% single-cell occupancy rate (20 μL of 100 U251-GFP cells; Fig. S5†), with the vast majority of microwells containing no cells. Cell losses exceeded 95% of the starting population owing to just 1.1% of the device surface area occupied by the microwells. Additionally, the 20-μl cell suspension was evaporated during the first 5 min of the 20-min duration allotted for cell sedimentation.
In contrast, using the integrated lab-on-a-disc cell handling and chamber-flanking microwell array, we observed > 70% of cells settled into microwells, even with the starting cell population below 100 cells (Fig. 4B, n = 4 devices for each case). Single-cell occupancy rates were in the 70% range. The 30% cell loss in our device originated from three processes: cell loading, centrifugation, and lid removal (Fig. 5). During the cell loading, 7.5% of the total number of cells remained at the cell loading areas (Fig. 5, n = 5 chambers). Pinched between the gel layer and the polyester lid, the cells were caught at the inlet and outlet boundaries during capillary loading and centrifugation (Fig. 5A). During centrifugation, 1.2% of the injected cells travelled to the side walls of the chambers, rather than being directed to microwells (Fig. 5A, n = 5 chambers). Lastly, the major cell loss took place during lid removal prior to the application of lysis buffer (Fig. 5B, n = 6 chambers). Despite dams localizing cells above microwells during centrifugation, cells that were not settled in microwells were washed away. The trapezoidal microwell geometry increases the chances that a cell will sediment into a microwell after being trapped at a dam feature. As compared to a circular microwell, the trapezoidal microwell enhances the dam proximal microwell area by conforming to the dam footprint more closely than is possible with a circular geometry. In comparison to circular microwells, the trapezoidal microwells reduced the cell loss from 44% to 17% (Fig. 5B).
Fig. 5.
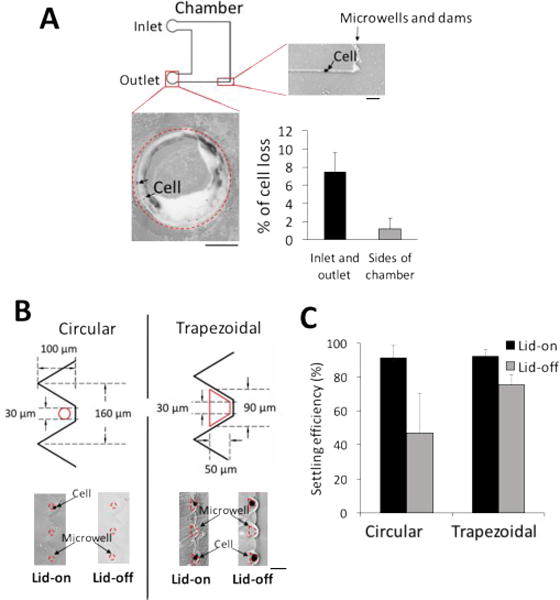
Cell losses are characterized during lab-on-a-disc handling and minimized by changing microwells from circular to trapezoidal. (A) Epifluorescence micrographs of U251-GFP cells in cell loading areas and side walls of the chamber. Cell losses are from (i) cell loading, where 7.5% of total cells are immobilized at the inlet and the outlet borders, (ii) centrifugation, in which 1.2% of the loaded cells migrate to side walls of the chambers (n = 5 chambers for each case). Scale bar bottom, 500 μm. Scale bar top right, 100 μm. (B) Epifluorescence micrographs of cells in microwells before and after lid removal. 44% of total cells are partially settled in circular microwells and subsequently dislodged during lid removal for buffer exchange (n = 6 chambers). Increasing the microwell area from 710 mm2 to 3200 mm2 and modifying to a trapezoidal shape reduce the cell loss to 16.9% of total cells (n = 6 chambers). (C) Overall, 47.2% and 75.2% of total cells are settled in circular and trapezoidal microwells before scWestern, respectively.
Having established the operational parameters for integrating the lab-on-a-disc preparatory module with the scWestern, we sought to explore a novel aspect of the device physics: to operate the centrifugal cell preparation module in a filtering-like mode based on differences in drift velocity. The time-of-flight to microwell varies among cells with different diameters because the drift velocity is proportional to the square of the cell diameter. To address this question, we considered a 3:1 mixed population comprised of two cell types: small DAPI-stained cells from a mouse leukocyte cell line (SEM, ~6 μm diameter; ρ = 1.1 g/mL38, 39) and large GFP cells from a glioblastoma cell line (U251-GFP, ~30 μm diameter, ρ = 1.05 g/mL38). The larger U251-GFP cells were anticipated to have a higher drift velocity than the SEM cells, giving the U251-GFP cells a shorter time-of-flight to the microwell array (Fig. 6A). Based on calculations with cell densities and diameters, we centrifuged our platform for 2 min at 1000 RPM to preferentially bias settling of the U251-GFP cells in the microwells, with smaller SEM cells confined closer to the fluid inlet (Fig. 6, Fig. S6†). With DAPI and GFP fluorescence channels, a visual inspection of microwells after the lid removal indicates that more than 60% of the shorter time-of-flight U251-GFP cells were settled in microwells, while < 5% of the longer time-of-flight SEM cells were settled into the microwells (Fig. 6B, n = 5 chambers). The scWestern reports that microwells housing U251-GFP cells are devoid of SEM cells (Fig. S7†).
Fig. 6.
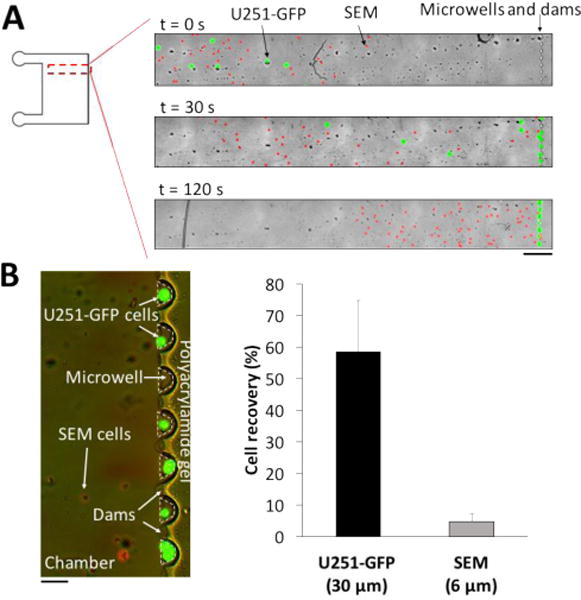
Size filtration of leukocyte (SEM) cells from glioblastoma (U251-GFP) by adjusting cell flight-of-time during centrifugation. About 400 SEM cells are spiked into a solution of 100 U251-GFP cells. (A) False-color epifluorescence micrographs of U251-GFP (green) and SEM (red) cells at different centrifugation time points. When the solution is loaded, both U251-GFP and SEM cells are located near each other in the chamber. Due to a size difference between U251-GFP and SEM cells, U251-GFP cells have a shorter time-of-flight to microwells than SEM cells during centrifugation. At 1000 RPM for 30 s, more than 30% of U251-GFP cells are already placed in microwells. After centrifuging for 1 min at 1000 RPM, a majority of U251-GFP cells are in microwells, while a majority of SEM cells do not reach microwells. Scale bar, 500 μm. (B) After centrifuging for 2 min at 1000 RPM, 58.4% of U251-GFP cells (n = 5, green) are selectively settled in microwells, while 6.4% of SEM cells (n = 5, blue, nucleus stained) are absent in microwells. Scale bar, 100 μm.
Multiplexed protein analysis from sparse cell samples
Lastly, we applied the integrated preparatory and scWestern modules to multiplexed analysis of the proteins GFP (27 kDa), GAPDH (37 kDa), β-tub (51 kDa), STAT3 (85 kDa) from individual glioblastoma (U251-GFP) cells (Fig. 7). STAT3 is a transcription factor important in cell proliferation and tumor survival in glioblastoma.40–42 The total duration for cell handling was 2 min, with a total cell loss estimated at 25.3%. Seated U251-GFP cells had a mean diameter of 27.97 μm with a 9.2 μm range (IQR) (Fig. 7A). The sparse starting sample consisted of 24 cells per a 15 μL suspension. Due to a poor sensitivity of total protein staining (> 1 ng),43, 44 separation resolutions are calculated by analyzing fluorescence peaks of STAT3, GAPDH, β-TUB, and GFP. Across 14 cells, the 1.5-mm long protein separation axis resolved all proteins with separation resolution exceeding baseline resolution (Fig. 7B, Tab. S1†). Within the same device, other proteins of interest (up to ~11 targets) can be detected by chemically stripping the gel and reprobing.14, 15
Fig. 7.
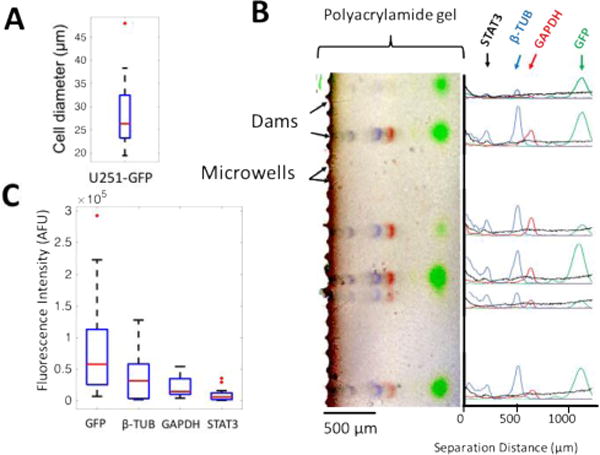
Lab-on-a-disc scWestern analysis of 14 single cells from a sparse, 24-cell biospecimens. (A) A box-and-whisker plot of cell-size distribution of U251-GFP cells settled in microwells. (B) A false-color overlay of fluorescence micrographs from GFP (green), β-TUB (blue), GADPH (red), STAT3 (black) proteins with fluorescence intensity profile plots. (C) Box-and-whisker plots of STAT3, GFP, β-TUB, and GAPDH distributions are obtained from an area-under-the-curve analysis. Box ends represent 25th and 75th percentiles; IQR is the difference between the 25th and 75th percentiles; median value is the red line at box middle; whiskers spread to 95% confidence limits; and red dots indicate outliers.
To analyze protein distributions, fluorescence peak intensities (AUC) with a > 3 signal-to-noise ratio were measured after background subtraction (Fig. 7C). Compared with the planar 2D-array scWestern blot,37 mean peak intensities of GFP, GAPDH, and β-TUB in our lab-on-a-disc device had no significance difference (Fig. 7C, Fig. S8†). Based on a lower limit of detection (LOD) reported from the 2D-array scWestern blot, the lab-on-a-disc is estimated to have LOD of 45 zeptomoles (27,000 molecules). In the lab-on-a-disc device, a non-uniform background fluorescence signal was observed near microwells (Fig. 7B). Gel thickness measurements suggest that a thicker gel region exists near the microwells (as compared to in the separation axis). We hypothesize that this thicker gel leads to preferential trapping of fluorescently labeled antibody probes near the microwells during immunoblotting (Fig. S9†). We are exploring design modifications to reduce gel thickness non-uniformity in this region. Nevertheless, the assay described here provides an analytical sensitivity suitable for an estimated >50% of the mammalian proteome, with the LOD sufficiently sensitive for a median protein abundance of 27,000 molecules per cell.15, 45 MAPK/ERK and apoptosis pathway proteins have been detected using a scWestern conducted using a planar 2D microwell array form factor.14, 37
Conclusions
We report on a multi-step yet integrated assay designed to extend high-specificity protein cytometry to low density (sparse) cell suspensions including dissociated biopsies. Based on operation with workhorse centrifuges, we designed a lab-on-a-disc device that integrates low loss cell handling with subsequent single-cell western blotting. Key design contributions include development of a two-layer soft lithography process for molding of polyacrylamide gel, the molecular sieving matrix required for protein electrophoresis. After characterizing device and assay operation by identifying suitable operational parameters for sparse cell handling and analysis, we utilized the underlying physics of device operation to demonstrate a ‘long-pass’ filtering mode operation, wherein large cells are preferentially seated into a linear microwell array for subsequent analysis. We view this fractionation based on cell size as having tremendous potential for robust cytology on heterogeneous dissociated cell populations including from clinical tissues.
To advance non-invasive and cost-effective cancer monitoring efforts, new approaches for preparing and interpreting sparse cell samples could complement existing measurements. Automated and rapid analysis of sparingly available cell samples from blood or bodily fluids will improve diagnosis and prognosis of cancer.46, 47 Especially in low-resource settings, a dearth of on-site cytotechnicians and cytopathologists has been reported to delay cell preparation and tumor grading for months after fine-needle biopsy collection in developing countries.47, 48 Robust, integrated tools could pave the way for the digital transmission of cytology imaging data from distributed settings to well-resourced clinical centers, which could be a step towards alleviating cytopathology bottlenecks already prevalent in less-resourced settings.47, 49, 50
In fact, surgical biopsies are not always offered in low-resource settings; instead, the less-invasive and less-intensive FNAB is utilized.47, 48 Nevertheless, a dearth of on-site cytotechnicians and cytopathologists has been reported to delay cell preparation and tumor grading for months after FNAB collection. Robust, integrated tools could also pave the way for the digital transmission of cytology imaging data from distributed settings47, 48 to well-resourced clinical centers, which could be a step towards alleviating cytopathology bottlenecks already prevalent in less-resourced settings.47, 49, 50
Supplementary Material
Acknowledgments
We gratefully thank members of the Herr laboratory at UC Berkeley for assistance and discussion. We acknowledge financial support from NIH Training Grant for University of California Berkeley and San Francisco, the National Institute of Biomedical Imaging and Bioengineering (NIBIB) of the National Institutes of Health (NIH) under Award Number U54EB015403. This work is also supported by a National Science Foundation (NSF) CAREER award (CBET-1056035 to A.E.H). J.J.K. is supported by a US NSF Graduate Research Fellowship and the Kang Family Graduate Fellowship for Biotechnology.
Footnotes
Electronic Supplementary Information (ESI) available: Fig. S1 illustrates assembly parts of the lab-on-a-disc device in 3D schematic drawing. Fig. S2 describes a schematic workflow of the lab-on-a-disc device. Fig. S3 shows the effect of centrifugation on cells. Fig. S4 displays the cell occupancy in microwells. Fig. S5 cell settling efficiency of the 2D microwell-array scWestern device with gravity settling. Fig. S6 explicates calculation of cell flight-of-time. Fig. S7 shows GFP and H3K79me2 protein peaks from U251-GFP and SEM cells. Fig. S8 compares protein amounts between lab-on-a-disc and 2D microwell-array scWestern devices. Fig. S9 demonstrates thickness profiles of the dried gel and the SU-8 mold. Tab. S1 lists separation resolutions of protein peaks.
Notes and references
- 1.Navin N, Kendall J, Troge J, Andrews P, Rodgers L, McIndoo J, Cook K, Stepansky A, Levy D, Esposito D, Muthuswamy L, Krasnitz A, McCombie WR, Hicks J, Wigler M. Nature. 2011;472:90–94. doi: 10.1038/nature09807. [DOI] [PMC free article] [PubMed] [Google Scholar]
- 2.Lohr JG, Adalsteinsson VA, Cibulskis K, Choudhury AD, Rosenberg M, Cruz-Gordillo P, Francis JM, Zhang CZ, Shalek AK, Satija R, Trombetta JJ, Lu D, Tallapragada N, Tahirova N, Kim S, Blumenstiel B, Sougnez C, Lowe A, Wong B, Auclair D, Van Allen EM, Nakabayashi M, Lis RT, Lee GS, Li T, Chabot MS, Ly A, Taplin ME, Clancy TE, Loda M, Regev A, Meyerson M, Hahn WC, Kantoff PW, Golub TR, Getz G, Boehm JS, Love JC. Nature biotechnology. 2014;32:479–484. doi: 10.1038/nbt.2892. [DOI] [PMC free article] [PubMed] [Google Scholar]
- 3.Ma C, Cheung AF, Chodon T, Koya RC, Wu Z, Ng C, Avramis E, Cochran AJ, Witte ON, Baltimore D, Chmielowski B, Economou JS, Comin-Anduix B, Ribas A, Heath JR. Cancer discovery. 2013;3:418–429. doi: 10.1158/2159-8290.CD-12-0383. [DOI] [PMC free article] [PubMed] [Google Scholar]
- 4.Patel AP, Tirosh I, Trombetta JJ, Shalek AK, Gillespie SM, Wakimoto H, Cahill DP, Nahed BV, Curry WT, Martuza RL, Louis DN, Rozenblatt-Rosen O, Suva ML, Regev A, Bernstein BE. Science. 2014;344:1396–1401. doi: 10.1126/science.1254257. [DOI] [PMC free article] [PubMed] [Google Scholar]
- 5.Heath JR, Ribas A, Mischel PS. Nat Rev Drug Discov. 2016;15:204–216. doi: 10.1038/nrd.2015.16. [DOI] [PMC free article] [PubMed] [Google Scholar]
- 6.Bendall SC, Simonds EF, Qiu P, Amir el AD, Krutzik PO, Finck R, Bruggner RV, Melamed R, Trejo A, Ornatsky OI, Balderas RS, Plevritis SK, Sachs K, Pe’er D, Tanner SD, Nolan GP. Science. 2011;332:687–696. doi: 10.1126/science.1198704. [DOI] [PMC free article] [PubMed] [Google Scholar]
- 7.Bodenmiller B, Zunder ER, Finck R, Chen TJ, Savig ES, Bruggner RV, Simonds EF, Bendall SC, Sachs K, Krutzik PO, Nolan GP. Nature biotechnology. 2012;30:858–867. doi: 10.1038/nbt.2317. [DOI] [PMC free article] [PubMed] [Google Scholar]
- 8.Gustafsdottir SM, Ljosa V, Sokolnicki KL, Anthony Wilson J, Walpita D, Kemp MM, Petri Seiler K, Carrel HA, Golub TR, Schreiber SL, Clemons PA, Carpenter AE, Shamji AF. PLoS One. 2013;8:e80999. doi: 10.1371/journal.pone.0080999. [DOI] [PMC free article] [PubMed] [Google Scholar]
- 9.Stack EC, Wang C, Roman KA, Hoyt CC. Methods. 2014;70:46–58. doi: 10.1016/j.ymeth.2014.08.016. [DOI] [PubMed] [Google Scholar]
- 10.Ellington AA, Kullo IJ, Bailey KR, Klee GG. Clin Chem. 2010;56:186–193. doi: 10.1373/clinchem.2009.127514. [DOI] [PMC free article] [PubMed] [Google Scholar]
- 11.Martinet W, Abbeloos V, Van Acker N, De Meyer GR, Herman AG, Kockx MM. J Pathol. 2004;202:382–388. doi: 10.1002/path.1525. [DOI] [PubMed] [Google Scholar]
- 12.Duncombe TA, Kang CC, Maity S, Ward TM, Pegram MD, Murthy N, Herr AE. Advanced materials. 2016;28:327–334. doi: 10.1002/adma.201503939. [DOI] [PMC free article] [PubMed] [Google Scholar]
- 13.Hughes AJ, Herr AE. Proceedings of the National Academy of Sciences of the United States of America. 2012;109:21450–21455. doi: 10.1073/pnas.1207754110. [DOI] [PMC free article] [PubMed] [Google Scholar]
- 14.Kang CC, Lin JM, Xu Z, Kumar S, Herr AE. Anal Chem. 2014;86:10429–10436. doi: 10.1021/ac502932t. [DOI] [PMC free article] [PubMed] [Google Scholar]
- 15.Kang CC, Yamauchi KA, Vlassakis J, Sinkala E, Duncombe TA, Herr AE. Nat Protoc. 2016;11:1508–1530. doi: 10.1038/nprot.2016.089. [DOI] [PMC free article] [PubMed] [Google Scholar]
- 16.Di Carlo D, Aghdam N, Lee LP. Analytical chemistry. 2006;78:4925–4930. doi: 10.1021/ac060541s. [DOI] [PubMed] [Google Scholar]
- 17.Eyer K, Kuhn P, Hanke C, Dittrich PS. Lab on a chip. 2012;12:765–772. doi: 10.1039/c2lc20876h. [DOI] [PubMed] [Google Scholar]
- 18.Plouffe BD, Murthy SK, Lewis LH. Rep Prog Phys. 2015;78:016601. doi: 10.1088/0034-4885/78/1/016601. [DOI] [PMC free article] [PubMed] [Google Scholar]
- 19.Kuhara M, Takeyama H, Tanaka T, Matsunaga T. Anal Chem. 2004;76:6207–6213. doi: 10.1021/ac0493727. [DOI] [PubMed] [Google Scholar]
- 20.Woelfle U, Breit E, Pantel K. J Transl Med. 2005;3:12. doi: 10.1186/1479-5876-3-12. [DOI] [PMC free article] [PubMed] [Google Scholar]
- 21.Chiou PY, Ohta AT, Wu MC. Nature. 2005;436:370–372. doi: 10.1038/nature03831. [DOI] [PubMed] [Google Scholar]
- 22.Thomas RS, Morgan H, Green NG. Lab on a chip. 2009;9:1534–1540. doi: 10.1039/b819267g. [DOI] [PubMed] [Google Scholar]
- 23.Voldman J, Gray ML, Toner M, Schmidt MA. Analytical chemistry. 2002;74:3984–3990. doi: 10.1021/ac0256235. [DOI] [PubMed] [Google Scholar]
- 24.Yang L, Banada PP, Bhunia AK, Bashir R. Journal of biological engineering. 2008;2:6. doi: 10.1186/1754-1611-2-6. [DOI] [PMC free article] [PubMed] [Google Scholar]
- 25.Puttaswamy SV, Sivashankar S, Chen RJ, Chin CK, Chang HY, Liu CH. Biotechnology journal. 2010;5:1005–1015. doi: 10.1002/biot.201000194. [DOI] [PubMed] [Google Scholar]
- 26.Zimmermann U. Biochimica et Biophysica Acta (BBA) - Reviews on Biomembranes. 1982;694:227–277. doi: 10.1016/0304-4157(82)90007-7. [DOI] [PubMed] [Google Scholar]
- 27.Kobayashi H, Watanabe R, Choyke PL. Theranostics. 2014;4:81–89. doi: 10.7150/thno.7193. [DOI] [PMC free article] [PubMed] [Google Scholar]
- 28.Bandura DR, Baranov VI, Ornatsky OI, Antonov A, Kinach R, Lou X, Pavlov S, Vorobiev S, Dick JE, Tanner SD. Anal Chem. 2009;81:6813–6822. doi: 10.1021/ac901049w. [DOI] [PubMed] [Google Scholar]
- 29.Shi Q, Qin L, Wei W, Geng F, Fan R, Shin YS, Guo D, Hood L, Mischel PS, Heath JR. Proc Natl Acad Sci U S A. 2012;109:419–424. doi: 10.1073/pnas.1110865109. [DOI] [PMC free article] [PubMed] [Google Scholar]
- 30.Andreeff M, Slater DE, Bressler J, Furth ME. Blood. 1986;67:676–681. [PubMed] [Google Scholar]
- 31.Madou M, Zoval J, Jia G, Kido H, Kim J, Kim N. Annual review of biomedical engineering. 2006;8:601–628. doi: 10.1146/annurev.bioeng.8.061505.095758. [DOI] [PubMed] [Google Scholar]
- 32.Yeo T, Tan SJ, Lim CL, Lau DP, Chua YW, Krisna SS, Iyer G, Tan GS, Lim TK, Tan DS, Lim WT, Lim CT. Sci Rep. 2016;6:22076. doi: 10.1038/srep22076. [DOI] [PMC free article] [PubMed] [Google Scholar]
- 33.Burger R, Reith P, Kijanka G, Akujobi V, Abgrall P, Ducree J. Lab on a chip. 2012;12:1289–1295. doi: 10.1039/c2lc21170j. [DOI] [PubMed] [Google Scholar]
- 34.Gorkin R, Park J, Siegrist J, Amasia M, Lee BS, Park JM, Kim J, Kim H, Madou M, Cho YK. Lab Chip. 2010;10:1758–1773. doi: 10.1039/b924109d. [DOI] [PubMed] [Google Scholar]
- 35.Ludwig A, Kretzmer G, Schugerl K. Enzyme and microbial technology. 1992;14:209–213. doi: 10.1016/0141-0229(92)90068-y. [DOI] [PubMed] [Google Scholar]
- 36.van Loon JJ, Folgering EH, Bouten CV, Veldhuijzen JP, Smit TH. Journal of biomechanical engineering. 2003;125:342–346. doi: 10.1115/1.1574521. [DOI] [PubMed] [Google Scholar]
- 37.Hughes AJ, Spelke DP, Xu Z, Kang CC, Schaffer DV, Herr AE. Nat Methods. 2014;11:749–755. doi: 10.1038/nmeth.2992. [DOI] [PMC free article] [PubMed] [Google Scholar]
- 38.Durmus NG, Tekin HC, Guven S, Sridhar K, Arslan Yildiz A, Calibasi G, Ghiran I, Davis RW, Steinmetz LM, Demirci U. Proceedings of the National Academy of Sciences of the United States of America. 2015;112:E3661–3668. doi: 10.1073/pnas.1509250112. [DOI] [PMC free article] [PubMed] [Google Scholar]
- 39.Zipursky A, Bow E, Seshadri RS, Brown EJ. Blood. 1976;48:361–371. [PubMed] [Google Scholar]
- 40.Luwor RB, Stylli SS, Kaye AH. J Clin Neurosci. 2013;20:907–911. doi: 10.1016/j.jocn.2013.03.006. [DOI] [PubMed] [Google Scholar]
- 41.Mukthavaram R, Ouyang X, Saklecha R, Jiang P, Nomura N, Pingle SC, Guo F, Makale M, Kesari S. J Transl Med. 2015;13:269. doi: 10.1186/s12967-015-0627-5. [DOI] [PMC free article] [PubMed] [Google Scholar]
- 42.Sherry MM, Reeves A, Wu JK, Cochran BH. Stem Cells. 2009;27:2383–2392. doi: 10.1002/stem.185. [DOI] [PMC free article] [PubMed] [Google Scholar]
- 43.Butt RH, Coorssen JR. Mol Cell Proteomics. 2013;12:3834–3850. doi: 10.1074/mcp.M112.021881. [DOI] [PMC free article] [PubMed] [Google Scholar]
- 44.Neuhoff V, Arold N, Taube D, Ehrhardt W. Electrophoresis. 1988;9:255–262. doi: 10.1002/elps.1150090603. [DOI] [PubMed] [Google Scholar]
- 45.Li JJ, Bickel PJ, Biggin MD. PeerJ. 2014;2:e270. doi: 10.7717/peerj.270. [DOI] [PMC free article] [PubMed] [Google Scholar]
- 46.Stott SL, Hsu CH, Tsukrov DI, Yu M, Miyamoto DT, Waltman BA, Rothenberg SM, Shah AM, Smas ME, Korir GK, Floyd FP, Jr, Gilman AJ, Lord JB, Winokur D, Springer S, Irimia D, Nagrath S, Sequist LV, Lee RJ, Isselbacher KJ, Maheswaran S, Haber DA, Toner M. Proc Natl Acad Sci U S A. 2010;107:18392–18397. doi: 10.1073/pnas.1012539107. [DOI] [PMC free article] [PubMed] [Google Scholar]
- 47.Guggisberg K, Okorie C, Khalil M. Arch Pathol Lab Med. 2011;135:200–206. doi: 10.5858/135.2.200. [DOI] [PubMed] [Google Scholar]
- 48.Shetty MK, Longatto-Filho A. Indian J Surg Oncol. 2011;2:165–171. doi: 10.1007/s13193-011-0082-6. [DOI] [PMC free article] [PubMed] [Google Scholar]
- 49.Allison KH, Reisch LM, Carney PA, Weaver DL, Schnitt SJ, O’Malley FP, Geller BM, Elmore JG. Histopathology. 2014;65:240–251. doi: 10.1111/his.12387. [DOI] [PMC free article] [PubMed] [Google Scholar]
- 50.Chandanwale SS, Gupta K, Dharwadkar AA, Pal S, Buch AC, Mishra N. Journal of mid-life health. 2014;5:186–191. doi: 10.4103/0976-7800.145164. [DOI] [PMC free article] [PubMed] [Google Scholar]
Associated Data
This section collects any data citations, data availability statements, or supplementary materials included in this article.


