

Abstract
Objective
To assess whether randomization to 10 years of lifestyle intervention to induce and maintain weight loss improves cognitive function.
Research Design and Methods
The Action for Health in Diabetes (Look AHEAD) enrolled overweight and obese individuals with type 2 diabetes, aged 45–76 years, into a randomized controlled clinical trial of an intensive lifestyle intervention for weight loss through reduced caloric intake and increased physical activity compared with a control condition of diabetes support and education. A standard battery of cognitive function tests was administered in 3,751 participants, 10–13 years following enrollment, by certified examiners who were masked to intervention assignment. The battery included the Modified Mini-Mental State Exam, Rey Auditory Verbal Learning Test, Digit Symbol Coding, Trail Making Test, and Modified Stroop Color-Word Test.
Results
Assignment to lifestyle intervention, compared with assignment to diabetes support and education, was not associated with significantly different overall (p=0.10) or domain-specific (all p >0.10) cognitive function. Results were fairly consistent across pre-specified groups, but there was some evidence of trends for differential intervention effects showing modest harm in ILI relative to DSE as BMI increased and among individuals with a history of cardiovascular disease. Cognitive function was not associated with changes in weight or fitness (all p >0.05).
Conclusions
Long-term behavioral weight loss intervention for overweight and obese adults with diabetes was not associated with cognitive benefit.
A growing body of evidence indicates that potentially modifiable risk factors account for one-third of all cases of Alzheimer’s disease (AD), the leading cause of dementia worldwide (1). For example, evidence suggests that mid-life obesity is associated with a long-term increased risk of dementia and cognitive decline in later life (2; 3). Obese and overweight individuals with type 2 diabetes are at high risk for cerebrovascular disease (CVD), brain atrophy, and declining brain function, which are associated with cognitive deficits and dementia (4; 5).
The ‘obesity paradox’ has been suggested to explain the reported finding that being overweight or obese at midlife is associated with an increased risk of poorer cognitive function and impairment, while among older adults it is associated with reduced risk (6). However, some have argued that weight loss among the elderly may account for this inverse association with cognitive impairment (7); thus impact of weight loss on cognitive function among older adults remains unclear.
Behavioral interventions targeting weight loss through reduced caloric intake and increased physical activity hold promise to protect against cognitive declines by, for example, improving blood pressure control and vascular function and reducing inflammation. Individuals with type 2 diabetes may be particularly sensitive to such interventions because some of the mechanisms by which type 2 diabetes may adversely influence brain health and functioning are relate to impaired glucose regulation and insulin resistance (5) that can benefit from weight loss and increased physical activity (8; 9).
This study examines the impact of a long-term intensive lifestyle intervention (ILI) targeting weight loss and physical activity on cognitive function in middle-aged and older overweight and obese individuals with diabetes. This paper addresses the following aims specified in the Look AHEAD Continuation protocol: 1) to test if randomization to approximately 10 years of ILI is associated with better global and domain-specific cognitive function compared with the comparator diabetes support and education (DSE); 2) to examine the consistency of the above findings among pre-specified subgroups of individuals defined at baseline by age, body mass index, and history of cardiovascular disease; and 3) to describe the relationships between changes in weight and fitness during follow-up and measures of global and domain-specific cognitive function.
METHODS
The design and methods of Look AHEAD have been previously described (10). Look AHEAD was a 16-site, randomized, controlled trial that recruited 5,145 individuals (from 2001 to 2004) who were overweight or obese and had type 2 diabetes. Participants were 45–76 years of age and had BMI >25 kg/m2 (or >27 kg/m2 if on insulin), glycated hemoglobin (HbA1c) <11% (mmol/mol), systolic/diastolic blood pressure <160/<100 mmHg, and triglycerides <600 mg/dl. Participants were randomly assigned (1:1) to the ILI or the DSE comparator; all provided informed consent. Local institutional review boards approved the protocol.
During the Look AHEAD Continuation, cognitive assessments were carried out in the full cohort across all sites between August 2013 and December 2014, or 10–13 years after enrollment and 1–2 years after intervention cessation in 3,751 participants. This report describes these data.
Interventions
ILI participants were assigned dietary and physical activity goals for weight loss and seen weekly for six months, and subsequently, three times per month for six months with a combination of group and individual contact. Thereafter, ILI participants were offered two contacts per month with optional group meetings and refresher courses, and national campaigns designed to facilitate weight loss maintenance (11). DSE subjects were invited to three group sessions per year for the first four years and one session per year thereafter (10). On September 14, 2012, the study’s sponsor (NIDDK) terminated interventions based on recommendations from the trial’s Data and Safety Monitoring Board. The reason was statistical futility for the trial’s primary endpoint, a composite of death from cardiovascular disease, nonfatal myocardial infarction, nonfatal stroke, and hospitalization for angina.
Cognitive Assessments
Cognitive functions previously shown to be reduced in persons with type 2 diabetes were assessed with a battery of validated, standardized tests: attention and concentration with the Trail Making Test-Part A (TMT-A) (12); verbal learning and memory with the Rey Auditory Verbal Learning Test (RAVLT) (13); processing speed with the Digit Symbol Coding (DSC) test from the Wechsler Adult Intelligence Scale-III (14); and executive function with the 40-item Stroop Color and Word Test (SCWT) (15) and the Trail Making Test-Part B (TMT-B)(12). Global cognitive functioning was assessed by the Modified Mini-Mental Status Exam (3MSE) (16).
Other Measures
Demographic data, medical history and sources of medical care were collected by self-report. Participants brought current prescription medications to update medication records. Weight and height were measured in duplicate using a digital scale and stadiometer. Hypertension was based on medications or measured blood pressure. Genotyping for APOE ε4 genotype was performed using two TaqMan assays on a 7900 HT (Applied Biosystems, Waltham, MA) using master mix and probes purchased from Life Sciences (assay C_3084793_20 for rs429358 (R130C) and assay C_904973_10 for rs7412 (R176C)). Physical fitness was defined as the estimated metabolic equivalent (MET) level based on the treadmill workload (i.e., speed and grade) achieved at the point of termination of the graded exercise test at baseline, Year 1 and Year 4. Physical activity was based on the Paffenbarger Physical Activity Scale (17).
Statistical Analysis
Comparisons between the two intervention groups with respect to baseline risk factors for cognitive deficits (e.g. age, education) were performed with the t- and chi-squared tests. The primary cognitive outcome specified in the protocol was a composite formed by averaging standardized scores from five tests: delayed recall from the RAVLT (range: 0–15), number completed on the DSC (range: 0–133), time (seconds) to complete the interference condition (Subtest 3) of the SCWT, time (seconds) to complete the TMT-B, and total score on the 3MSE. Analyses of covariance were used for inference, with adjustment for clinic site (the stratification factor used in the original randomization), time since randomization, and measures expected to be correlated with baseline cognitive function: gender, age at assessment, education, race/ethnicity (grouped according to African-American, Hispanic, Native American, Non-Hispanic White, and Other), and the mental component score from the Short-Form 36 Health Survey (SF-36) (18). A subset of the cohort had one (N=759) or two (N=317) earlier cognitive assessments as part of the Look AHEAD Movement and Memory Study (4 clinics: years 8–11) and the Look AHEAD Brain MRI study (3 clinics: years 10–12): covariate adjustment was made for prior testing (yes/no) to control for any potential learning effects.
For the composite, these estimated differences were combined using the ordinary least squares (OLS) global test statistic proposed by O’Brien (19) and tested using the sum of the effect on five test scores. To limit the effect of extreme scores, we applied 1% winsorization to scores below the 1st percentile and above the 99th. To facilitate comparisons among cognitive measures, each test score was standardized by converting it to a z-score by subtracting scores from the cohort-wide mean, dividing it by the standard deviation, and ordering them so that positive scores reflected better performance.
Three subgroups comparisons were pre-specified in the study protocol, based on characteristics at the time of randomization: age (<60 years versus 60 years or older), BMI (<30 kg/m2, 30–39 kg/m2, and ≥40 kg/m2), history of cardiovascular disease (Y/N). Inverse probability weighting was used to assess the sensitivity of findings with respect to attrition that occurred between the initial randomization and time of cognitive data collection used in analyses (20).
RESULTS
Figure 1 shows that 5,145 volunteers were originally enrolled in Look AHEAD from 2001–2004, 537 of whom died prior to cognitive assessment in the Look AHEAD Continuation study. Approximately 10% in each intervention group were lost to follow-up during the 10–13 year span from randomization until the Look AHEAD Continuation. Cognitive assessments were not completed on 6–7% of the active participants – often this was because they had moved and were only being followed remotely via telephone interviews. Our analyses focus on the 3,751 participants with cognitive assessments. Compared with the original enrollees who did not have a cognitive assessment during the Look AHEAD Continuation, those included in our analyses tended to be younger; female; without CVD history; minority; with shorter durations of diabetes; without hypertension; not taking anti-hypertensive medications, oral diabetes medications, insulin, or lipid-lowering medications; with better levels of fitness and HbA1c; and to have better average SF-36 scores for general and physical health and (all p<0.05). The percent of original enrollees who underwent cognitive assessment was similar between intervention groups: 73.5% of ILI and 72.3% of DSE (p=0.31).
Figure 1.
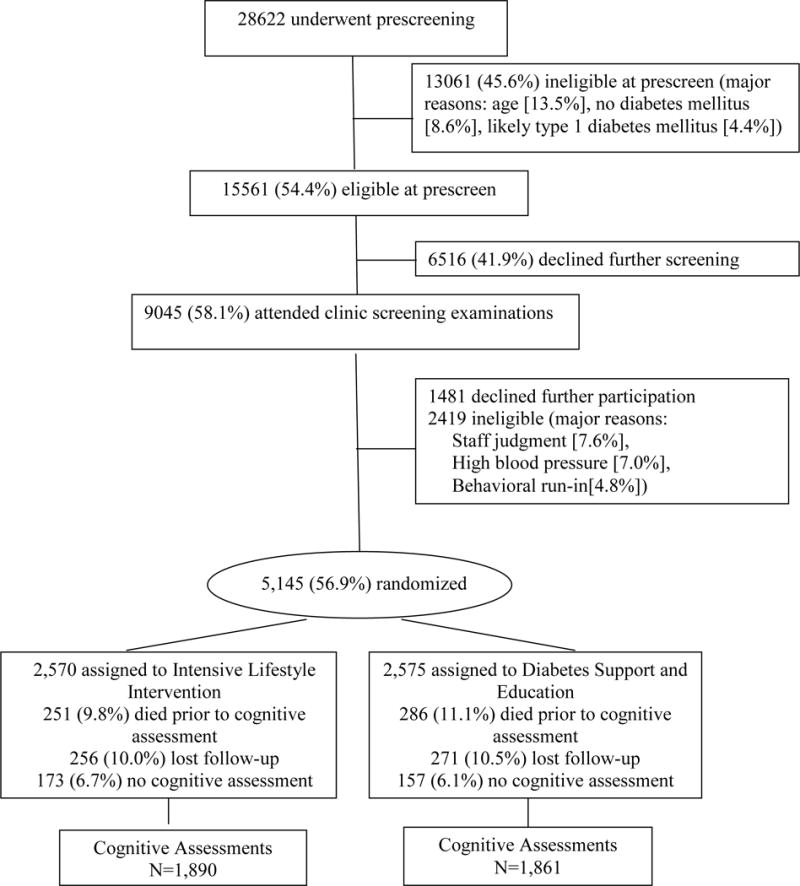
CONSORT diagram describing participant’s enrollment into Look AHEAD and those with available cognitive function assessments in Years 10–13.
Table 1 portrays baseline characteristics for participants with cognitive assessments grouped by intervention. No group differences reached nominal statistical significance (all p>0.10). Cognitive assessments occurred an average (SD) of 11.4 (0.8) years after randomization in both intervention groups (p=0.78) at which time the mean age of the cohorts was 69.3 (6.3) years for the ILI participants and 69.6 (6.4) years for the DSE participants (p=0.27).
Table 1.
Baseline characteristics of Look AHEAD participants who had cognitive assessments, by treatment group assignment
| Baseline Characteristic | Diabetes Support and Education N=1,861 |
Intensive Lifestyle Intervention N=1,890 |
P-value |
|---|---|---|---|
| Age, % | |||
| 45–54 | 26 | 27 | |
| 55–64 | 57 | 57 | 0.52 |
| 65–76 | 18 | 16 | |
| Mean (SD) | 58.2 (6.6) | 58.0 (6.5) | 0.34 |
| Body mass index (kg/m2), % | |||
| 25–29.9 | 15 | 17 | |
| 30–39.9 | 63 | 62 | 0.24 |
| >40 | 22 | 22 | |
| Mean (SD) | 36.0 (5.8) | 35.6 (5.9) | 0.08 |
| Gender, % | |||
| Women | 62 | 61 | 0.46 |
| Men | 38 | 39 | |
| History of cardiovascular disease, %* | |||
| No | 89 | 88 | 0.19 |
| Yes | 11 | 12 | |
| Race/Ethnicity, % | |||
| African-American | 17 | 16 | |
| American Indian | 6 | 6 | |
| Hispanic/Latino | 13 | 14 | 0.96 |
| Non-Hispanic white | 61 | 61 | |
| Other/multiple | 3 | 3 | |
| Diabetes duration, % (miss=27) | |||
| < 5 years | 46 | 48 | 0.43 |
| ≥ 5 years | 54 | 52 | |
| Education, % | |||
| High school graduate | 51 | 48 | |
| College graduate | 21 | 24 | 0.11 |
| Post college degree | 19 | 19 | |
| Other | 9 | 9 | |
| Hypertension, % | |||
| No | 18 | 17 | 0.41 |
| Yes | 82 | 83 | |
| Prescription medications, % | |||
| Antihypertensive (miss=65) | 71 | 72 | 0.31 |
| Any oral diabetes meds (miss=42) | 86 | 86 | 0.94 |
| Biguanides (miss=83) | 61 | 62 | 0.63 |
| Insulin (miss=135) | 15 | 15 | 0.81 |
| Lipid lowering (miss=94) | 48 | 51 | 0.34 |
| Short Form-36, Mean (SD) | |||
| General | 47.3 (8.7) | 47.3 (9.1) | 0.83 |
| Physical Component | 48.3 (7.8) | 48.1 (7.9) | 0.57 |
| Mental Component | 53.7 (7.8) | 53.4 (8.2) | 0.26 |
| Physical Fitness, METS, Mean (SD) | 7.3 (2.0) | 7.4 (2.0) | 0.60 |
| HbA1c, % | 7.25 (1.16) | 7.22 (1.13) | 0.44 |
| Apolipoprotein ε4 alleles, % (miss=661) | |||
| 0 | 77 | 77 | |
| 1 | 21 | 21 | |
| 2 | 2 | 2 | 0.97 |
Prior cardiovascular disease included history of myocardial infarction, coronary artery bypass, angioplasty/stent procedures, peripheral vascular disease, stroke, stable angina, and class I/II heart failure.
In this subset of the full Look AHEAD cohort, there were substantial and significant differences in weight loss, physical fitness, physical activity, and insulin use between the ILI and DSE groups at every time point (Supplemental Table S1). For example, at 1 and 4 and 8 years of follow-up, the mean percent changes in weight from baseline for ILI participants were −10.19%, −5.13% and −6.40% compared with −0.88%, −1.28% and −3.63% for DSE participants, (all p<0.0001). At the time of their cognitive assessment, the mean (SD) percent weight changes from baseline were −6.42 (9.97) among ILI participants and −4.87 (10.52) among DSE participants: p<0.001. The mean changes from baseline in fitness (submaximal METS) measured at Year 1 and 4 (when last assessed) were 21.02% and 6.08% among ILI participants compared with 6.32% and −0.02% among DSE participants (p<0.001). Insulin use in the ILI group remained significantly lower than the DSE group at Years 1, 4 and 8 (all p<0.01), and HbA1c was significantly lower at Years 1 and 4 (p<0.01). Physical activity scores in the ILI group also were significantly higher than the DSE group at Years 1, 4 and 8 (all p<0.001).
Supplemental Table S2 lists mean cognitive test scores by age and by intervention assignment (non-standardized). Scores show the expected inverse association between cognitive performance and age.
For the protocol OLS analysis of the primary composite outcome, the mean (SE) standardized score for DSE participants was 0.002 (0.014) compared to −0.012 (0.014) for the ILI participants (p=0.45), as shown in Table 2. Similarly, none of the differences between the intervention groups for the individual cognitive tests were statistically significant. Supporting analyses using inverse probability weighting to control for attrition yielded comparable results (not reported).
Table 2.
Mean cognitive function scores (in standard deviation units*) with covariate adjustment for gender, age at assessment (as a continuous variable), education (classified as high school/GED graduate, college graduate, graduate college degree, or none of the above), race/ethnicity (grouped according to African-American, Hispanic, Native American, Non-Hispanic White, and Other), clinic, time from randomization, whether or not prior cognitive testing had been performed, and the mental component score from the SF-36.
| Cognitive Function | Diabetes Support and Education Mean (SE) | Intensive Lifestyle Intervention Mean (SE) | p-value |
|---|---|---|---|
| Composite primary outcome | 0.002 (0.014) | −0.012 (0.014) | 0.45 |
| Stroop Color Word Test (Subtest 3 minus subtest 2) | 0.008 (0.022) | −0.021 (0.022) | 0.35 |
| Rey Auditory Verbal Learning Test–Delayed | 0.001 (0.021) | −0.004 (0.021) | 0.85 |
| Modified Mini Mental State Exam | −0.005 (0.019) | 0.004 (0.019) | 0.76 |
| Trail Making Test-Part B | 0.018 (0.020) | −0.025 (0.020) | 0.13 |
| Digit Symbol Coding | 0.008 (0.019) | −0.011 (0.019) | 0.46 |
Standard deviation units for individual tests: Stroop (17.63), RAVLT Delayed (3.44). Modified Mini Mental State Exam (7.15), Trail Making Test-Part-B (69.84), and Digit Symbol Coding (11.00)
Across the subgroups we examined, there was some evidence that differences between intervention groups varied by baseline BMI and history of cardiovascular disease (Supplemental Table S3). For the standardized composite measure, mean (SE) differences (ILI minus DSE) were 0.047 (0.068) SD units for participants with BMI<30 kg/m2, but trended toward negative for heavier participants (p=0.03) and were −0.091 (0.057) SD units for those with BMI ≥30 kg/m2. Among the cognitive domains, this trend appeared to be strongest for the 3MSE assessment of global cognitive function (p=0.005). Among participants with a history of cardiovascular disease, those who had been assigned to ILI had poorer mean performances on all cognitive assessment tests compared with those who had been assigned to DSE, with tests of interaction reaching nominal levels of statistical significance for the overall composite (p=0.02), executive function (SCWT), p=0.002), and speed of processing (DSC, p=0.003) tests.
To examine whether changes in weight and fitness were associated with cognitive function, we grouped participants according to their Year 4 measurements (the last time fitness was assessed) as 1) >5% weight loss, 0–5% weight loss, weight gain; and 2) >0.5 METS gain, −0.5 to 0.5 METS change, and >0.5 METS loss. Table 3 describes Year 4 associations of the composite score with changes in weight and fitness by intervention group, which all failed to reach statistical significance. We also examined whether cognitive function was related to diabetes control by regressing composite cognitive function on the average HbA1c level throughout follow-up, with covariates as in Table 2. There was a strong inverse relationship between mean HbA1c level and composite cognitive function with slope [95% confidence interval] −0.068 [−0.094, −0.048] SD/% (p<0.001), which was similar across intervention groups (p=0.47).
Table 3.
Association of Year 4 changes in weight loss and fitness with subsequently assessed composite cognitive score by intervention assignment.
| Year 4 Weight and Fitness Changes | Mean (SE) Composite Cognitive Function*
|
|
|---|---|---|
| Diabetes Support and Education | Intensive Lifestyle Intervention | |
|
| ||
| Weight loss, % | ||
| >5% | 0.048 (0.039) N=425 | −0.006 (0.029) N=807 |
| 0–5% | −0.000 (0.035) N=524 | 0.017 (0.036) N=519 |
| Weight gain | −0.019 (0.028) N=853 | 0.018 (0.037) N=514 |
| P=0.38 | P=0.83 | |
|
| ||
| Fitness Change, METS | ||
| >0.5 gain | 0.101 (0.040) N=414 | 0.033 (0.034) N=579 |
| −0.5 to 0.5 change | 0.050 (0.032) N=612 | 0.060 (0.032) N=641 |
| >0.5 loss | −0.000 (0.034) N=555 | 0.022 (0.040) N=412 |
| P=0.16 | P=0.74 | |
With covariate adjustment for gender, age at assessment, education, race/ethnicity, clinic, time from randomization, and the mental component score from the Short Form-36 Mental Component.
DISCUSSION
The Look AHEAD trial demonstrated that overweight and obese adults with diabetes randomly assigned to the ILI achieved and maintained significantly greater weight loss up to 10 years after randomization compared with individuals assigned to DSE(21). ILI resulted in significantly better fitness levels (22), increased diabetes remission, and attenuated known cardiovascular risk factors (23). However, the intervention did not result in any significant differences in the main cardiovascular composite outcome or in the individual components of that outcome (21). The current study of cognitive outcomes showed that compared with DSE, assignment to the ILI did not result in improved cognitive function assessed 10–13 years after randomization (1–2 years post-intervention) and for participants with higher BMI and those who had a history of CVD, assignment to ILI resulted in modestly poorer cognitive function compared to DSE. Changes in weight loss and fitness through Year 4 were not related to cognitive function measured 6–9 years later.
The poorer cognitive test performance in this cohort compared with the general population was consistent with another large study of middle-aged and older adults with diabetes employing some of the same measures (24) and thus support the generalizability of our results to this population. The results also highlight the adverse cognitive consequences of diabetes and associated comorbidities and raise the importance of understanding the mechanisms by which cognition is adversely affected, as well as of developing preventive and treatment interventions.
Our results are consistent with an earlier report of a subset of 978 Look AHEAD participants assessed 8–9 years post-randomization and 2–3 years post-treatment that showed no differences on any of these cognitive measures between the ILI and DSE groups (25). Weight loss was not correlated with cognitive function, which is consistent with the lack of mean differences we report in Table 3. Our results also are consistent with studies that examined the association of a lifestyle intervention for weight loss and diabetes prevention with cognitive performance among persons with pre-diabetes and found associations between higher HbA1c levels and poorer cognitive performance. In the Diabetes Prevention Program Outcomes Study a lifestyle intervention similar to Look AHEAD was not associated with improved cognition 12 years after randomization, although higher HbA1c at the time of cognitive assessment was related to worse cognition (26). In the Finnish Diabetes Prevention study, the lifestyle intervention was also not related to cognitive performance 13 years after randomization and 9 years after the end of interventions (27), although higher glycaemia was related to worse cognitive performance (28). The Action to Control Cardiovascular Risk in Diabetes Memory study (ACCORD MIND), which enrolled 4393 men and women (46%) with diabetes who were slightly older, less overweight or obese, and had higher HbA1c than our sample, found no difference in cognitive outcomes at 40 months in an intensive glycemic control group compared to usual care (24).
Our results are inconsistent with a meta-analysis of short-term (<2 years) studies of intentional weight loss interventions that reported modest cognitive benefits (mainly memory and executive function) for obese adults (29) suggesting we might have seen benefit if we had assessed cognition during the most active period of the Look AHEAD intervention and if our sample had included non-diabetic overweight/obese participants.
Among adults with metabolic disease, there is the possibility of a ‘legacy effect’, which refers to a significant lag time between interventions that affect metabolic process in diabetes and the benefits of those interventions (30). In the United Kingdom Prospective Diabetes Study, a randomized trial of intensive glycemic control vs. usual care in type 2 diabetes, improved microvascular outcomes but not macrovascular outcomes were observed in the intensive intervention arm compared to the usual care arm during the study period (30; 31). After 10 years of follow-up both micro- and macrovascular benefits were apparent, despite attenuation of the glycemic benefits of the intervention (32). In addition to a possible cognitive legacy effect, the Look AHEAD cohort, with a mean age of 69 years at the cognitive assessment, may have just been entering the time of greatest susceptibility to cognitive decline.
While we did not find evidence of improved cognition attributable to the intervention, there is evidence of improved markers of subclinical cerebrovascular disease in a study of 319 Look AHEAD participants who received a structural MRI 10–12 years after randomization. Participants randomized to ILI had 9% smaller ventricle size indicating less overall atrophy and 28% smaller white matter hyperintensity volume compared to the DSE group (33). Similarly in the ACCORD MIND study a subset of participants randomized to the intensive glycemic control arm had greater total brain volumes than participants in usual care (24) despite showing no differences in cognitive functioning. Brain structural changes may precede cognitive performance outcomes (24; 34). It is possible that cognitive effects may emerge with longer follow-up.
Evidence that the intervention was associated with a slight benefit in global cognitive function among participants with lower BMI but modest harm among participants with higher BMI was reported earlier among the subset of Look AHEAD participants that underwent cognitive assessment at years 8–10 (25). The trend that the intervention was associated with poorer cognitive function among participants with baseline history of cardiovascular disease resonates with a similar trend seen for major cardiovascular events, hospitalizations, and overall health care costs (21; 35). Thus ILI may confer modest harm to overweight and obese individuals with diabetes who also have diagnosed comorbid cardiovascular disease particularly in functions involving speeded and executive functioning. We currently have no explanations for these findings, which require further study.
Our study has several limitations. The lack of pre-treatment assessment of cognitive function precluded our controlling for baseline cognitive differences or assessing how changes in weight and fitness related to changes in cognition. There was some attrition of participants between enrollment and cognitive assessments including those who died, which could have interfered with our analysis of the ability of the intervention to modulate cognitive function. Loss of older participants is particularly important for cognitive studies since age is unequivocally the greatest risk factor for dementia and cognitive decline. That the cohort studied was not population-based affects the generalizability of our results. Strengths of this study include the large sample size, adequate retention rate, deep phenotyping of participants and that it was conducted within a randomized study that appears to have adequately controlled for important confounds.
Conclusions
Assignment to 10 years of an intensive lifestyle weight loss intervention was not associated with any benefit with regard to overall or domain specific cognitive functioning 1–2 years after the intervention in middle-aged and older adults with type 2 diabetes and there was evidence of modest harm as BMI increased and among those with a history of CVD. Results are consistent with other clinical trials that have failed to demonstrate benefits of lifestyle changes on cognitive function.
Supplementary Material
Supplemental Appendix S1. Complete list of authors.
Supplemental Table S1: Weight, insulin use, HbA1c, hypertension, physical activity and fitness by intervention assignment at Years 1, 4, and 8.
Supplemental Table S2: Mean levels of cognitive scores by age and intervention assignment.
Supplemental Table S3: Mean differences (in standard deviation units) between intervention groups (ILI – DSE) on cognitive outcomes across pre-specified subgroups with covariate adjustment for gender, age at assessment (as a continuous variable), education (classified as high school/GED graduated, college graduate, graduate college degree, or none of the above), race/ethnicity (grouped according to African-American, Hispanic, Native American, Non-Hispanic White, and Other), clinic, and the mental component score from the SF-36.
Footnotes
Trial Registration clinicaltrials.gov Identifier: NCT00017953
|
| ||||||||
| Elements of Financial/Personal Conflicts | SRR | JAL | LDB | GLB, HPH, KED-McD, RWJ, JNK, JMMcC, NMP, ME, TAW, SEA, MAE | ||||
|
| ||||||||
| Yes | No | Yes | No | Yes | No | Yes | No | |
|
| ||||||||
| Employment or Affiliation | x | x | x | x | ||||
|
| ||||||||
| Grants/Funds | x | x | x | x | ||||
|
| ||||||||
| Honoraria | x | x | x | x | ||||
|
| ||||||||
| Speaker Forum | x | x | x | x | ||||
|
| ||||||||
| Consultant | x | x | x | x | ||||
|
| ||||||||
| Stocks | x | x | x | x | ||||
|
| ||||||||
| Royalties | x | x | x | x | ||||
|
| ||||||||
| Expert Testimony | x | x | x | x | ||||
|
| ||||||||
| Board Member | x | x | x | x | ||||
|
| ||||||||
| Patents | x | x | x | x | ||||
|
| ||||||||
| Personal Relationship | x | x | x | x | ||||
|
| ||||||||
| *Authors can be listed by abbreviations of their names. | ||||||||
| For “yes” x mark(s): give brief explanation below: | ||||||||
|
| ||||||||
Author Contributions: Study design: HPH, RWJ, JMM, ME, TAW, SEA, MAE; Acquisition of data: SRR, JAL, LDB, GLB, HPH, KED, RWJ, JMM, NMP, ME, TAW, SEA, MAE; Analysis/Interpretation of data: SRR, JAL, LDB, GLB, HPH, KED, RWJ, JMM, NMP, ME, TAW, SEA, MAE; Preparation of ms: SRR, JAL, LDB, GLB, HPH, KED, RWJ, JMM, NMP, ME, TAW, SEA, MAE
Sponsor’s Role: The sponsor (NIDDK) was a voting member of the Steering Committee that approved this manuscript and had representation (Dr. Mary Evans) on the writing group.
References
- 1.Norton S, Matthews FE, Barnes DE, Yaffe K, Brayne C. Potential for primary prevention of Alzheimer’s disease: an analysis of population-based data. Lancet Neurol. 2014;13:788–794. doi: 10.1016/S1474-4422(14)70136-X. [DOI] [PubMed] [Google Scholar]
- 2.Gustafson D, Rothenberg E, Blennow K, Steen B, Skoog I. An 18-year follow-up of overweight and risk of Alzheimer disease. Arch Intern Med. 2003;163:1524–1528. doi: 10.1001/archinte.163.13.1524. [DOI] [PubMed] [Google Scholar]
- 3.Kivipelto M, Ngandu T, Fratiglioni L, Viitanen M, Kareholt I, Winblad B, Helkala EL, Tuomilehto J, Soininen H, Nissinen A. Obesity and vascular risk factors at midlife and the risk of dementia and Alzheimer disease. Arch Neurol. 2005;62:1556–1560. doi: 10.1001/archneur.62.10.1556. [DOI] [PubMed] [Google Scholar]
- 4.Arvanitakis Z, Wilson RS, Bienias JL, Evans DA, Bennett DA. Diabetes mellitus and risk of Alzheimer disease and decline in cognitive function. Arch Neurol. 2004;61:661–666. doi: 10.1001/archneur.61.5.661. [DOI] [PubMed] [Google Scholar]
- 5.van den Berg E, Kloppenborg RP, Kessels RP, Kappelle LJ, Biessels GJ. Type 2 diabetes mellitus, hypertension, dyslipidemia and obesity: A systematic comparison of their impact on cognition. Biochim Biophys Acta. 2009;1792:470–481. doi: 10.1016/j.bbadis.2008.09.004. [DOI] [PubMed] [Google Scholar]
- 6.Fitzpatrick AL, Kuller LH, Lopez OL, Diehr P, O’Meara ES, Longstreth WT, Jr, Luchsinger JA. Midlife and late-life obesity and the risk of dementia: cardiovascular health study. Arch Neurol. 2009;66:336–342. doi: 10.1001/archneurol.2008.582. [DOI] [PMC free article] [PubMed] [Google Scholar]
- 7.Driscoll I, Espeland MA, Wassertheil-Smoller S, Gaussoin SA, Ding J, Granek IA, Ockene JK, Phillips LS, Yaffe K, Resnick SM. Weight change and cognitive function: findings from the Women’s Health Initiative Study of Cognitive Aging. Obesity (Silver Spring) 2011;19:1595–1600. doi: 10.1038/oby.2011.23. [DOI] [PMC free article] [PubMed] [Google Scholar]
- 8.Barnes DE, Yaffe K. The projected effect of risk factor reduction on Alzheimer’s disease prevalence. Lancet Neurol. 2011;10:819–828. doi: 10.1016/S1474-4422(11)70072-2. [DOI] [PMC free article] [PubMed] [Google Scholar]
- 9.Cotman CW, Berchtold NC, Christie LA. Exercise builds brain health: key roles of growth factor cascades and inflammation. Trends in neurosciences. 2007;30:464–472. doi: 10.1016/j.tins.2007.06.011. [DOI] [PubMed] [Google Scholar]
- 10.Ryan DH, Espeland MA, Foster GD, Haffner SM, Hubbard VS, Johnson KC, Kahn SE, Knowler WC, Yanovski SZ. Look AHEAD (Action for Health in Diabetes): design and methods for a clinical trial of weight loss for the prevention of cardiovascular disease in type 2 diabetes. Control Clin Trials. 2003;24:610–628. doi: 10.1016/s0197-2456(03)00064-3. [DOI] [PubMed] [Google Scholar]
- 11.Wadden TA, West DS, Delahanty L, Jakicic J, Rejeski J, Williamson D, Berkowitz RI, Kelley DE, Tomchee C, Hill JO, Kumanyika S. The Look AHEAD study: a description of the lifestyle intervention and the evidence supporting it. Obesity (Silver Spring) 2006;14:737–752. doi: 10.1038/oby.2006.84. [DOI] [PMC free article] [PubMed] [Google Scholar]
- 12.Reitan R. Validity of the Trail Making Test as an indicator of organic brain damage. Perceptual and Motor Skills. 1958;8:271–276. [Google Scholar]
- 13.Rey AL. L’examen cliniique en psichologie. Paris: Presses Universitaires de France; 1964. [Google Scholar]
- 14.Wechsler D. Wechsler Adult Intelligence Scale-III (WAIS-III) New York: Psychological Corporation/Harcourt, Inc; 1996. [Google Scholar]
- 15.Stroop JR. Studies of interference in serial verbal reaction. Journal of Experimental Psychology. 1935;18:643–662. [Google Scholar]
- 16.Teng EL, Chui HC. The Modified Mini-Mental State (3MS) examination. Journal of Clinical Psychiatry. 1987;48:314–318. [PubMed] [Google Scholar]
- 17.Paffenbarger RS, Jr, Blair SN, Lee IM, Hyde RT. Measurement of physical activity to assess health effects in free-living populations. Medicine and science in sports and exercise. 1993;25:60–70. doi: 10.1249/00005768-199301000-00010. [DOI] [PubMed] [Google Scholar]
- 18.Ware J, Jr, Kosinski M, Keller SD. A 12-Item Short-Form Health Survey: construction of scales and preliminary tests of reliability and validity. Med Care. 1996;34:220–233. doi: 10.1097/00005650-199603000-00003. [DOI] [PubMed] [Google Scholar]
- 19.O’Brien PC. Procedures for comparing samples with multiple endpoints. Biometrics. 1984;40:1079–1087. [PubMed] [Google Scholar]
- 20.Weuve J, Tchetgen Tchetgen EJ, Glymour MM, Beck TL, Aggarwal NT, Wilson RS, Evans DA, Mendes de Leon CF. Accounting for bias due to selective attrition: the example of smoking and cognitive decline. Epidemiology. 2012;23:119–128. doi: 10.1097/EDE.0b013e318230e861. [DOI] [PMC free article] [PubMed] [Google Scholar]
- 21.Group LAR. Wing RR, Bolin P, Brancati FL, Bray GA, Clark JM, Coday M, Crow RS, Curtis JM, Egan CM, Espeland MA, Evans M, Foreyt JP, Ghazarian S, Gregg EW, Harrison B, Hazuda HP, Hill JO, Horton ES, Hubbard VS, Jakicic JM, Jeffery RW, Johnson KC, Kahn SE, Kitabchi AE, Knowler WC, Lewis CE, Maschak-Carey BJ, Montez MG, Murillo A, Nathan DM, Patricio J, Peters A, Pi-Sunyer X, Pownall H, Reboussin D, Regensteiner JG, Rickman AD, Ryan DH, Safford M, Wadden TA, Wagenknecht LE, West DS, Williamson DF, Yanovski SZ. Cardiovascular effects of intensive lifestyle intervention in type 2 diabetes. N Engl J Med. 2013;369:145–154. doi: 10.1056/NEJMoa1212914. [DOI] [PMC free article] [PubMed] [Google Scholar]
- 22.Jakicic JM, Jaramillo SA, Balasubramanyam A, Bancroft B, Curtis JM, Mathews A, Pereira M, Regensteiner JG, Ribisl PM. Effect of a lifestyle intervention on change in cardiorespiratory fitness in adults with type 2 diabetes: results from the Look AHEAD Study. Int J Obes (Lond) 2009;33:305–316. doi: 10.1038/ijo.2008.280. [DOI] [PMC free article] [PubMed] [Google Scholar]
- 23.Wing RR. Long-term effects of a lifestyle intervention on weight and cardiovascular risk factors in individuals with type 2 diabetes mellitus: four-year results of the Look AHEAD trial. Arch Intern Med. 2010;170:1566–1575. doi: 10.1001/archinternmed.2010.334. [DOI] [PMC free article] [PubMed] [Google Scholar]
- 24.Launer LJ, Miller ME, Williamson JD, Lazar RM, Gerstein HC, Murray AM, Sullivan M, Horowitz KR, Ding J, Marcovina S, Lovato LC, Lovato J, Margolis KL, O’Connor P, Lipkin EW, Hirsch J, Coker L, Maldjian J, Sunshine JL, Truwit C, Davatzikos C, Bryan RN. Effects of intensive glucose lowering on brain structure and function in people with type 2 diabetes (ACCORD MIND): a randomised open-label substudy. Lancet Neurol. 2011;10:969–977. doi: 10.1016/S1474-4422(11)70188-0. [DOI] [PMC free article] [PubMed] [Google Scholar]
- 25.Espeland MA, Rapp SR, Bray GA, Houston DK, Johnson KC, Kitabchi AE, Hergenroeder AL, Williamson J, Jakicic JM, van Dorsten B, Kritchevsky SB, Action for Health In Diabetes M, Memory S, Look ARG. Long-term impact of behavioral weight loss intervention on cognitive function. J Gerontol A Biol Sci Med Sci. 2014;69:1101–1108. doi: 10.1093/gerona/glu031. [DOI] [PMC free article] [PubMed] [Google Scholar]
- 26.Luchsinger J, Ma Y, Florez H, Manly JJ, Golden SH, Hazuda HP, Crandall J, Venditti E, Watson K, Jeffries S, Pi-Sunyer FX. Cognition in the Diabetes Prevention Program Outcomes Study (DPPOS) Diabetes Care. 2015;63 doi: 10.2337/dc16-2376. [DOI] [PMC free article] [PubMed] [Google Scholar]
- 27.Luchsinger JA, Lehtisalo J, Lindstrom J, Ngandu T, Kivipelto M, Ahtiluoto S, Ilanne-Parikka P, Keinanen-Kiukaanniemi S, Eriksson JG, Uusitupa M, Tuomilehto J. Cognition in the finnish diabetes prevention study. Diabetes Res Clin Pract. 2015;108:e63–e66. doi: 10.1016/j.diabres.2015.02.023. [DOI] [PubMed] [Google Scholar]
- 28.Lehtisalo J, Lindstrom J, Ngandu T, Kivipelto M, Ahtiluoto S, Ilanne-Parikka P, Keinanen-Kiukaanniemi S, Eriksson JG, Uusitupa M, Tuomilehto J, Luchsinger JA. Diabetes, glycaemia, and cognition-a secondary analysis of the Finnish Diabetes Prevention Study. Diabetes Metab Res Rev. 2015 doi: 10.1002/dmrr.2679. [DOI] [PubMed] [Google Scholar]
- 29.Siervo M, Arnold R, Wells JC, Tagliabue A, Colantuoni A, Albanese E, Brayne C, Stephan BC. Intentional weight loss in overweight and obese individuals and cognitive function: a systematic review and meta-analysis. Obes Rev. 2011;12:968–983. doi: 10.1111/j.1467-789X.2011.00903.x. [DOI] [PubMed] [Google Scholar]
- 30.Chalmers J, Cooper ME. UKPDS and the legacy effect. N Engl J Med. 2008;359:1618–1620. doi: 10.1056/NEJMe0807625. [DOI] [PubMed] [Google Scholar]
- 31.Group UPDSU. Intensive blood-glucose control with sulphonylureas or insulin compared with conventional treatment and risk of complications in patients with type 2 diabetes (UKPDS 33) Lancet. 1998;352:837–853. [PubMed] [Google Scholar]
- 32.Holman RR, Paul SK, Bethel MA, Matthews DR, Neil HA. 10-year follow-up of intensive glucose control in type 2 diabetes. N Engl J Med. 2008;359:1577–1589. doi: 10.1056/NEJMoa0806470. [DOI] [PubMed] [Google Scholar]
- 33.Espeland MA, Erickson CA, Neiberg R, Jakicic J, Wadden T, Wing R, Desiderio L, Erus G, Hsieh MK, Davatzikos C, Maschak-Carey BJ, Laurienti PJ. Brain and white matter hyperintensity volumes after 10 years of random assignment to lifestyle intervention. Diabetes Care. 2016;39:1–9. doi: 10.2337/dc15-2230. [DOI] [PMC free article] [PubMed] [Google Scholar]
- 34.Burggren A, Brown J. Imaging markers of structural and functional brain changes that precede cognitive symptoms in risk for Alzheimer’s disease. Brain Imaging Behav. 2014;8:251–261. doi: 10.1007/s11682-013-9278-4. [DOI] [PMC free article] [PubMed] [Google Scholar]
- 35.Espeland MA, Glick HA, Bertoni A, Brancati FL, Bray GA, Clark JM, Curtis JM, Egan C, Evans M, Foreyt JP, Ghazarian S, Gregg EW, Hazuda HP, Hill JO, Hire D, Horton ES, Hubbard VS, Jakicic JM, Jeffery RW, Johnson KC, Kahn SE, Killean T, Kitabchi AE, Knowler WC, Kriska A, Lewis CE, Miller M, Montez MG, Murillo A, Nathan DM, Nyenwe E, Patricio J, Peters AL, Pi-Sunyer X, Pownall H, Redmon JB, Rushing J, Ryan DH, Safford M, Tsai AG, Wadden TA, Wing RR, Yanovski SZ, Zhang P. Impact of an intensive lifestyle intervention on use and cost of medical services among overweight and obese adults with type 2 diabetes: the action for health in diabetes. Diabetes Care. 2014;37:2548–2556. doi: 10.2337/dc14-0093. [DOI] [PMC free article] [PubMed] [Google Scholar]
Associated Data
This section collects any data citations, data availability statements, or supplementary materials included in this article.
Supplementary Materials
Supplemental Appendix S1. Complete list of authors.
Supplemental Table S1: Weight, insulin use, HbA1c, hypertension, physical activity and fitness by intervention assignment at Years 1, 4, and 8.
Supplemental Table S2: Mean levels of cognitive scores by age and intervention assignment.
Supplemental Table S3: Mean differences (in standard deviation units) between intervention groups (ILI – DSE) on cognitive outcomes across pre-specified subgroups with covariate adjustment for gender, age at assessment (as a continuous variable), education (classified as high school/GED graduated, college graduate, graduate college degree, or none of the above), race/ethnicity (grouped according to African-American, Hispanic, Native American, Non-Hispanic White, and Other), clinic, and the mental component score from the SF-36.