

Abstract
Obesity-associated insulin resistance plays a central role in type 2 diabetes. As such, tyrosine phosphatases that dephosphorylate the insulin receptor (IR) are potential therapeutic targets. The low molecular weight protein tyrosine phosphatase (LMPTP) is a proposed IR phosphatase, yet its role in insulin signaling in vivo has not been defined. Here we show that global and liver-specific LMPTP deletion protects mice from high-fat diet-induced diabetes without affecting body weight. To examine the role of the catalytic activity of LMPTP, we developed a small-molecule inhibitor with a novel uncompetitive mechanism, a unique binding site at the opening of the catalytic pocket, and exquisite selectivity over other phosphatases. This inhibitor is orally bioavailable, increases liver IR phosphorylation in vivo, and reverses high-fat diet induced diabetes. Our findings suggest that LMPTP is a key promoter of insulin resistance and that LMPTP inhibitors would be beneficial for treating type 2 diabetes.
Diabetes caused by insulin resistance accounts for a large proportion of obesity-associated morbidity and mortality1,2. The insulin receptor (IR) is a protein tyrosine kinase, which after engagement by insulin, autophosphorylates and phosphorylates several targets, triggering a network of intracellular signaling pathways3,4. Pharmacological interventions that sensitize cellular responses to insulin by enhancing IR phosphorylation are considered promising strategies to reduce insulin resistance in obesity5.
Insulin signaling is countered by protein tyrosine phosphatases (PTPs) that dephosphorylate and inactivate the IR. The majority of studies on PTPs involved in insulin signaling have focused on the class I6 protein tyrosine phosphatase 1B (PTP1B), a well-validated therapeutic target for obesity and diabetes7,8.
The low molecular weight protein tyrosine phosphatase (LMPTP) has been proposed to regulate insulin signaling through IR dephosphorylation9. LMPTP, encoded by the ACP1 gene, is a small (18 kDa), ubiquitous cytosolic class II PTP6 expressed as 2 isoforms, LMPTP-A and LMPTP-B, which arise from alternative splicing. Human genetic evidence suggests that LMPTP promotes type 2 diabetes and insulin resistance. ACP1 alleles encoding low LMPTP enzymatic activity protect against hyperlipidemia in obese subjects10 and associate with lower glycemic levels in diabetic11,12 and non-diabetic subjects13. Knockdown of LMPTP expression by antisense oligonucleotides improves the glycemic profile and decreases insulin resistance in diet-induced obese (DIO) C57BL/6 (B6) mice14. LMPTP knockdown also enhances IR phosphorylation in mouse hepatocytes and adipocytes14. Recombinant LMPTP dephosphorylates phosphotyrosine peptides based on the IR activation motif15 and overexpression of catalytically inactive LMPTP in immortalized mouse fibroblasts increases insulin-induced IR tyrosine phosphorylation9, suggesting that LMPTP regulates insulin signaling through its phosphatase activity. Although these studies point towards LMPTP as a regulator of insulin signaling, a rigorous assessment of the role of LMPTP in insulin resistance has not been reported.
Selective LMPTP chemical inhibitors would be highly valuable for assessing activity-dependent LMPTP functions and its potential as a drug target. Developing selective, cell-permeable PTP inhibitors has been complicated by features of the PTP active-site, which is small, highly charged, and well-conserved among different PTPs16. Several LMPTP inhibitor series have been described17, the most potent being benzoic acid-containing thiazolidines18–21 and biphenyl-containing chromones22 with low/submicromolar potency. Although both scaffolds increase IR tyrosine phosphorylation in cells, indicating that cell membrane permeability was achieved, they also inhibit PTP1B, rendering them difficult to use for dissecting intracellular LMPTP functions. There is currently no known LMPTP inhibitor with features amenable for in vivo use.
We describe the first characterization of the physiological role of LMPTP in metabolic function and discovery of the first orally bioavailable LMPTP inhibitor. Through global and tissue-specific LMPTP deletion in mice, we found that LMPTP drives obesity-induced diabetes through an action on the liver, and that LMPTP deletion increased liver IR phosphorylation in response to insulin. To demonstrate that LMPTP catalytic activity mediates this effect, we developed a small-molecule LMPTP inhibitor series with a novel uncompetitive mechanism of action and exquisite selectivity for LMPTP over other PTPs. Structural studies revealed that this series bound the LMPTP phosphocysteine intermediate and prevented the final catalytic step. We found an LMPTP inhibitor that was orally bioavailable, increased liver IR phosphorylation, and reversed high-fat diet-induced diabetes. Our findings suggest that LMPTP activity plays a key role in the development of insulin resistance and that LMPTP inhibitors would be beneficial for treating type 2 diabetes.
Results
LMPTP deletion attenuates high-fat diet induced diabetes
We recently reported generation of the first global LMPTP knockout (KO) mice23. We confirmed stable LMPTP deletion after backcrossing the gene-trap onto B6 background for >10 generations (Supplementary Results, Supplementary Fig. 1 and 19). LMPTP KO mice are healthy, fertile, and do not show anomalies in size or lifespan23. To investigate whether LMPTP deletion affects obesity-induced diabetes, we used an intraperitoneal glucose tolerance test (IPGTT)24. When fed normal chow diet, LMPTP KO mice showed similar glucose tolerance to wild-type (WT) littermates (Supplementary Fig. 1). When placed on high-fat diet (HFD) for 3 months to induce obesity, LMPTP KO mice and WT littermates gained comparable weight and displayed similar blood lipid levels and hepatic steatosis (Supplementary Fig. 1). However, obese LMPTP KO mice showed significantly improved glucose tolerance and reduced fasting insulin levels compared with obese WT littermates (Fig. 1a–b). These data demonstrate that LMPTP deletion attenuates high-fat diet-induced diabetes in mice.
Figure 1. Genetic deletion of LMPTP improves glucose tolerance of obese mice and increases liver insulin receptor signaling.
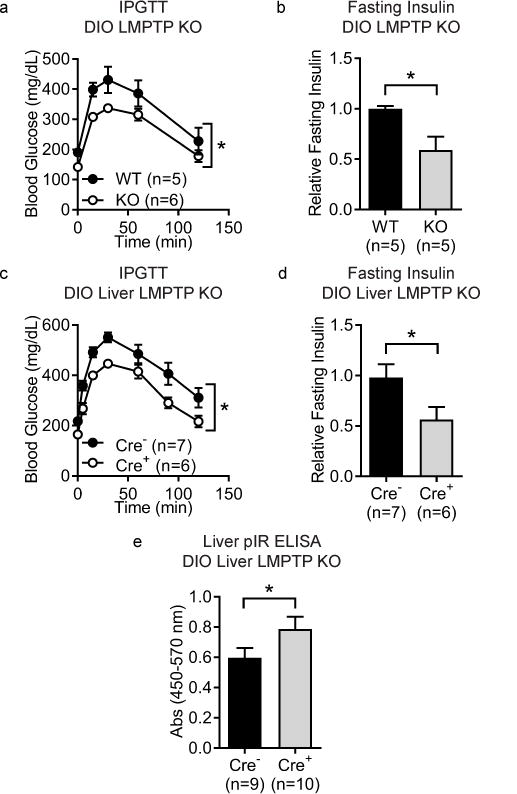
(a–b) To generate diet-induced obese (DIO) mice, male wild-type (WT) and LMPTP knockout (KO) mice were placed on high-fat diet (HFD) for 3 months. (a) Intraperitoneal glucose tolerance test (IPGTT) was performed on DIO WT (n=5) and LMPTP KO (n=6) mice. Blood glucose levels at the indicated time points are shown, p=0.0324. (b) Fasting plasma insulin levels in DIO WT (n=5) and LMPTP KO (n=5) mice as assessed by ELISA, relative to WT littermate mice, p=0.0363. (c–e) Acp1fl/fl mice were crossed with mice expressing Cre recombinase under the liver-expressed albumin promoter. Male Cre+ and Cre− littermates were placed on HFD for 3 months to generate DIO mice. (c) IPGTT was performed on DIO Cre+ (n=6) and Cre− (n=7) mice. Blood glucose levels at the indicated time points are shown, p=0.0117. (d) Fasting plasma insulin levels of DIO Cre+ (n=6) and Cre− (n=7) littermate mice as assessed by ELISA, relative to Cre− littermate mice, p=0.0425. (e) Insulin receptor (IR) tyrosine phosphorylation was assessed in livers of insulin-treated DIO Cre+ (n=10) and Cre− (n=9) littermate mice. Mice were injected intraperitoneally with insulin, livers harvested after 10 min, and IR tyrosine phosphorylation in liver homogenates was assessed by phosphoIR (pIR) ELISA, p=0.0432. (a–e) Mean±SEM is shown. *, p<0.05: (a,c) Two-Way ANOVA, (b,d) two-tailed unpaired t-test with Welch’s correction, (e) one-tailed unpaired t-test with Welch’s correction.
Liver-specific LMPTP deletion attenuates diabetes
To determine the tissue responsible for the diabetes-protective effect of LMPTP deletion, we generated Acp1 floxed mice on B6 background (Acp1fl) (Supplementary Fig. 2 and 19). These mice were bred onto strains carrying tissue-specific Cre recombinase expression in insulin target tissues: liver, adipocytes, macrophages, and skeletal muscle. Acp1fl/fl Cre+ and Cre− littermate mice were placed on HFD for 3 months and assessed for glucose tolerance and fasting insulin levels. Liver-specific LMPTP deletion recapitulated the diabetes-protective phenotype of DIO LMPTP KO mice (Fig. 1c–d) without affecting weight gain or PTP1B expression (Supplementary Fig. 3 and 19). No differences in weight gain, glucose tolerance, or fasting insulin levels were observed upon LMPTP deletion in any other tissue tested (Supplementary Fig. 4). These results suggest that LMPTP promotes obesity-associated diabetes in mice via an action on the liver.
LMPTP has been proposed to inhibit insulin signaling in liver tissue14; therefore, we examined the effect of LMPTP deletion on liver IR tyrosine phosphorylation in DIO mice following insulin stimulation. DIO Acp1fl/fl liver-specific Cre+ mice showed significantly increased tyrosine phosphorylation of the liver IR kinase domain-activation loop4 compared with Cre− littermates following in vivo insulin stimulation (Fig. 1e). We also observed increased activation of protein kinase B (PKB/AKT) and extracellular signal-regulated kinase (ERK) –both critical mediators of IR signaling3– as evidenced by increased phosphorylation of AKT-T308 and S473 and ERK-T202/Y204 (Supplementary Fig. 5 and 19). These results are consistent with LMPTP promoting obesity-induced insulin resistance via dephosphorylation of the liver IR, although we cannot exclude the possibility of additional substrates.
Identification of a novel small-molecule LMPTP inhibitor
We sought to explore the role of LMPTP in insulin signaling using a small-molecule inhibitor, thus we embarked on a high-throughput screening (HTS) campaign. Previous searches for PTP inhibitors targeted the highly charged active-site, typically yielding compounds with high activity in vitro but low selectivity and/or cellular permeability16. To disfavor competitive inhibition, we employed a high concentration of substrate (0.4 mM 3-O-methylfluorescein phosphate [OMFP]) such that the enzyme was at Vmax. We also included detergent (0.01% Triton X-100) to minimize compound aggregation and false positive hits25. The screening conditions are described in Supplementary Table 1.
Our HTS workflow (Supplementary Fig. 6) started with 364,168 small-molecule compounds from the National Institutes of Health Molecular Libraries Small Molecule Repository. Using a primary screen, cheminformatic filtering of “pan-assay interference compounds” (PAINS)26, dose-response assays with OMFP and para-nitrophenylphosphate (pNPP) substrates, and counterscreens against class I tyrosine-specific lymphoid phosphatase (LYP) and class I dual-specific vaccinia H1-related phosphatase (VHR), we identified 17 hits. Retesting fresh powders against LMPTP, LYP and VHR revealed 3 confirmed hits with different scaffolds (Fig. 2a): MLS-0045954 (compound [Compd.] 1), MLS-0251308 (Compd. 2) and MLS-0322825 (Compd. 3). We selected Compd. 3 for further study based on potency and lack of promiscuity in a PubChem analysis. Dose-response assays for Compd. 3 are shown in Fig. 2b.
Figure 2. High-throughput screen of NIH chemical library identifies selective inhibitors of LMPTP.

(a) Chemical structures and IC50 values of screening hits. Mean±SD IC50 values from 4 experiments on LMPTP-A with compounds derived from solid powder using 3-O-methylfluorescein phosphate (OMFP) as a substrate are shown. (b) Dose-response curve of Compd. 3 on LMPTP-A with 0.4 mM OMFP (n=10 experiments) and 7 mM para-nitrophenylphosphate (pNPP; n=6) as substrates, and LYP (n=7) and VHR (n=6) with 0.4 mM OMFP as substrate. Each experiment was performed in duplicate. Mean±SD % inhibition is shown. (c) Chemical structures and IC50 values of select Compd. 3 analogs after medicinal chemistry. Mean±range IC50 values of Compd. 18 (n=6) and Compd. 23 (n=2) on LMPTP-A using OMFP as a substrate are shown.
Structure-activity relationship of LMPTP inhibitor series
We performed medicinal chemistry to improve potency of the Compd. 3 scaffold. Supplementary Table 2 shows structure-activity relationship (SAR) around the quinoline core. We first explored the alkylamino chain at the R1 position. Direct linkage to piperidine (Compd. 4) was less active, while a longer chain (Compd. 5) doubled the potency. Substitutions on the longer chain, such as pyrrolidine (Compd. 6) and morpholine (Compd. 7), were tolerated but less potent than piperidine. Fixing R1 as aminopropylpiperidine, we explored the R2 phenyl ring (Compds. 8–23). Substitutions at the 2-, 3- and 4- positions were tolerated, and some improved inhibition to the submicromolar range. Compd. 10 (4-methoxy substitution) was Molecular Libraries Probe ML40027. Compd. 18 (2-cyano substitution, Fig. 2c) was selected for structural studies since it was the most potent and highly soluble. Compd. 23 (4-diethylamide substitution, Fig. 2c) was chosen for in vivo studies as it displayed the best combination of potency and pharmacokinetics (PK). Substitutions on the quinoline core at the R3 position (Compds. 24–26) were poorly tolerated. Compounds in this series showed moderate to excellent plasma and microsomal stability (Supplementary Table 2). Taken together, through aminopropylpiperidine substitution at the R1 position on the quinoline core and varying substitutions at the R2 position on the phenyl ring, the potency of this LMPTP inhibitor scaffold was improved to the submicromolar range.
Selectivity of LMPTP inhibitor over other PTPs
We examined the selectivity of Compd. 23 against a panel of PTPs, including LMPTP-A and LMPTP-B, and class I tyrosine-specific and dual-specific PTPs6. We observed exquisite selectivity for LMPTP versus all PTPs tested, including PTP1B (Fig. 3a). Interestingly, Compd. 23 displayed greater potency on LMPTP-A versus LMPTP-B (Fig. 3a).
Figure 3. The LMPTP inhibitor series is selective and displays an uncompetitive mechanism of action.
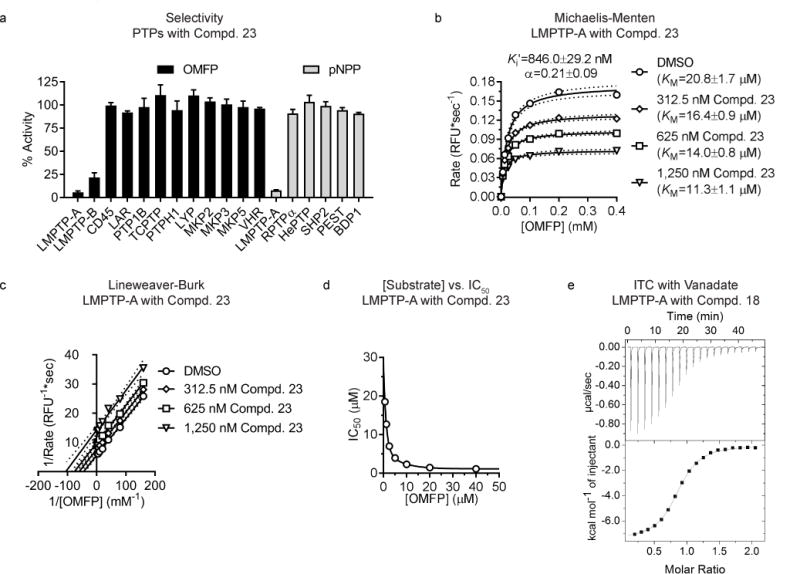
(a) Protein tyrosine phosphatases (PTPs) were incubated with 0.4 mM 3-O-methylfluorescein phosphate (OMFP) or 5 mM para-nitrophenylphosphate (pNPP) in the presence of dimethylsulfoxide (DMSO) or 40 μM Compd. 23. Mean±SEM % activity of PTPs incubated with Compd. 23 compared to DMSO from 3 independent experiments is shown. For each PTP, units of activity equivalent to 10 nM LMPTP-A were used. (b–c) Activity of 0.78 nM human LMPTP-A on increasing OMFP concentrations in the presence of increasing Compd. 23 concentrations. Data from 2 independent experiments performed in quadruplicate. (b) Mean reaction rate vs. OMFP concentration is shown. Lines show fitting to the Michaelis-Menten equation with 95% confidence intervals. (c) Lineweaver-Burk plot of data from (b). Lines show fitting to linear regression with 95% confidence intervals. (d) IC50 values were calculated for Compd. 23 on 0.78 nM human LMPTP-A-catalyzed hydrolysis of increasing concentrations of OMFP. Mean IC50 from 2 independent experiments performed in quadruplicate is shown. Lines show fitting to 2-phase decay. (e) Isothermal calorimetry (ITC) was performed on human LMPTP-A titrated with increasing Compd. 18 concentrations in the presence (3 replicates) or absence (4 replicates) of 200 μM sodium orthovanadate. Representative titration image in the presence of vanadate.
LMPTP inhibitor displays an uncompetitive mechanism
We addressed the mechanism of Compd. 23 using in vitro kinetic analysis, and deduced that LMPTP (purified protein is shown in Supplementary Fig. 7) was inhibited uncompetitively (Ki′=846.0±29.2 nM and α=0.21±0.09). Compd. 23 decreased Vmax and KM (Fig. 3b–c) and its potency increased with increasing substrate concentrations (Fig. 3d and Supplementary Fig. 8). We also confirmed that this series inhibited LMPTP reversibly with no evidence of tight-binding (Supplementary Fig. 8).
Uncompetitive inhibition implies preferential binding to an enzyme-substrate intermediate. PTP catalysis begins with nucleophilic attack by the active-site cysteine on the phosphate moiety of phosphotyrosine28. This cleaves the tyrosine-phosphate bond, yielding a covalent phosphocysteine intermediate that is hydrolyzed to generate the native enzyme and inorganic phosphate28. Using isothermal titration calorimetry (ITC) with Compd. 18, we observed weak, largely entropy-driven binding to LMPTP in Tris (Kd=8±2 μM; −TΔS=−6.4±0.3 kcal/mol) or phosphate buffer (Kd=10±2 μM; −TΔS=−5.6±0.3 kcal/mol). We generated a phosphocysteine mimetic by pre-incubating LMPTP with orthovanadate, which forms a stable covalent adduct with the active-site cysteine29. Inhibitor binding (Fig. 3e) increased 6–7-fold (Kd=1.4 μM) and was strongly enthalpy-driven (ΔH=−7±2 kcal/mol). These data were consistent with uncompetitive inhibition occurring through binding to the LMPTP phosphocysteine intermediate, blocking hydrolysis of the covalent intermediate and final release of phosphate product (Supplementary Fig. 9).
Structural determinants of LMPTP inhibitor binding
Since the backbone (Heteronuclear Single Quantum Coherence [HSQC] 15N-1H) assignments for human LMPTP-A were available30, we used solution NMR to map the inhibitor binding site. We collected HSQC data on human LMPTP-A and assigned backbone resonances for >50% of residues (Supplementary Fig. 10). Vanadate caused protein aggregation at acidic pH, so we performed experiments under saturating conditions (40 mM) of phosphate. We titrated LMPTP with Compd. 18 in phosphate buffer, and found that 8 residues displayed major dose-dependent, linear shifts in their resonance positions (G14, I16, R18, S47, G48, Y49, E50 and N53), while a further 7 residues underwent smaller shifts (L13, S19, A22, A74, R75, I77, and Y132; Supplementary Fig. 10). When mapped onto the crystal structure (described below), the largest shifts were adjacent to the active-site (Fig. 4a), and their location and distribution suggested a direct interaction rather than allosteric mechanism.
Figure 4. Structural determinants of LMPTP inhibition.

(a) Surface representation of human LMPTP-A showing phosphate (P) non-covalently bound in the active-site. Residues are colored according to magnitude of shift in the HSQC 15N-1H spectrum upon Compd. 18 titration (red>orange>green). Gray residues had negligible shifts or could not be assigned. (b) Crystal structure of bovine LMPTP W49Y/N50E bound to orthovanadate and Compd. 18 (cyan and blue sticks; Q=quinoline; Pip=piperidine; BN=benzonitrile; L=linker), with selected side-chains (yellow=carbon; red=oxygen; blue=nitrogen; pink=vanadium) and H-bonds/ionic interactions (dashed green/gray lines) shown. (c) Inhibition of phosphatase activity of LMPTP-A/mutants by Compd. 18 using 0.4 mM OMFP substrate. Mean±SD % activity is shown. Data is representative of 3 independent experiments. (d) Compd. 18 modeled into the crystal structure of phosphate-bound human LMPTP, based on an overlay with the bovine ternary complex crystal structure (RMSD=0.33 Å). Selected residues are colored by NMR shift as in (a). Dashed red line depicts predicted clash between apical oxygen (“A”) of phosphate and Q. (e–f) Structural rationale for SAR data, with atoms at 66% of their true radii. (e) “Side” view of pocket, rotated ~90° about a horizontal axis. The molecular surface has been sliced through the active-site to reveal the tight fit of Q in the pocket. Atoms with a formal charge (±) are labeled. BN is highly polarized, as indicated (δ±); arrows labeled “S” indicate solvent exposure of ring substitutions. (f) “Top” view looking down at the active-site pocket filled by Q. Arrow above atom N1 locates the “saddle-point” at pocket exit.
We next defined the interatomic interactions mediating the uncompetitive mechanism using crystallography. Attempts to co-crystallize Compd. 18 with human or mouse LMPTP-A only yielded native crystals (Supplementary Fig. 11 and Supplementary Table 3). These had dominant intermolecular lattice contacts obscuring the active-site, thus likely preventing inhibitor binding. We investigated crystal packing in closely-related species, and noted that in bovine LMPTP, the active-site was mostly free of lattice contacts29,31, allowing space for inhibitor to bind. The sequence identity between human LMPTP-A and bovine LMPTP is high (82%), and their 3-dimensional structures were very similar (root-mean-square deviation [RMSD] on main-chain atoms=0.28 Å). The binding site mapped by NMR contained only 3 residue differences: Y49->W, E50->N and N53->R (Supplementary Fig. 12). We “humanized” bovine LMPTP while maintaining its lattice contacts by generating a W49Y/N50E double-mutant. We chose not to replace R53 because it was involved in a crystal contact and most distal to the binding site. We confirmed that the double-mutant significantly increased the inhibitory potency of Compd. 18 compared with wild-type bovine enzyme (Supplementary Fig. 12).
We obtained crystals of the double-mutant under conditions similar to native bovine LMPTP29,31, and soaked them in orthovanadate solution, then in Compd. 18. Crystals diffracted to high resolution, and we solved the ternary structure at 1.86 Å resolution, leading to interpretable electron density for vanadate and Compd. 18 (Fig. 4b and Supplementary Fig. 13). In the ternary complex, vanadate formed a covalent adduct with the active-site C12. In contrast to binary complexes of LMPTP29 and PTP1B32,33 with vanadate, in which an S-VO4 moiety is observed with an axial (S-V-O) oxygen, in our ternary complex the axial oxygen was absent, leaving an S-VO3 moiety with tetrahedral geometry about the vanadium ion. Similar geometry was observed in the PTP1B-Q262A mutant phosphocysteine intermediate, which is deficient in the final hydrolysis step33. The substrate-binding “P-loop” and R18 side-chain provided a network of H-bonds that stabilized the intermediate (Supplementary Fig. 13). The Compd. 18 quinoline ring made contact with the vanadate moiety (~3.6 Å), with its aromatic faces sandwiched between Y131 (parallel aromatic stacking) at the back of the pocket and L13 and Y49 (hydrophobic packing) at the front (Fig. 4b and Supplementary Fig. 13). The sandwich was closed at the “right” end by D129, which packed closely against the quinoline ring, making a strong H-bond with the ring nitrogen. The pocket was shallower at the “left” end of the pocket, enabling the Compd. 18 linker segment to emerge, with its first amine group sitting atop the E50 side-chain. The linker was flexible beyond the first amine group, and several locations for the piperidine ring could be discerned (Supplementary Fig. 13). For clarity, only 1 orientation, consistent with the NMR data, is shown. E50 formed a long-range electrostatic interaction with the amino group of the linker; it is likely restrained from approaching closer by a salt bridge with unmutated bovine residue R53. The benzonitrile ring of Compd. 18 formed a perpendicular aromatic stacking interaction with Y132, whose side-chain lay above Y131 and completed the top of the active-site pocket (Fig. 4b).
We note that the shorter, uncharged N50 in bovine LMPTP should increase solvent exposure on the left “side” of the pocket compared with the longer, charged E50 in human, which can make stronger interactions with the positively charged linker. Also, the larger W49 side-chain of bovine LMPTP (Y49 in human) adopts a distinct orientation that cannot interact optimally with the quinoline ring. These observations may rationalize the reduced ability of Compd. 18 to inhibit native bovine enzyme (Supplementary Fig. 12) and explain the reduced inhibition of LMPTP-B versus LMPTP-A (Fig. 3a).
We tested the importance of Tyr residues in mediating inhibition by mutagenesis. Mutations in human LMPTP-A at Y49 and Y132 substantially reduced inhibition by Compd. 18, and mutation of Y131 alone or in combination with Y49 and Y132 completely abolished it (Fig. 4c). These data reinforce the key roles of these residues in mediating inhibition, and establish aromatic stacking between Y131 and the quinoline ring as an essential contributor.
Analysis of the NMR data in light of the crystal structures provides evidence that Compd. 18 binds similarly to human LMPTP-A. We determined the crystal structure of human LMPTP-A in phosphate buffer and observed tetrahedral phosphate bound non-covalently to the active-site cysteine (Fig. 4d and Supplementary Fig. 11). We overlaid the bovine ternary complex backbone with the human phosphate-bound structure, which are very similar (RMSD=0.33 Å). The phosphate phosphorus sits ~0.6 Å above the location of vanadium in the thiovanadate complex, but its axial oxygen extends 1.8 Å further outward. The protein overlay predicts a modest steric/electronic clash with the quinoline ring (minimum distance=2.5 Å). Conformational changes required to relieve this clash rationalize the weaker binding to Compd. 18 observed by ITC in the presence of phosphate versus vanadate (Fig. 3e), and NMR resonance shifts in P-loop residues may be attributable to this reorganization. NMR shifts at L13, the G48-Y49-E50 loop, Y132 and G133 are generally consistent with direct effects of Compd. 18 binding. The small shift in resonance of Y131, which makes critical interactions with the inhibitor, can be rationalized by the fact that its amide NH group forms a strong intramolecular H-bond largely unaffected by compound binding.
To further confirm the inhibitor binding region in solution, we performed hydroxyl radical footprinting (HRF)39,40, which allowed us to identify LMPTP side-chains with reduced solvent accessibility in the presence of inhibitor. Human LMPTP-A in phosphate buffer was exposed to X-rays in the absence and presence of Compd. 18 and analyzed by liquid chromatography mass spectrometry (LC/MS) and LC tandem mass spectrometry (LC/MS/MS). The change in modification for each amino acid side-chain in the presence of Compd. 18 was calculated as the modification rate in the absence of compound divided by the rate in the presence of compound. The modification ratios ranged from 0.9–2.2 with a median value of 1.2 (Supplementary Fig. 14). Consistent with our NMR and crystallographic data, the largest changes observed upon inhibitor binding were for residues L13 (KCtl/KCompd=2.1) and I16 (KCtl/KCompd=2.2) in the active-site, and Y131/Y132 (KCtl/KCompd=1.5) in the binding pocket.
Structure-based SAR of LMPTP inhibitor series
We analyzed our SAR data (Fig. 4e–f and Supplementary Table 2) in light of our new structural data. The quinoline ring makes a close “hand-in-glove” fit with the sides and base of the active-site pocket, rationalizing why substitutions on the quinoline ring are poorly tolerated (Compds. 24–26), since D129 (the base that catalyzes phosphocysteine hydrolysis) cannot form an H-bond with the ring nitrogen (Fig. 4e). In the linker (R1), the first group (N1 in Fig. 4f) is the key element. An amine is positively charged at neutral pH and can make ionic interactions with E50, while an uncharged ether (Compd. 27) or thioether (Compd. 28) cannot. The least active of the amine series (Compd. 4) has N1 in a piperidine ring, which is too large to fit. The most active R1-substituted analog (Compd. 5) has a long flexible linker with a positively charged ring that can interact with the negatively charged protein surface. Insertion of an electronegative oxygen into the ring (Compd. 7) decreases activity. The R2 phenyl ring has 3 unique substitution positions (2, 3 and 4 in Fig. 4f). The phenyl ring stacks closely against the aromatic ring of Y132, providing only 2 sterically feasible orientations. Substitutions at the 2-position generally decrease inhibition because they interact with the protein surface. Substitutions at the 3- and 4-positions point into the solvent and are well-tolerated (Fig. 4e). Compd. 18 is the only derivative at the 2-position with enhanced potency. The -CN substitution creates a benzonitrile moiety, which has an unusually high dipole moment caused by electron withdrawal from the phenyl ring to the -CN group. The resultant positive charge on the phenyl ring generates favorable interactions with the protein surface and other aromatic groups. Substitution by -CN at the 2- (Compd. 18) or 4-position (Compd. 20) or with amide groups -CONH2 (Compd. 22) and -CON(Et)2 (Compd. 23) at the 4-position generates the 4 highest-potency compounds, which have an unsaturated atom bound directly to the ring that is further linked to one or more electronegative atoms. This enables delocalization and polarization of the aromatic π orbitals toward the substituent. The effect is greater than for the highly electronegative -F, or -CF3, which can polarize but not delocalize the aromatic π orbitals. Other substitutions at the 3- and 4-positions have little effect on inhibitory potential.
Our structural data also explain the remarkable selectivity for LMPTP versus other PTPs. The interior active-site pockets of PTP1B and LMPTP phosphocysteine intermediates reveal distinct mechanisms of phosphocysteine hydrolysis (Supplementary Fig. 15). In PTP1B, the pocket broadens beneath the hydrophobic exterior33 so that Compd. 18 would not fill the active-site. In particular, 2 buried water molecules lying to one side of the active-site would be too far from Compd. 18 to be affected by its binding. In LMPTP, Compd. 18 completely fills the active-site and excludes all water, preventing D129 from acting as a base to activate a hydrolytic water molecule. PTP1B residue D181 is structurally but not functionally analogous to LMPTP-D129, as it serves as an acid to protonate the tyrosine leaving group in the first catalytic step. Instead, the side-chain of PTP1B-Q262 stabilizes the phosphocysteine intermediate and positions a water molecule close to the axial location for optimal nucleophilic attack on the phosphate.
LMPTP inhibitor increases hepatocyte IR phosphorylation
We examined whether this series inhibits intracellular LMPTP activity. We utilized IR activation loop tyrosine phosphorylation as a readout for LMPTP inhibition in human HepG2 hepatocytes. Treatment with 10 μM Compd. 23 substantially increased HepG2 IR phosphorylation after insulin stimulation (Fig. 5a–b and Supplementary Fig. 18), while treatment with Compd. 28, which was nearly inactive on LMPTP in vitro (Supplementary Table 2), had no effect (Fig. 5b).
Figure 5. Compd. 23 increases liver cell insulin signaling, is orally bioavailable and reverses diabetes in obese mice.

(a–b) HepG2 hepatocytes were incubated overnight with 10 μM compound (Compd.) or dimethylsulfoxide (DMSO) and stimulated with 10 nM insulin for 5 min or left unstimulated (Unst.). Insulin receptor (IR) tyrosine phosphorylation was assessed by (a) Western blotting of anti-IR immunoprecipitations (representative of 2 independent experiments) and (b) phosphoIR (pIR) ELISA (data from 5 independent experiments, Compd. 23: p=0.0079, Compd. 28: p=0.1667). (c–g) Diet-induced obese (DIO) male B6 mice were treated with 0.05% w/w Compd. 23 in high-fat diet (HFD) or HFD alone for 2 weeks. (c) Body weight during treatment (HFD, n=17; Compd. 23, n=13). (d) Intraperitoneal glucose tolerance test (IPGTT), p=0.0162 (HFD, n=8; Compd. 23, n=6). (e) Fasting plasma insulin levels, relative to littermates fed HFD, p=0.0235 (HFD, n=4; Compd. 23, n=4). (f–g) Mice were injected intraperitoneally with insulin and livers harvested after 10 min. (f) Liver IR tyrosine phosphorylation, p=0.0002 (HFD, n=7; Compd. 23, n=6). (g) Western blot of liver homogenates (HFD, n=3; Compd. 23, n=3). (h–i) DIO liver-specific LMPTP KO mice were treated with Compd. 23 (HFD, n=6; Compd. 23, n=6) as in (c–g). (h) IPGTT, p=0.6120. (i) Liver IR tyrosine phosphorylation, p=0.2791. (b–f,h–i) Mean±SEM. *, p<0.05; NS, non-significant (p≥0.05): (b) Kolmogorov-Smirnov test, (d,h) Two-Way ANOVA, (e) two-tailed unpaired t-test with Welch’s correction, (f,i) one-tailed unpaired t-test with Welch’s correction. (a,c) Full gels are shown in Supplementary Figure 18
Oral bioavailability of LMPTP inhibitor
During our SAR studies, we observed that Compd. 23 displayed a good combination of potency and solubility, and excellent rodent PK upon intraperitoneal (IP), intravenous (IV) and oral gavage (PO) dosing, with good oral bioavailability (F%=45) and a long half-life (~5 hr) (Supplementary Fig. 16). We tested whether Compd. 23 could be administered as a food admixture at 0.01, 0.03 and 0.05% w/w concentrations mixed with rodent chow (equivalent to 10, 30 and 50 mg/kg/day). PK analysis revealed that after 5 days, treatment with 0.03% w/w Compd. 23 resulted in ~680 nM mean serum concentration, while treatment with 0.05% w/w resulted in >3 μM; importantly, mouse body weight was unaffected by Compd. 23 administration at all doses tested (Supplementary Fig. 16).
LMPTP inhibitor reverses diabetes in mice
We examined whether treatment with Compd. 23 would reverse high-fat diet-induced diabetes in mice. Since the IC50 for Compd. 23 is 800 nM (Supplementary Table 2), we chose 0.05% w/w to sustain sufficient systemic concentrations. We administered Compd. 23 in HFD chow to diabetic DIO mice for 2 weeks and assessed glucose tolerance and fasting insulin levels. Treatment with Compd. 23 significantly improved glucose tolerance and decreased fasting insulin levels of diabetic DIO mice, without affecting body weight (Fig. 5c–e). We found similarly improved glucose tolerance after 2 additional weeks of treatment (Supplementary Fig. 17). We next examined whether in vivo Compd. 23 treatment increased activation of liver IR signaling. As shown in Figure 5f–g and Supplementary Fig. 18, treatment of mice with Compd. 23 for 2 weeks significantly increased liver IR phosphorylation and augmented downstream activation of AKT and ERK.
To confirm that these effects were due to inhibition of LMPTP, we treated DIO mice carrying liver-specific LMPTP KO with Compd. 23 and assessed glucose tolerance and liver IR phosphorylation levels. Strikingly, we found that neither glucose tolerance nor insulin-induced liver IR phosphorylation were affected by Compd. 23 treatment (Fig. 5h–i). These results strongly suggest that Compd. 23 reversed diabetes by specifically inhibiting LMPTP activity in the liver.
Our data demonstrate that Compd. 23 is orally bioavailable and effectively inhibits LMPTP activity in vivo when administered in food, without causing overt toxicity or weight loss. We conclude that chemical inhibition of LMPTP activity reverses disease in a mouse model of obesity-induced diabetes through an action on the liver, recapitulating the phenotype of mice carrying global or liver-specific LMPTP KO.
Discussion
Obesity is frequently complicated by insulin resistance and type 2 diabetes1,2. Development of insulin-sensitizing agents to minimize the need for injectable insulin remains a major unmet medical need. LMPTP has been proposed to inhibit insulin signaling, and human genetics studies suggest that high LMPTP activity promotes diabetes. We report that LMPTP promotes high-fat diet-induced insulin resistance and diabetes through an action on the liver. We found that LMPTP deletion enhanced insulin-induced liver IR signaling, suggesting LMPTP acts by suppressing IR activation in the liver. This is supported by evidence that chemical inhibition of LMPTP activity increases insulin-induced activation of the liver IR and downstream signaling pathways, and improves glucose tolerance in obese mice.
Our study exemplifies the importance of discovering specific PTP inhibitors with in vivo activity to firmly establish the physiological role of PTPs and their potential as drug targets. Substantial progress has been made towards increasing potency of chemical LMPTP inhibitors18–22. However, the lack of selectivity of published compounds has limited their usefulness in studying LMPTP functions in vivo. Our new LMPTP inhibitors display excellent drug-like properties and represent strong leads for further optimization.
Although our inhibitors bound LMPTP at the opening of the active-site pocket, unlike the majority of previous phosphatase inhibitors16,17, they lack a phosphate-mimic active-site binding group. Data derived from enzymatic, biophysical and mutagenesis studies on this series are consistent with an uncompetitive mode of LMPTP inhibition. These compounds do not compete for binding with a phosphotyrosine substrate; rather, they bind most tightly to the phosphocysteine intermediate, mimicked here by the LMPTP-vanadate complex. They fully occupy the pocket above the LMPTP active-site, excluding access of water required for the final hydrolysis step in catalysis. Early NMR studies elegantly described a preformed active-site for LMPTP, demonstrating that while the apo-enzyme showed some disorder in the N-terminal helix, saturating levels of phosphate caused a local disorder-to-order transition in the helix34. Addition of vanadate produced an identical effect on the helix, and no other effects on the structure beyond the active-site cysteine and its immediate environment34. In our ITC experiments, binding of Compd. 18 to LMPTP was enthalpy-driven when vanadate was pre-bound, but entropy-driven in its absence. This suggests that vanadate binding creates a more rigid environment that enables Compd. 18 to bind in a unique conformation, contributing to its specific binding.
Our structural data allow us to formulate a rationale for the uncompetitive nature of these inhibitors. Although they can bind to the free enzyme with modest affinity, binding of the free enzyme to negatively charged phosphotyrosine substrate is preferred, owing to favorable electrostatic interactions conferred by the positive charge on R18 and the positive end of the helix 1 dipole. Following nucleophilic attack on the substrate and cleavage of the phosphotyrosine bond, a negatively charged phosphocysteine (S-PO32−) intermediate is created, which neutralizes the positive charge in the pocket. This configuration facilitates inhibitor binding, which is dominated by aromatic/hydrophobic interactions with the deep front and back of the pocket and anchored on 2 sides by electrostatic interactions. The inhibitor fills the active-site cavity completely, forming a “hand-in-glove” water-tight seal. The S-PO32− moiety lacks an axial phosphate oxygen, enabling the edge of the quinoline ring to approach closely and ensure steric occlusion of water. The H-bond between the quinoline ring and D129 prevents hydrolysis while the inhibitor is bound to the enyzme. The benzonitrile ring attached to the quinoline ring provides further anchorage and steric occlusion of water at this side of the pocket.
In conclusion, we performed the first characterization of the metabolic role of LMPTP and report discovery of a selective LMPTP inhibitor series and the first orally bioavailable LMPTP inhibitor. Although further studies on LMPTP in insulin signaling are warranted, our data establish LMPTP as a key promoter of obesity-induced diabetes and drug target for obesity-associated insulin resistance. Our LMPTP inhibitor will be instrumental for further understanding the biology of LMPTP in vivo. We envision that the information we collected about its mechanism of action and binding mode will pave the way for development of LMPTP inhibitors suitable for therapeutic testing in human diabetes. Since LMPTP has also been proposed to promote heart failure23 and tumor growth35, such inhibitors are predicted to have a wide range of therapeutic applications.
Online Methods
Antibodies and other reagents
The anti-LMPTP antibody (Ab) was described in 23. The anti-GAPDH (clone D16H11XP; catalog #5174), anti-pAKT-T308 (catalog #9275), anti-pAKT-S473 (catalog #9271) and anti-pERK-T202/Y204 (catalog #9101) Abs were purchased from Cell Signaling Technology. The anti-IRβ Ab was purchased from Santa Cruz Biotechnology (clone C-19; catalog #sc-711) and the anti-pIR/pIGFR-Y1162/Y1163 Ab was purchased from Life Technologies (catalog #44-804G). Primary antibodies were used at 1:1000 dilution for Western blotting. HRP-conjugated anti-rabbit and anti-mouse IgG Abs were purchased from GE Healthcare (catalog #NA934-1ML and NA931-1ML respectively) and used at 1:3000 dilution. Unless otherwise specified, chemicals and all other reagents were purchased from Sigma-Aldrich.
Mice
Animal experiments were conducted in accordance with Animal Care and Use Committee-approved protocol at the La Jolla Institute for Allergy & Immunology (#AP126-NB3). C57BL/6 (B6) mice were purchased from Jackson Laboratory (JAX #000664). Generation of Acp1 gene-trapped mice was previously described23. Acp1 heterozygous mice were backcrossed onto the B6 background for >10 generations. Acp1 floxed (Acp1fl) mice were generated by insertion of LoxP sites in intronic sequences flanking exons 2 and 4 at the University of California Davis (UC Davis) Mouse Biology Program. The Acp1 targeting vector was constructed by the UC Davis MBP using previously described methods36. MBP electroporated the vector into B6 derived embryonic stem (ES) cells available from the KOMP Repository. Resulting ES cell clones were screened for loss of native allele, homologous recombination by Long Range PCR, and carriage of a single copy of the plasmid. Several clones were identified by these 3 screens. Five clones were further screened and determined to be between 67–100% euploid via simple chromosome spread and count. Cells of these clones were microinjected into BALB/cAnNHsd blastocysts, and transferred to e2.5 stage pseudopregnant recipients. Resulting chimeras were screened for % ES cell-derived coat color, and those greater than 50% were mated to B6 females. Germline mice heterozygous for the Acp1 targeted mutation were produced. Further breeding to Flp-e expressing mice to remove the Neo selection cassette was also performed. Flipped Acp1fl mice were bred with B6 mice to obtain heterozgous Acp1fl mice, which were interbred to obtain homozygous Acp1fl/fl mice. Acp1fl/fl mice were bred with B6 mice (obtained from Jackson Laboratory) carrying Cre recombinase expression under the albumin (liver-specific; JAX #003574), adiponectin (adipocyte-specific; JAX #010803), lysozyme 2 (macrophage-specific; JAX #004781) or muscle creatine kinase (skeletal muscle-specific; JAX #006475) promoters. Sequences of primers used for genotyping the Acp1fl mice are listed in Supplementary Figure 2. For assessment of diabetes in mice, sample sizes of n≥5 were sought in order to achieve sufficient power to detect a biologically relevant difference between groups being analyzed. In all experiments, littermate animals from at least 2 independent litters were used. To generate diet-induced obese (DIO) mice, male littermate mice were fed high-fat diet (HFD) chow containing 60 kcal % fat (Research Diets) for 3 months starting at 4–8 weeks of age. DIO littermate mice weighing ≥35 g were used for experimental analysis. Blinding was not possible during this study.
Western blotting of mouse tissue homogenates
Mouse tissues were harvested and homogenized in 1X Cell Lysis Buffer (Cell Signaling Technology). Homogenates were sonicated at 4°C for 10 intervals of 30 sec. Insoluble fractions were cleared by centrifugation. Prior to SDS-PAGE, protein concentration of lysates was assessed using the Pierce BCA Protein Assay Kit (Thermo Scientific).
Diabetes assessment of DIO mice
For the intraperitoneal glucose tolerance test (IPGTT), DIO mice were fasted overnight for 13 hr and administered 1 g glucose/kg body weight by intraperitoneal (IP) injection. Tail ends were snipped 1 hr before glucose injection. Blood glucose levels were obtained from a small drop of blood from tail snip right before glucose injection and at the indicated time points after glucose injection using a OneTouch glucometer. For measurement of fasting blood insulin levels, mice were fasted overnight for 13 hr and blood was collected from the facial vein. Plasma insulin levels were assessed using the Ultra Sensitive Mouse Insulin ELISA kit (Crystal Chem).
Assessment of plasma lipid levels in DIO mice
For measurement of plasma lipid levels, blood was collected from DIO mice from the facial vein. Plasma triglyceride, cholesterol, and non-esterified fatty acid (NEFA) levels were assessed using the LabAssay™ Triglyceride assay (Wako Chemicals USA), Cholesterol E assay (Wako Diagnostics) and HR Series NEFA-HR assay (Wako Diagnostics), respectively.
Assessment of hepatic steatosis in DIO mice
Livers from male DIO littermate mice were frozen in optimal cutting temperature compound (OCT). Liver sections were cut at 5 μm using a Microm HM 505 E Cryostat (GMI), stained with Oil Red O (ORO) and embedded with Aquamount using #1.5 cover glasses. Slides were scanned on an AxioScan Z1 slide scanner (ZEISS) using a 20x 0.8 numerical aperture objective. Liver autofluorescence was detected in the green channel (excitation: 470/40 nm; dichroic: 495 nm; emission: 525/50 nm), and ORO was detected in the red channel (excitation: 550/25 nm; dichroic: 570 nm; emission: 605/70 nm). The Orca Flash 4.0 v2 camera was used to capture the fluorescent images. Data was acquired with the ZEN 2 slidescan module (ZEISS). Histogram stretching was applied in ZEN 2 to improve contrast on all images. Stitched images were then exported as 100 tiles and of the images that contained regions of tissues, twenty were randomly selected for analysis with ImagePro Premier (v9.1.4, Media Cybernetics). Spatial calibration (0.325 μm per pixel) was applied to images and total tissue area was determined by autofluorescent signal in the green channel. The percent of ORO-positive tissue area was calculated using ImagePro Premier.
Insulin-stimulated liver insulin receptor phosphorylation assay
Mice were injected IP with 10 U insulin (Eli Lilly)/kg body weight, and after 10 min mouse livers were harvested and flash frozen. Tissues were homogenized and processed into lysates as described above. Insulin receptor (IR) tyrosine phosphorylation was assessed using the PathScan Phospho-Insulin Receptor β (Y1150/Y1151) Sandwich ELISA Kit (#7258C, Cell Signaling Technology).
High-throughput screen for LMPTP inhibitors
Details regarding the National Institutes of Health Molecular Libraries Small Molecule Repository chemical library, high-throughput screen (HTS) protocol, and protocols for confirmatory and counter screening assays are described in Supplementary Table 1. A cDNA encoding mouse LMPTP-A (protein reference sequence NP_067305.2) was cloned into the pET28a vector using EcoRI. Cells were grown to optical density (OD600) 0.6 and induced with isopropyl β–D-1-thiogalactopyranoside (IPTG) for 4 hr at room temperature. Pellets were resuspended in 20 mM Tris pH 8 with 500 mM NaCl, 5 mM imidazole, 2.5% glycerol, and 1X protease inhibitor cocktail and lysed with a homogenizer. After clearing the insoluble fraction, supernatants containing His-tagged LMPTP-A were incubated with Ni-NTA beads (Qiagen) for 1 hr at 4°C. Beads were washed extensively and LMPTP-A protein was eluted off the beads using 20 mM Tris pH 8 with 250 mM NaCl, 250 mM imidazole and 5 mM β-mercaptoethanol. The eluted protein was then further purified by gel filtration on a Superdex 75 column. The protein was concentrated to ~2 mg/ml and flash frozen and stored at −80°C. Purifications of recombinant vaccinia H1-related phosphatase (VHR)37 and the catalytic domain of the lymphoid phosphatase (LYP)38 were performed as described.
Chemical synthesis
Chemical synthesis of compounds described in this work can be found in the Supplementary Note.
Generation of recombinant proteins for selectivity and mechanistic assays
cDNAs encoding mouse and human LMPTP-A (protein reference sequences NP_067305.2 and NP_004291.1) and bovine LMPTP (protein reference sequence NP_776403.1) were codon-optimized for E. coli, synthesized, and cloned into the pGEX-4T vector using BamHI/EcoRI by Genscript. Mutagenesis was performed by Genscript. Cells were grown to OD600 0.6 and induced with IPTG at 15°C overnight. Pellets were resuspended in 20 mM Tris pH 8, with 150 mM NaCl, 10 mM DTT and 1X protease inhibitor cocktail, and cells were lysed using a French Press. After clearing the insoluble fraction, supernatants were incubated with glutathione (GSH)-sepharose beads (GE Healthcare Life Sciences) for 2 hr at room temperature. Beads were washed extensively, and LMPTP protein was cleaved off the beads with thrombin overnight at 4°C. Cleaved protein was then further purified using a MonoQ anion exchange column, followed by gel filtration on a Superdex S200 column. Monodisperse protein was concentrated to 10–20 mg/ml, then flash frozen in liquid nitrogen and stored at −80°C. A cDNA encoding mouse LMPTP-B (protein reference sequence NP_001103709.1) was cloned into the pET28a vector using EcoRI, and purified as described for the His-tagged mouse LMPTP-A used for HTS. A cDNA encoding human LMPTP-B (protein reference sequence NP_009030.1) was cloned into the pEGST vector39, and purification was performed as described for GST-tagged proteins40. Humanized bovine LMPTP (W49Y/N50E mutant) contained 2 residues (GS) from the expression vector in place of the first methionine at the N-terminus. Human and mouse LMPTP-A included the same GS residues, but N-terminal to the first methionine. Purifications of recombinant HePTP41 and PTP-PEST40 catalytic domains were performed as described. All other recombinant PTP enzymes were purchased from Enzo Life Sciences or MBL International.
Enzymatic assays
Phosphatase assays were performed in buffer containing 50 mM Bis-Tris, pH 6.0, 1 mM DTT and 0.01% Triton X-100 at 37°C. For assays conducted with 3-O-methylfluorescein phosphate (OMFP) as substrate, fluorescence was monitored continuously at λex=485 and λem=525 nm. For assays conducted with para-nitrophenylphosphate (pNPP) as substrate, the reaction was stopped by addition of 2X reaction volume of 1 M NaOH, and absorbance was measured at 405 nm. IC50 values were determined from plots of inhibitor concentration versus percentage of enzyme activity. For inhibitor selectivity assays, each PTP was incubated with either 0.4 mM OMFP or 5 mM pNPP in the presence of 40 μM compound or DMSO. Equal units of enzyme activity, comparable to the activity of 10 nM human LMPTP-A, were used. For the inhibitor reversibility assay, 50 nM human LMPTP-A was pre-incubated with10 μM compound or DMSO for 5 min. The enzyme was diluted 100X in phosphatase assay buffer containing 0.4 mM OMFP and fluorescence was measured at the indicated time points.
Isothermal Titration Calorimetry (ITC)
Experiments were performed at 23°C using an ITC200 calorimeter (Microcal) in a buffer containing 10 mM Tris pH 7.5, 75 mM NaCl, 0.5 mM β-mercaptoethanol and 5% DMSO. Aliquots (2 μl) of 0.5 mM compound were injected into the cell containing 50 μM LMPTP in the presence or absence of 200 μM sodium orthovanadate. Experimental data were analyzed using the Origin software package (Microcal).
Nuclear magnetic resonance (NMR)
15N1H-Heteronuclear Single Quantum Coherence (HSQC) spectra were collected from human LMPTP-A. Uniformly 15N-labeled recombinant protein was expressed and purified as described above, except that minimal media was employed, supplemented with 1 g/L 15N-NH4Cl as the sole source of nitrogen. All protein solutions were freshly prepared and contained 0.35–0.5 mM enzyme, 20 mM NaCl, 40–90 mM sodium phosphate and 10 mM sodium acetate at pH 5.1, similar to the conditions used to obtain backbone assignments30. Samples contained 2% DMSO and Compd. 18 at concentrations of 0, 0.1, 0.2, or 1 mM. 2D 15N1H-HSQC NMR spectra were recorded at 25°C on a Bruker Avance 600 MHz NMR spectrometer equipped with a TCI cryoprobe. Spectra were processed and analyzed with SPARKY (https://www.cgl.ucsf.edu/home/sparky/) NMR software. The published NMR peak assignments of human LMPTP-A30 were used to assign backbone (15N1H) resonances. The addition of 2% DMSO had little effect, as seen by the consistency of 15N1H resonances in our compound-free spectra with the published data (Supplementary Fig. 9). Titration of the protein solution with the compound allowed unambiguous assignment of the shifted 15N1H resonances. Only 16 residues of LMPTP (V11, C12, 63MKRH66, R97, D98, R101, Y119, D120, Q122, K123, P131, S136, K155) are not assigned (in addition to the 5 proline residues -P20, P54, P55, P69, P121- that lack an N-H proton). With the exception of V11 and C12, none of the unassigned residues are close to the compound binding site.
Crystallization and structure solution
All LMPTP proteins were crystallized at room temperature using the sitting drop vapor diffusion method. Protein data bank (PDB) codes, crystallization data and refinement statistics for all structures are shown in Supplementary Table 3. Human LMPTP-A was crystallized in its apo form and in complexes with phosphate and 2-(N-morpholino)ethanesulfonic acid (MES) using the same methodology. Crystals of the apoenzyme were obtained by mixing 0.2 μl of 10 mg/ml human LMPTP-A in 20 mM Tris buffer, pH 8.0, 150 mM NaCl, 2.5 mM DTT with an equal volume of the well solution (7% (w/v) polyethylene glycol (PEG) 10K, 100 mM Bis-Tris pH 5.5, 100 mM NH4 acetate), and then equilibrated against a large reservoir of well solution. Co-crystals with phosphate were obtained in a similar fashion, but the protein was in 40 mM sodium phosphate buffer, pH 6.7, 100 mM NaCl, 0.7 mM tris(2-carboxyethyl)phosphine (TCEP), and the well comprised 25% (w/v) PEG 3350 and 200 mM NaCl. For co-crystals with MES, protein was in 40 mM MES buffer, pH 6.5, 100 mM NaCl, 0.7 mM TCEP and the well comprised 20% PEG 3350 and 200 mM NaCl. In all cases, crystals grew within 3–5 days, and were transferred briefly to a cryoprotection buffer containing 20% glycerol, picked up in loops, and immediately flash-frozen in liquid nitrogen for X-ray diffraction data collection.
Mouse LMPTP-A (mLMPTP-A) was crystallized in hanging drops by mixing 0.3 μl of 7 mg/ml protein in 20 mM Tris buffer, pH 8.0, 150 mM NaCl and 2.0 mM DTT, with 0.15 μl of well solution (20% PEG 3350 and 200 mM sodium citrate), before equilibrating against the well solution. Crystals grew in 5 days, and were next soaked in a buffer containing 1 mM Compd. 18 in 30 mM sodium phosphate, 20% PEG 3350, 200 mM sodium citrate, 150 mM NaCl and 20 mM Tris-Cl buffer at pH 8.0 for 4 hr. Next, 20% glycerol was added as a cryoprotectant, and after a short incubation, crystals were picked up in loops and flash-frozen in liquid nitrogen prior to data collection. However, Compd. 18 was not observed in the final electron density maps.
Crystals of the “humanized” bovine LMPTP (double mutant W49Y/N50E) were obtained by mixing 0.2 μl of 10 mg/ml LMPTP in 15 mM Tris buffer, pH 7.8, 40 mM Na-MES, 100 mM NaCl, and 0.7 mM TCEP, with 0.2 μl of the crystallization buffer (20% PEG 3350 and 0.2 M NaCl), and equilibrated against the same buffer. Crystals grew within 5 days, and were then soaked in a cryoprotectant buffer (25% PEG 3350, 20 mM Tris pH 7.6, 0.15 M NaCl and 20% glycerol) containing 0.3 mM sodium orthovanadate and 0.5–2.0 mM Compd. 18 for 4 hr before being flash-frozen in loops. Control crystals of humanized bovine LMPTP were obtained under the same conditions, except 4-(2-hydroxyethyl)-1-piperazineethanesulfonic acid (HEPES) was used in place of Tris buffer.
All diffraction data were collected from single crystals at ~100K. The data set for the PDB entry 5JNR (Supplementary Table 3) was collected using the Rigaku diffractometer with R-AXIS HTC detector and Confocal Max-Flux optics (wavelength 1.54 Å), the data sets for 5JNU, 5JNV and 5JNW were collected at the Stanford Synchrotron Radiation Laboratory (SSRL), beamline 9-2 (wavelength 0.9791 Å), and the data sets for 5JNS and 5JNT were collected at the Advanced Light Source (ALS) beamline SIBYLS, at Berkeley (wavelength 1.0781 Å), and processed using XDS42 and the CCP4i program suite43. The structures were solved using the molecular replacement program, PHASER44, with LMPTP structures (PDB ID: 3N8I and 1PNT) as search models. Refinement and manual rebuilding were done with Refmac545 and Coot46. The refinement used default parameters of Refmac5, water molecules were added automatically at Fo-Fc level equal to 2 σ, and validated to be in the 2Fo-Fc map at a level above 1 σ and at proper distances from polar and nonpolar atoms. At the end of refinement, all water molecules were validated manually using Coot. The initial model and force field parameters for Compd. 18 were built using ChemBioDraw and Phenix47. The parameters for PO4, MES and HEPES were taken from the Refmac5 library of compounds. The vanadate model was built using PO4 as a template and then refined with only restrained bonds to vanadium (2.5 Å from sulfur of cysteine and 1.8 Å from oxygens).
Data collection and refinement statistics are presented in Supplementary Table 3. To be consistent with previously published LMPTP structures, the second residue (Ala) of the native protein was defined as “Residue 1” (note that the first 5–6 residues were disordered in all crystal structures). 96–99% of residues in all structures are in favored regions of the Ramachandran plot, and no residues fall into disallowed regions.
We collected several data sets from humanized bovine LMPTP crystals soaked in vanadate and different concentrations of Compd. 18 (0.5–2 mM), and found that the electron density for the compound was similar in all structures. There is clear density for the vanadate adduct, quinoline ring and its immediate linkages, which are buried in or close to the active-site. The humanized bovine LMPTP crystal form has similar intermolecular packing to the published wild-type bovine LMPTP29,31, but 2 active-sites from symmetry–related molecules are brought into closer apposition, which is reflected in the liganded and unliganded structures. The high resolution of the latter enables 2 distinct conformations for the main-chains of certain loops, as well as surface side-chains at the interface, induced by crystal packing, to be modeled in line with a stochastic distribution of 2 similar but distinct conformations across the crystallographic dyad, each with 50% occupancy. In the liganded structure, orthovanadate is bound with 100% occupancy, simultaneous occupancy of both sites by Compd. 18 across the dyad is restricted by steric interference. We have therefore assumed that the 2 apposing sites are also occupied stochastically with 50% occupancy. Notwithstanding, model-independent omit maps are of excellent quality for the quinoline ring and its attachment point to the R2 and R3 substituent groups, and their locations provide independent objective positioning of the quinoline ring, given the tight steric and electronic constraints of the active-site pocket. A principal location of the R2 linker and distal piperidine ring are well-determined by the electron density (omit map); however, there is evidence of a second conformation for R2 in which the piperidine ring inserts into the neighboring active-site (at the expense of quinoline binding). The second conformation is clearly a crystal artifact, but both models are provided in the PDB file. The electron density is somewhat less well-defined for the benzonitrile ring, owing in part to its location close to the dyad axis (where the density is inherently ambiguous), but its direct linkage to the quinoline ring and steric constraints imposed by the protein enable its configuration to be modeled with confidence.
Hydroxyl radical footprinting (HRF)
The human LMPTP protein and Compd. 18 were diluted in 1X phosphate-buffered saline (PBS), pH 7.4. Compd. 18 was added to LMPTP (5 μM final concentration) at a protein:compound molar ratio of 1:50. Radiolysis experiments were performed at beamline 3.2.1 of the Advanced Light Source, Lawrence Berkeley National Laboratory. The X-ray beam parameters were first optimized using an AlexaFluor-488 fluorophore assay as previously described48. All samples were exposed for 0, 25, 50 and 100 milliseconds at ambient temperature, in which hydroxyl radicals generated from exposure to X-ray beams modify the solvent-exposed amino acid side-chains49–51, and then immediately quenched with methionine amide (10 mM final concentration) to prevent secondary oxidation52. After radiolysis, protein solutions were stored at −80°C until analysis. Irradiated protein solutions were reduced with 10 mM DTT at 56°C for 45 min and alkylated with 25 mM iodoacetamide at room temperature in the dark for 45 minutes. Next, all samples were digested with both lysyl endopeptidase (Wako Chemicals USA) at 37°C for 4 hr and modified trypsin (Promega) at 37°C for 12 hr at an enzyme:protein molar ratio of 1:10. The digestion reaction was terminated by adding formic acid (0.1% final concentration). Liquid chromatography mass spectrometry (LC/MS) analysis of irradiated digested samples was carried out on an Orbitrap Elite mass spectrometer (Thermo Electron) interfaced with a Waters nanoAcquity UPLC system. A total of 3 pmol of proteolytic peptides were desalted on a 180 μm × 20 mm trap column packed with C18 Symmetry (5 μm, 100 Å) and subsequently eluted on a 75 μm × 250 mm reverse phase nano column packed with C18 BEH130 (1.7 μm, 130 Å) using a gradient of 2 to 45% mobile phase B (0.1% formic acid and acetonitrile [ACN] and mobile phase A [100% water/0.1% formic acid]) over a period of 60 min at 37°C with a flow rate of 300 nl/min. Peptides eluted from the column were introduced into the nano-electrospray source at a capillary voltage of 2.5 kV. For MS analysis, a full scan was recorded for eluted peptides (m/z range of 350–1800) in the Fourier transform mass analyzer with resolution of 120,000 followed by tandem MS (MS/MS) of the 20 most intense peptide ions scanned in the ion trap mass analyzer. All MS data were acquired in the positive ion mode. Protein digestion and mass spec analysis were performed in duplicate for each sample. Detected ion currents for tryptic peptides in MS experiments were used to determine the extent of oxidation for each modified site by separate quantification of the unmodified peptides and their radiolytic products. Tandem MS spectra were acquired to identify specific sites of modification. The resulting MS/MS data were initially searched against a human LMPTP protein database using Mass Matrix software53 with mass accuracy values of 10 ppm and 0.8 Daltons for MS and MS/MS scans, respectively, and allowed variable modifications including carbamidomethylation for cysteines and all known oxidative modifications previously documented for amino acid side-chains50,51. In addition, MS/MS spectra for each site of proposed modification were manually examined and verified. Of 13 total tryptic peptides observed for the LMPTP protein (resulting in 85% sequence coverage), a total of 27 unique residues, found in 11 peptides, exhibited modification in the absence or presence of compound. These residues were distributed throughout the protein sequence, thus providing sufficient coverage of the LMPTP protein. First order modification rate constants for the modified residues were derived from dose-response curves obtained by plotting the unmodified fraction for each probe as a function of exposure time49,54. The relative change in LMPTP modification for each amino acid side-chain in the presence of Compd. 18 was calculated as the ratio of the modification rate of LMPTP in the absence of the compound divided by the modification rate of LMPTP in the presence of compound.
IR phosphorylation in HepG2 cells
Human HepG2 cells (American Type Culture Collection [ATCC] catalog #HB-8065) were cultured in Eagle’s Minimal Essential Medium (ATCC) containing 10% fetal bovine serum (FBS), 100 U/ml penicillin and 100 μg/ml streptomycin. The HepG2 cell line is not listed as a misidentified cell line in the database by International Cell Line Authentication Committee. The cell line was not further authenticated after purchase from the ATCC. The absence of Mycoplasma contamination in HepG2 cultures was confirmed using the Lonza MycoAlert Mycoplasma Detection Kit (catalog #LT07-218). Cells were treated with 10 μM Compd. 23 or Compd. 28 in serum-starvation media (0.1% FBS) overnight, following which cells were stimulated with 10 nM bovine insulin (Sigma) for 5 min at 37°C. For detection of IR tyrosine phosphorylation by immunoprecipitation/Western blotting, cells were lysed in radioimmunoprecipitation assay buffer containing 1 mM phenylmethylsulfonyl fluoride, 10 μg/ml aprotinin/leupeptin, 10 mM sodium orthovanadate, 5 mM sodium fluoride, and 2 mM sodium pyrophosphate, and the IR was immunoprecipitated using the anti-IRβ Ab. IR tyrosine phosphorylation of immunoprecipitates was determined by Western blotting with the anti-pIR/pIGFR-Y1162/Y1163 Ab. Full, uncut gel images are shown in Supplementary Figure 18. For detection of IR tyrosine phosphorylation by ELISA, cells were lysed and IR phosphorylation was assessed using the PathScan Phospho-Insulin Receptor β (Y1150/Y1151) Sandwich ELISA Kit.
Pharmacokinetics (PK)
Compound was administered to male B6 mice at 5 mg/kg intravenously (IV), 10 mg/kg IP and 30 mg/kg via oral gavage (PO) in DMSO:Tween80:Water (5:5:90) as a clear solution at 2 mg/mL (IP), 5 mg/mL (IV) and 6 mg/mL (PO), or compound powder was mixed in chow at 0.01%, 0.03%, or 0.05% w/w. Plasma was collected at the indicated time points and analyzed for compound concentration via LC/MS/MS.
Treatment of DIO mice with Compd. 23
Compd. 23 was administered to male B6 or Acp1fl/fl albumin-Cre+ DIO mice at 0.05% w/w in HFD rodent chow. Control groups consisted of male B6 or Acp1fl/fl albumin-Cre+ littermate mice administered HFD rodent chow alone. Mice were allowed food and water ad libitum and weighed daily. Randomization was not used in these experiments; rather littermate mice were assigned to treatment or control groups in a manner to maintain similar mean body weights between the 2 groups at the start of the study. Insulin-induced liver IR phosphorylation, IPGTT and fasting insulin levels were assessed after treatment as described above. Diabetic (displaying overnight [13 hr] fasting blood glucose levels ≥140 mg/dL) B6 DIO mice were used in experiments to assess IPGTT and fasting insulin levels.
Statistical Analysis
Sample sizes were selected based upon our experience with the assays being performed in order to achieve sufficient power to detect biologically relevant differences in the experiments being conducted. The two-way analysis of variance (ANOVA), unpaired t-test, unpaired t-test with Welch’s correction, Mann-Whitney test, and Kolmogorov-Smirnov test were performed where appropriate as reported in the figure legends. For every assay, the assumptions of the statistical test being used were met, including normality and similarity in variance. Normality was determined using the Kolmogorov-Smirnov test for normality. Variance between groups being compared was assessed using the F test. For experiments where variance was not similar between the groups being compared, a parametric unpaired t-test with Welch’s correction or nonparametric Kolmogorov-Smirnov test was used. All statistical analyses were performed using GraphPad Prism software. A comparison was considered significant if p was less than 0.05.
Data deposition
X-ray crystallographic data were deposited in the Research Collaboratory for Structural Bioinformatics Protein Data Bank (PDB) database: human LMPTP-A (#5JNR), human LMPTP-A bound to PO4 (#5JNS), human LMPTP-A bound to MES (#5JNT), mouse LMPTP-A bound to PO3 (#5JNU), bovine LMPTP W49Y/N50E bound to HEPES (#5JNV), bovine LMPTP W49Y/N50E bound to VO3 and Compd. 18 (#5JNW).
Supplementary Material
Acknowledgments
The authors are grateful to Dr. Lutz Tautz for providing recombinant VHR and LYP proteins, to Dr. Eugenio Santelli for critical review of the manuscript, to the UC Davis Mouse Biology Program for help with image preparation, to Dr. Sayan Gupta for assistance with sample irradiation at the Advanced Light Source of Lawrence Berkeley National Laboratory, and to Dr. Zbigniew Mikulski and Angela Lamberth for help with histological analysis at the Histology and Microscopy Core at the La Jolla Institute for Allergy and Immunology. This work was supported by grants R03DA033986 (to N.B.) and R01DK106233 from the National Institutes of Health (to N.B. and A.B.P.). S.M.S. was supported by the American Diabetes Association Pathway to Stop Diabetes Grant 1-15-INI-13 and by the University of California San Diego Diabetes Research Center grant P30DK063491 from the National Institutes of Health. The X-ray footprinting was carried out by Sayan Gupta at beamline 3.2.1 of the Advanced Light Source of Lawrence Berkeley National Laboratory, which is supported by the Director, Office of Science, Office of Basic Energy Sciences, of the U.S. Department of Energy under Contract No. DE-AC02-05CH11231. This is manuscript #1882 from the La Jolla Institute for Allergy and Immunology.
Footnotes
Accession Codes
PDB codes: human LMPTP-A (#5JNR), human LMPTP-A bound to PO4 (#5JNS), human LMPTP-A bound to MES (#5JNT), mouse LMPTP-A bound to PO3 (#5JNU), bovine LMPTP W49Y/N50E bound to HEPES (#5JNV), bovine LMPTP W49Y/N50E bound to VO3 and Compd. 18 (#5JNW).
Data Availability
Supplementary information, chemical compound information and source data are available in the online version of the paper. PDB identification codes are available in the Accession Codes section. Correspondence and requests for materials should be addressed to N.B.
Author Contributions
S.M.S., A.E.A., T.D.Y.C., T.M., S.S., L.A.B., R.C.L., A.B.P. and N.B. participated in study conception and design. S.M.S., V.Z., M.R.B., Y.L., A.B. and S.S. performed in vivo experiments. S.M.S., V.Z. and M.R.B. performed cell biology experiments. S.M.S., V.Z., M.P.H., M.R.B., F.Y. and S.K. performed in vitro enzymatic assays. R.J.A., J.Z., S.R.G. and A.B.P. designed chemical compounds and/or performed chemical synthesis. R.J.A. and A.B.P. coordinated compound stability and PK studies. A.E.A., M.P.H., M.R.B., A.A.B., Y.L., G.W.C. and L.A.B. produced recombinant proteins. A.A.B. performed ITC experiments. A.E.A., G.W.C., J.Y. and L.A.B. performed NMR and X-ray crystallography experiments. J.K. performed hydroxyl radical footprinting experiments. S.M.S., A.E.A., V.Z., R.J.A., M.P.H., J.Z., S.R.G., M.R.B., F.Y., A.A.B., J.K., Y.L., G.W.C., S.K., J.Y., A.B., T.D.Y.C., T.M., S.S., L.A.B., R.C.L., A.B.P. and N.B. analyzed and interpreted data. S.M.S, R.C.L., A.B.P. and N.B. wrote the manuscript.
Competing Financial Interests Statement
The authors declare competing financial interests: La Jolla Institute for Allergy and Immunology and Sanford Burnham Medical Discovery Institute hold a pending patent WO 2016/061280 A1 “Inhibitors of low molecular weight protein tyrosine phosphatase and uses thereof”, with N.B., J.Z., S.R.G., S.M.S., A.B.P., T.D.Y.C., M.P.H. and R.J.A. named as inventors.
Main Text References
- 1.Biddinger SB, Kahn CR. From mice to men: insights into the insulin resistance syndromes. Annu Rev Physiol. 2006;68:123–58. doi: 10.1146/annurev.physiol.68.040104.124723. [DOI] [PubMed] [Google Scholar]
- 2.Kahn SE, Hull RL, Utzschneider KM. Mechanisms linking obesity to insulin resistance and type 2 diabetes. Nature. 2006;444:840–6. doi: 10.1038/nature05482. [DOI] [PubMed] [Google Scholar]
- 3.Saltiel AR, Kahn CR. Insulin signalling and the regulation of glucose and lipid metabolism. Nature. 2001;414:799–806. doi: 10.1038/414799a. [DOI] [PubMed] [Google Scholar]
- 4.White MF, Shoelson SE, Keutmann H, Kahn CR. A cascade of tyrosine autophosphorylation in the beta-subunit activates the phosphotransferase of the insulin receptor. J Biol Chem. 1988;263:2969–80. [PubMed] [Google Scholar]
- 5.Musi N, Goodyear LJ. Insulin resistance and improvements in signal transduction. Endocrine. 2006;29:73–80. doi: 10.1385/ENDO:29:1:73. [DOI] [PubMed] [Google Scholar]
- 6.Alonso A, et al. Protein tyrosine phosphatases in the human genome. Cell. 2004;117:699–711. doi: 10.1016/j.cell.2004.05.018. [DOI] [PubMed] [Google Scholar]
- 7.Elchebly M, et al. Increased insulin sensitivity and obesity resistance in mice lacking the protein tyrosine phosphatase-1B gene. Science. 1999;283:1544–8. doi: 10.1126/science.283.5407.1544. [DOI] [PubMed] [Google Scholar]
- 8.Kasibhatla B, Wos J, Peters KG. Targeting protein tyrosine phosphatase to enhance insulin action for the potential treatment of diabetes. Curr Opin Investig Drugs. 2007;8:805–13. [PubMed] [Google Scholar]
- 9.Chiarugi P, et al. LMW-PTP is a negative regulator of insulin-mediated mitotic and metabolic signalling. Biochem Biophys Res Commun. 1997;238:676–82. doi: 10.1006/bbrc.1997.7355. [DOI] [PubMed] [Google Scholar]
- 10.Bottini N, MacMurray J, Peters W, Rostamkhani M, Comings DE. Association of the acid phosphatase (ACP1) gene with triglyceride levels in obese women. Mol Genet Metab. 2002;77:226–9. doi: 10.1016/s1096-7192(02)00120-8. [DOI] [PubMed] [Google Scholar]
- 11.Gloria-Bottini F, et al. Phosphotyrosine protein phosphatases and diabetic pregnancy: an association between low molecular weight acid phosphatase and degree of glycemic control. Experientia. 1996;52:340–3. doi: 10.1007/BF01919537. [DOI] [PubMed] [Google Scholar]
- 12.Lucarini N, et al. Phosphotyrosine-protein-phosphatase and diabetic disorders. Further studies on the relationship between low molecular weight acid phosphatase genotype and degree of glycemic control. Disease markers. 1998;14:121–5. doi: 10.1155/1998/145391. [DOI] [PMC free article] [PubMed] [Google Scholar]
- 13.Iannaccone U, et al. Serum glucose concentration and ACP1 genotype in healthy adult subjects. Metabolism. 2005;54:891–4. doi: 10.1016/j.metabol.2005.02.002. [DOI] [PubMed] [Google Scholar]
- 14.Pandey SK, et al. Reduction of low molecular weight protein-tyrosine phosphatase expression improves hyperglycemia and insulin sensitivity in obese mice. J Biol Chem. 2007;282:14291–9. doi: 10.1074/jbc.M609626200. [DOI] [PubMed] [Google Scholar]
- 15.Stefani M, et al. Dephosphorylation of tyrosine phosphorylated synthetic peptides by rat liver phosphotyrosine protein phosphatase isoenzymes. FEBS Lett. 1993;326:131–4. doi: 10.1016/0014-5793(93)81776-v. [DOI] [PubMed] [Google Scholar]
- 16.Barr AJ. Protein tyrosine phosphatases as drug targets: strategies and challenges of inhibitor development. Future Med Chem. 2010;2:1563–76. doi: 10.4155/fmc.10.241. [DOI] [PubMed] [Google Scholar]
- 17.Maccari R, Ottana R. Low molecular weight phosphotyrosine protein phosphatases as emerging targets for the design of novel therapeutic agents. J Med Chem. 2012;55:2–22. doi: 10.1021/jm200607g. [DOI] [PubMed] [Google Scholar]
- 18.Ottana R, et al. 5-Arylidene-2-phenylimino-4-thiazolidinones as PTP1B and LMW-PTP inhibitors. Bioorg Med Chem. 2009;17:1928–37. doi: 10.1016/j.bmc.2009.01.044. [DOI] [PubMed] [Google Scholar]
- 19.Maccari R, et al. Structure-based optimization of benzoic acids as inhibitors of protein tyrosine phosphatase 1B and low molecular weight protein tyrosine phosphatase. ChemMedChem. 2009;4:957–62. doi: 10.1002/cmdc.200800427. [DOI] [PubMed] [Google Scholar]
- 20.Maccari R, et al. 5-Arylidene-2,4-thiazolidinediones as inhibitors of protein tyrosine phosphatases. Bioorg Med Chem. 2007;15:5137–49. doi: 10.1016/j.bmc.2007.05.027. [DOI] [PubMed] [Google Scholar]
- 21.Ottana R, et al. Synthesis, biological activity and structure-activity relationships of new benzoic acid-based protein tyrosine phosphatase inhibitors endowed with insulinomimetic effects in mouse C2C12 skeletal muscle cells. Eur J Med Chem. 2014;71:112–27. doi: 10.1016/j.ejmech.2013.11.001. [DOI] [PubMed] [Google Scholar]
- 22.Forghieri M, et al. Synthesis, activity and molecular modeling of a new series of chromones as low molecular weight protein tyrosine phosphatase inhibitors. Bioorg Med Chem. 2009;17:2658–72. doi: 10.1016/j.bmc.2009.02.060. [DOI] [PubMed] [Google Scholar]
- 23.Wade F, et al. Deletion of low molecular weight protein tyrosine phosphatase (Acp1) protects against stress-induced cardiomyopathy. J Pathol. 2015 doi: 10.1002/path.4594. [DOI] [PMC free article] [PubMed] [Google Scholar]
- 24.Surwit RS, Kuhn CM, Cochrane C, McCubbin JA, Feinglos MN. Diet-induced type II diabetes in C57BL/6J mice. Diabetes. 1988;37:1163–7. doi: 10.2337/diab.37.9.1163. [DOI] [PubMed] [Google Scholar]
- 25.McGovern SL, Helfand BT, Feng B, Shoichet BK. A specific mechanism of nonspecific inhibition. J Med Chem. 2003;46:4265–72. doi: 10.1021/jm030266r. [DOI] [PubMed] [Google Scholar]
- 26.Baell JB, Holloway GA. New substructure filters for removal of pan assay interference compounds (PAINS) from screening libraries and for their exclusion in bioassays. J Med Chem. 2010;53:2719–40. doi: 10.1021/jm901137j. [DOI] [PubMed] [Google Scholar]
- 27.Ardecky RJ, et al. Probe Reports from the NIH Molecular Libraries Program. Bethesda (MD): 2010. Allosteric Small Molecule Inhibitors of LMPTP. [Google Scholar]
- 28.Ramponi G, Stefani M. Structure and function of the low Mr phosphotyrosine protein phosphatases. Biochim Biophys Acta. 1997;1341:137–56. doi: 10.1016/s0167-4838(97)00087-3. [DOI] [PubMed] [Google Scholar]
- 29.Zhang M, Zhou M, Van Etten RL, Stauffacher CV. Crystal structure of bovine low molecular weight phosphotyrosyl phosphatase complexed with the transition state analog vanadate. Biochemistry. 1997;36:15–23. doi: 10.1021/bi961804n. [DOI] [PubMed] [Google Scholar]
- 30.Rastogi VK, et al. 1H, 15N, and 13C resonance assignments of low molecular weight human cytoplasmic protein tyrosine phosphatase-A (HCPTP-A) J Biomol NMR. 2002;23:251–2. doi: 10.1023/a:1019846106641. [DOI] [PubMed] [Google Scholar]
- 31.Su XD, Taddei N, Stefani M, Ramponi G, Nordlund P. The crystal structure of a low-molecular-weight phosphotyrosine protein phosphatase. Nature. 1994;370:575–8. doi: 10.1038/370575a0. [DOI] [PubMed] [Google Scholar]
- 32.Brandao TA, Hengge AC, Johnson SJ. Insights into the reaction of protein-tyrosine phosphatase 1B: crystal structures for transition state analogs of both catalytic steps. J Biol Chem. 2010;285:15874–83. doi: 10.1074/jbc.M109.066951. [DOI] [PMC free article] [PubMed] [Google Scholar]
- 33.Pannifer AD, Flint AJ, Tonks NK, Barford D. Visualization of the cysteinyl-phosphate intermediate of a protein-tyrosine phosphatase by x-ray crystallography. J Biol Chem. 1998;273:10454–62. doi: 10.1074/jbc.273.17.10454. [DOI] [PubMed] [Google Scholar]
- 34.Logan TM, et al. Solution structure of a low molecular weight protein tyrosine phosphatase. Biochemistry. 1994;33:11087–96. doi: 10.1021/bi00203a005. [DOI] [PubMed] [Google Scholar]
- 35.Chiarugi P, et al. LMW-PTP is a positive regulator of tumor onset and growth. Oncogene. 2004;23:3905–14. doi: 10.1038/sj.onc.1207508. [DOI] [PubMed] [Google Scholar]
Methods-only References
- 36.Liu P, Jenkins NA, Copeland NG. A highly efficient recombineering-based method for generating conditional knockout mutations. Genome Res. 2003;13:476–84. doi: 10.1101/gr.749203. [DOI] [PMC free article] [PubMed] [Google Scholar]
- 37.Wu S, et al. Multidentate small-molecule inhibitors of vaccinia H1-related (VHR) phosphatase decrease proliferation of cervix cancer cells. J Med Chem. 2009;52:6716–23. doi: 10.1021/jm901016k. [DOI] [PMC free article] [PubMed] [Google Scholar]
- 38.Wu S, Bottini M, Rickert RC, Mustelin T, Tautz L. In silico screening for PTPN22 inhibitors: active hits from an inactive phosphatase conformation. ChemMedChem. 2009;4:440–4. doi: 10.1002/cmdc.200800375. [DOI] [PMC free article] [PubMed] [Google Scholar]
- 39.Kholod N, Mustelin T. Novel vectors for co-expression of two proteins in E. coli. Biotechniques. 2001;31:322–3. doi: 10.2144/01312st03. [DOI] [PubMed] [Google Scholar]
- 40.Stanford SM, et al. Discovery of a novel series of inhibitors of lymphoid tyrosine phosphatase with activity in human T cells. J Med Chem. 2011;54:1640–54. doi: 10.1021/jm101202j. [DOI] [PMC free article] [PubMed] [Google Scholar]
- 41.Mustelin T, Tautz L, Page R. Structure of the hematopoietic tyrosine phosphatase (HePTP) catalytic domain: structure of a KIM phosphatase with phosphate bound at the active site. J Mol Biol. 2005;354:150–63. doi: 10.1016/j.jmb.2005.09.049. [DOI] [PubMed] [Google Scholar]
- 42.Kabsch W. Xds. Acta Crystallogr D Biol Crystallogr. 2010;66:125–32. doi: 10.1107/S0907444909047337. [DOI] [PMC free article] [PubMed] [Google Scholar]
- 43.Collaborative Computational Project, N. The CCP4 suite: programs for protein crystallography. Acta Crystallogr D Biol Crystallogr. 1994;50:760–3. doi: 10.1107/S0907444994003112. [DOI] [PubMed] [Google Scholar]
- 44.McCoy AJ, et al. Phaser crystallographic software. J Appl Crystallogr. 2007;40:658–674. doi: 10.1107/S0021889807021206. [DOI] [PMC free article] [PubMed] [Google Scholar]
- 45.Murshudov GN, Vagin AA, Dodson EJ. Refinement of macromolecular structures by the maximum-likelihood method. Acta Crystallogr D Biol Crystallogr. 1997;53:240–55. doi: 10.1107/S0907444996012255. [DOI] [PubMed] [Google Scholar]
- 46.Emsley P, Cowtan K. Coot: model-building tools for molecular graphics. Acta Crystallogr D Biol Crystallogr. 2004;60:2126–32. doi: 10.1107/S0907444904019158. [DOI] [PubMed] [Google Scholar]
- 47.Adams PD, et al. PHENIX: a comprehensive Python-based system for macromolecular structure solution. Acta Crystallogr D Biol Crystallogr. 2010;66:213–21. doi: 10.1107/S0907444909052925. [DOI] [PMC free article] [PubMed] [Google Scholar]
- 48.Gupta S, Sullivan M, Toomey J, Kiselar J, Chance MR. The Beamline X28C of the Center for Synchrotron Biosciences: a national resource for biomolecular structure and dynamics experiments using synchrotron footprinting. J Synchrotron Radiat. 2007;14:233–43. doi: 10.1107/S0909049507013118. [DOI] [PubMed] [Google Scholar]
- 49.Kiselar JG, Maleknia SD, Sullivan M, Downard KM, Chance MR. Hydroxyl radical probe of protein surfaces using synchrotron X-ray radiolysis and mass spectrometry. Int J Radiat Biol. 2002;78:101–14. doi: 10.1080/09553000110094805. [DOI] [PubMed] [Google Scholar]
- 50.Xu G, Chance MR. Hydroxyl radical-mediated modification of proteins as probes for structural proteomics. Chem Rev. 2007;107:3514–43. doi: 10.1021/cr0682047. [DOI] [PubMed] [Google Scholar]
- 51.Xu G, Chance MR. Radiolytic modification and reactivity of amino acid residues serving as structural probes for protein footprinting. Anal Chem. 2005;77:4549–55. doi: 10.1021/ac050299+. [DOI] [PubMed] [Google Scholar]
- 52.Xu G, Kiselar J, He Q, Chance MR. Secondary reactions and strategies to improve quantitative protein footprinting. Anal Chem. 2005;77:3029–37. doi: 10.1021/ac048282z. [DOI] [PubMed] [Google Scholar]
- 53.Xu H, Freitas MA. A mass accuracy sensitive probability based scoring algorithm for database searching of tandem mass spectrometry data. BMC Bioinformatics. 2007;8:133. doi: 10.1186/1471-2105-8-133. [DOI] [PMC free article] [PubMed] [Google Scholar]
- 54.Takamoto K, Chance MR. Radiolytic protein footprinting with mass spectrometry to probe the structure of macromolecular complexes. Annu Rev Biophys Biomol Struct. 2006;35:251–76. doi: 10.1146/annurev.biophys.35.040405.102050. [DOI] [PubMed] [Google Scholar]
Associated Data
This section collects any data citations, data availability statements, or supplementary materials included in this article.