

Abstract
The CT component of SPECT-CT is required for attenuation correction and anatomical localization of the uptake on SPECT but there is no guideline about the optimal CT acquisition parameters. In our department, a standard CT acquisition protocol was changed in 2013 to give lower radiation dose to the patient. In this study, we retrospectively compared the effects on patient dose as well as the CT image quality with current versus older CT protocols. Ninety nine consecutive patients [n=51 Standard dose ‘old’ protocol (SDP); n=48 lower dose ‘new’ protocol (LDP)] with lumbar spine SPECT-CT for bone scan were examined. The main differences between the two protocols were that SDP used 130 kVp tube voltage and reference current-time product of 70 mAs whereas the LDP used 110 kVp and 40 mAs respectively. Various quantitative parameters from the CT images were obtained and the images were also rated blindly by two experienced nuclear medicine physicians for bony definition and noise. The mean calculated dose length product of the LDP group (121.5±39.6 mGy.cm) was significantly lower compared to the SDP group patients (266.9±96.9 mGy.cm; P<0.0001). This translated into a significant reduction in the mean effective dose to 1.8 mSv from 4.0 mSv. The physicians reported better CT image quality for the bony structures in LDP group although for soft tissue structures, the SDP group had better image quality. The optimized new CT acquisition protocol significantly reduced the radiation dose to the patient and in-fact improved CT image quality for the assessment of bony structures.
Keywords: SPECT, CT, kVp, mAs, DLP, low dose
Introduction
There has been a significant increase in the medical radiation burden in the last four decades. The per capita radiation dose from medical imaging in the United States has increased from 0.54 mSv in 1980s to 3 mSv in 2006 [1]. Thus the focus is now on lowering the medical radiation dose without affecting the quality of imaging [1]. While nuclear medicine studies only contributed about a quarter of the total burden in 2006, [1] this proportion will likely increase with rapidly rising use of PET-CT and SPECT-CTs.
SPECT and PET have been in use for a long time but recently, the addition of CT to these modalities significantly improved their diagnostic power. However, the CT component significantly increases the overall radiation burden. Mhiri et al reported an 83% increase in the total effective dose with the inclusion of CT compared with SPECT alone [2]. Brix et al reviewed the whole-body FDG-PET/CT acquisition protocols at four German academic medical institutions and determined that the mean effective dose was approximately 25 mSv, with approximately 7 mSv coming from the PET component and 14-19 mSv from the CT component [3]. Thus the CT component of SPECT and PET is a worthwhile target for dose reduction. Such dose reductions have already been investigated for diagnostic CTs [4-9].
While the guidelines suggest the use of lower dose CT protocols when performing SPECT-CT, there are no clear data about the optimal CT acquisition parameters [10]. This is partly due to the complexity of SPECT-CTs in various nuclear medicine studies. SPECT-CT significantly improves the sensitivity and specificity of bone scintigraphy by providing additional structural information, particularly for the assessment of spinal abnormalities [11]. While attempts have been made to reduce the CT doses of myocardial perfusion SPECT/CT [12], PET-CT [13,14] and paediatric SPECT-CTs [15], there are no data about the satisfactory parameters for SPECT-CT for bone scans. The aim of this study is to assess the impact of a reduction in CT dose on soft tissue and bone CT image quality (anatomic definition and noise) in this setting.
Method
In our institution, bone scintigraphy is performed for various accepted indications (e.g. back pain, sports injuries, suspicion of malignancies or osteomyelitis etc) and SPECT-CT is acquired as necessary. The non-contrast CT component of the SPECT-CT is performed for attenuation correction and anatomical localization purposes only and a lower dose protocol is used. In Aug 2013, the departmental CT acquisition protocol was changed to an even lower dose protocol by reducing tube voltage from 130 kVp to 110 kVp and reference current-time product from 70 mAs to 40 mAs. The other changes in the CT acquisition protocol are listed in the Table 1. Given the retrospective nature of the study, the local human research ethics committee waived the need for formal approval.
Table 1.
CT acquisition parameters in both protocol subgroups
| Group SDP | Group LDP | |
|---|---|---|
| kVp | 130 | 110 |
| Reference mAs | 70 | 40 |
| Slice thickness (mm) | 3 | 2 |
| Beam collimation | 16 × 1.2 mm1 | 16 × 1.2 mm1 |
| Recon | Iterative | Iterative |
| Image kernel | B50s moderate sharp | B31s medium smooth + |
| Reconstruction increment (mm) | 22 | 1.5 |
| Pitch | 1.5 | 1.5 |
| Rotation time (seconds) | 13 | 1 |
| CareDose type | AEC+DOM4 | AEC+DOM4 |
For T2 camera, 2 × 2.5 mm;
For T2 camera 3 mm;
For T2 camera 1.5 sec;
AEC = Automatic exposure control; DOM = Dose Modulation.
The bone scan studies prior to and after the change in protocol were extracted. We then selected all consecutive patients with lower back pain with suspicion of bony pathologies e.g. facet joint arthritis, fractures, osteomyelitis etc., referred for bone scintigraphy, who had SPECT-CT of the lumbar spine. All patients older than 18 years were included. Patients who had variation in CT parameters as per physician discretion (n=1) and insufficient CT dose parameter information (n=1) were excluded. A total of 99 studies (M: 32 F: 67) were included and were divided in two groups; the Standard dose ‘old’ CT protocol (SDP) and Lower dose ‘new’ CT protocol (LDP).
Image acquisition
The patients had a bone scan using 719 to 877 MBq of 99mTc-MDP. The SPECT-CT was performed on a dedicated Siemens Symbia T series camera (either two slice CT-T2 or 16 slice CT-T16; Siemens Molecular imaging, Erlangen- Germany). Dose modulation (CareDose4D), a method of automatic exposure control which adjusts tube current based on patient’s thickness and density, was routinely used. The SPECT was reconstructed using a Flash 3D iterative image reconstruction algorithm. The standard CT scan length is 50 cm and was not altered in the study patients. The other acquisition parameters for the SDP and LDP groups are shown in Table 1.
Qualitative assessment of CT images
The CT images were transferred to a dedicated diagnostic nuclear medicine platform (Xeleris-3 workstation, General Electric Medical Systems, Milwaukee, Wisconsin, USA) and displayed using the Volumetrix programme. In this programme, the axial slices are displayed in the same thickness as they were acquired (i.e. 3 mm in the old protocol and 2 mm thickness in the new protocol). However, the coronal and sagittal slices are reformatted from the axial slices and displayed in 1 mm thickness.
The CT studies of both groups were put in randomized order and were analysed blindly by two nuclear medicine physicians (NR & SV); where the two readers disagreed, a consensus result was obtained. All the data were scored using a four point scoring system with 1: Poor, 2: Average, 3: Better than average, 4: Good. A representative image of each category (except score 1, which was considered any image worse than score 2) was selected and the scoring was performed using them as landmarks (Figure 1).
Figure 1.

Reference CT Images for qualitative scoring: These images were given to the analysing physicians as a guide for scoring the study patient’s CTs. The left column images are of poorer quality image and were scored 2 (any worse than this image were to score 1), slightly better image were scored 3 and best image scoring was 4.
The soft tissue definition was rated using the soft tissue window in the axial slices at the mid-lower pole of the right kidney. The sharpness of the renal cortex was assessed compared to the surrounding fat plane in both groups. This analysis was repeated after summing three slices in the LDP group (i.e. 6 mm thick).
The noise of the study was rated in the axial slice in the soft tissue window at the level of mid-lower pole of right kidney and was based on image graininess or mottling: 1 = Extreme, 2 = Major, 3 = Moderate, 4 = Minor. This analysis was repeated after summing three slices in the LDP group (i.e. 6 mm thick).
The bone definition was reviewed in the bone window at the right L5/S1 facet joint in the axial slices and quality of joint demarcation was visually scored. Similar scoring was performed in the sagittal/coronal slices. Other facet joints were examined for scoring as per physician discretion if there was an artefact or other bony changes at right L5/S1 facet joint.
Quantitative assessment of CT images
The CT images were displayed by a single observer (SG) on the Carestream Vue PACS (version 11.4.1.1011, Carestream Health, NY, USA). The CT dose parameters e.g. mAs, dose length product (DLP) and CT dose index - CTDIvol (CTDI) were recorded. The effective dose was calculated by multiplying the DLP with the conversion factor, which is 0.015 for the lumbar region [2,16].
For the assessment of a patient’s body habitus, abdominal circumference and surface area at the L5 level in the axial image were measured. AP and lateral diameter and surface area were also recorded at the same level.
For the noise estimation, standard deviation (SD) of the CT numbers was measured in an approximately 10 mm2 circular Region of Interest (ROI). This assessment was performed at the right ilium, right psoas at the approximate level of L5/S1, right renal cortex close to the inferior pole and in the air around the patient. All the values were obtained in three separate areas and the mean was used for final analyses.
Data analysis
The statistical analyses were performed with the StatsDirect statistical software (Version 2.7.7, Altrincham-England: StatsDirect Ltd. 2009). A p-value <0.05 was considered statistically significant. Except for gender and qualitative ordinal data, all patient data and quantitative image parameters were tested for a normal distribution with the Shapiro-Wilk W test. The ordinal data and non-normally distributed parameters in both patient subgroups (SDP and LDP) were compared using a Mann-Whitney U test. The t test for independent samples (unpaired) was used for the same purpose for the parameters with a normal distribution.
Result
Patients in both groups were similar in the age, gender and administered dose of 99mTc-MDP (Table 2). We did not have height and weight measurements of the patients in this retrospective analysis hence we assessed abdominal circumference, abdominal surface area and abdominal AP & lateral diameters as potential indicators of body habitus; both groups were similar in these measurements. Abdominal circumference showed a linear relationship with the surface area as well as AP and lateral abdomen diameters (R2=0.97, 0.86 and 0.84 respectively; plots not shown in this manuscript). Since abdominal circumference is also easier to measure in clinical practice as well, this parameter was used as an indication of patient’s body habitus for all other analyses in this paper.
Table 2.
Summary of patient demographic and morphological parameters as well as CT dose parameters in the two study groups*
| Group SDP | Group LDP | p | |
|---|---|---|---|
| Patients (n) | 51 | 48 | - |
| Male | 16 | 16 | NS |
| Female | 35 | 32 | NS |
| Age (years) | 63.1±14.2 (38.2-89.6) | 59.0±16.7 (25.3-87.7) | 0.26 |
| Dose of 99mTc-MDP (MBq) | 827.8±24.8 (749-877) | 830.0±24.6 (719-870) | 0.45 |
| Abdomen circumference (cm) | 103.5±15.2 (74-142) | 100.2±14.1 (70-130) | 0.29 |
| Abdomen AP diameter (cm) | 24.5±4.3 (17-36) | 23.3±4.1 (15-36) | 0.25 |
| Abdomen lateral diameter (cm) | 37.2±5.4 (27-49) | 36.3±5.5 (27-50) | 0.23 |
| Abdomen surface area (cm2) | 769.4±223.2 (375-1432) | 721.3±202.8 (340-1278) | 0.29 |
| CT dose parameters | |||
| mAs | 64.8±21.6 (35-124) | 43.1±13.6 (22-89) | <0.0001 |
| CTDI (mGy) | 7.0±2.4 (2.7-13.0) | 3±0.9 (1.5-6.0) | <0.0001 |
| DLP (mGy.cm) | 266.9±96.9 (116-535) | 121.5±39.6 (58-215) | <0.0001 |
| Effective dose (mSv) | 4.0±1.5 (1.7-8.0) | 1.8±0.6 (0.9-3.2) | <0.0001 |
All values (except patient number, gender and ref mAs) are in mean ± SD with the range in parentheses.
Statistically significant p values are highlighted in bold. AP- Antero-posterior; CTDIvol- Volume CT dose index; DLP- Dose length product.
As expected, the measured mAs, CTDIvol and DLPs were significantly lower in LDP group (Table 2). This translated into an approximately 55% reduction in the mean effective dose to the patient with the new protocol (mean 1.8 mSv), compared to the old protocol (mean 4.0 mSv). As a surrogate for skin dose, CTDI100 was measured at the peripheral location in a 32 cm diameter Perspex body phantom (Fluke Biomedical, RMS) using a RaySafe Xi CT detector (UnforsRaySafe, Billdal, Sweden). The measured peripheral dose using LDP CT parameters was 63% lower than that using SDP CT parameters.
When quantitative measures of noise of the CT in various regions were compared, the noise was approximately 13.6-18.6% lower in the soft tissue, air and bone in the LDP group (Table 3). The noise in the psoas muscle was not statistically different in both groups.
Table 3.
Results of CT quantitative and qualitative parameters in the two study groups
| Group SDP (n=51) | Group LDP (n=48) | P | |
|---|---|---|---|
| CT quantitative image quality | |||
| SD at right renal cortex | 34.1±8.4 (23-78.7) | 29.4±6.8 (17-44.3) | 0.0024 |
| SD at psoas | 35.1±8.5 (23-69) | 32.3±9.1 (19-55.7) | 0.0582 |
| SD at ilium | 43.8±8.8 (25-73.7) | 36±8.1 (18-56.7) | <0.0001 |
| SD at air | 17.7±4.0 (9.7-33.3) | 14.4±2.6 (9.3-20.7) | <0.0001 |
| Visual CT image quality | |||
| Definition soft tissue at kidney level | 3.2±0.7 | 2.8±0.6 | 0.0016 |
| Definition soft tissue at kidney level (summed up 6 mm slice) | 3.1±0.6 | 3.2±0.6 | 0.508 |
| Definition bone axial slices | 3.2±0.6 | 3.4±0.6 | 0.032 |
| Definition bone sagittal and coronal slices | 2.3±0.5 | 3.1±0.6 | <0.0001 |
| Noise soft tissue at kidney level | 3.0 ±0.6 | 2.6±0.6 | 0.0038 |
| Noise soft tissue at kidney level (summed up 6 mm slice) | 3.5±0.5 | 3.4±0.6 | 0.4633 |
The CT quantitative image quality values in both groups are in mean ± SD with range in the parenthesis. The qualitative parameters are derived from consensus rating by two physicians and were scored from 1-4. Statistically significant p values are highlighted in bold text in the right hand column. SDP- Standard dose ‘old’ protocol group; LDP- Lower dose ‘new’ protocol group; SD-standard deviation.
When CT image quality was examined by two physicians, there was only minimally improved bony definition in axial slices with the mean rating increasing from 3.2 to 3.4 (P=0.32). However, this rating significantly improved in the sagittal and coronal reformats (mean rating 2.3 in the SDP group and 3.1 in the LDP group; P<0.0001). For the soft tissue assessment, higher noise and lower definition was noted in the LDP group, but this improved on the summed images (i.e. 6 mm slice thickness) and became comparable to the SDP group (Table 2). All the CT images in both the groups were found to be clinically acceptable for nuclear medicine purposes.
Patient’s body habitus may have an impact on the delivered dose due to modulation as well as CT image quality. The scatter plots between DLP, mAs and noise at various sites versus abdominal circumference are shown in Figure 2. With increasing body habitus, as expected, there was a rise in the DLP and delivered mAs to the patient. Noise at various regions also increased with increasing body habitus but there was significant overlap of both subgroups in the noise of various areas with the rising abdominal circumference (Figure 2).
Figure 2.

Scatter plots of various CT dose (DLP, mAs) and noise parameters (at kidney, Psoas, ilium and air) plotted for both group of patients, adjusted for abdomen circumference (AC; at X-axis). The measured parameters are represented in the Y-axis. The ‘o’ symbol represents LDP group and ‘x’ represents SDP group patients.
Discussion
To our knowledge, this is the first study on lumbar spine 99mTc-MDP bone scan SPECT-CTs, demonstrating improved CT image quality for bony assessment despite significant reduction in effective dose. As expected, altering the CT acquisition parameters in the LDP group significantly reduced the dose to the patient. With our new (LDP) protocol, the mean effective CT dose to the patients significantly decreased to 1.8 mSv, compared to 4.0 mSv in the older (SDP) protocol, a dose reduction of 55%. To our knowledge, this is the lowest reported CT exposure dose for lumbar spine bone scan SPECT-CTs in adults. For example in a recent Canadian study, Tonkopi et al showed that the optimal use of cone beam CT resulted in a mean CT dose of 3.96 mSv from bone scan SPECT-CTs [17]. In other studies, the effective dose of from CT component of the abdominal SPECT-CT were found to be 10.6 mSv [18], 8.6 mSv [19] and 4.6 mSv [20], although this may not be comparable since they used cohorts of ‘all’ nuclear medicine SPECT-CTs (compared to bone scans only in our study). It should be noted that the dose of the CT component of the bone scan SPECT-CT can be reduced since the aim of the imaging is high density bony structures. However, at the same time, the physicians must be able to delineate and localize small structures in the lumbar spine facet joints, pedicle, lamina and spinous processes etc. This requires satisfactory CT image quality, not only in axial but also in sagittal/coronal views. This requirement is in contrast to some other nuclear medicine studies e.g. myocardial perfusion scan SPECT-CTs, where an accurate anatomical definition is not required and dose of the CT can be further reduced easily.
Strikingly, despite significantly reduced radiation doses, the CT image quality for the bony structures was actually considered better by experienced nuclear medicine physicians. This difference was most obvious in the reformatted sagittal and coronal slices (Table 3). As shown in Figure 3, improvement in bony delineation in LDP group in sagittal and coronal views was irrespective of body habitus (abdominal circumference 90 cm and 130 cm). This is due to acquisition of CT in thinner slices in the LDP group, which results in less noise/step artifacts when reformatted in sagittal and coronal views. The reformatting to sagittal and coronal slices, from axial images, is common in Nuclear Medicine as the CT images are reviewed in conjunction with SPECT. In diagnostic radiological CTs, the sagittal and coronal views are reconstructed directly from the raw data and this phenomenon is not observed. While the sagittal and coronal views can be separately reconstructed from the raw CT data in nuclear medicine as well, in our knowledge, the reporting platforms do not support simultaneous display and triangulation of three separate CT data (i.e. axial, reconstructed sagittal and reconstructed coronal views) as well as SPECT.
Figure 3.
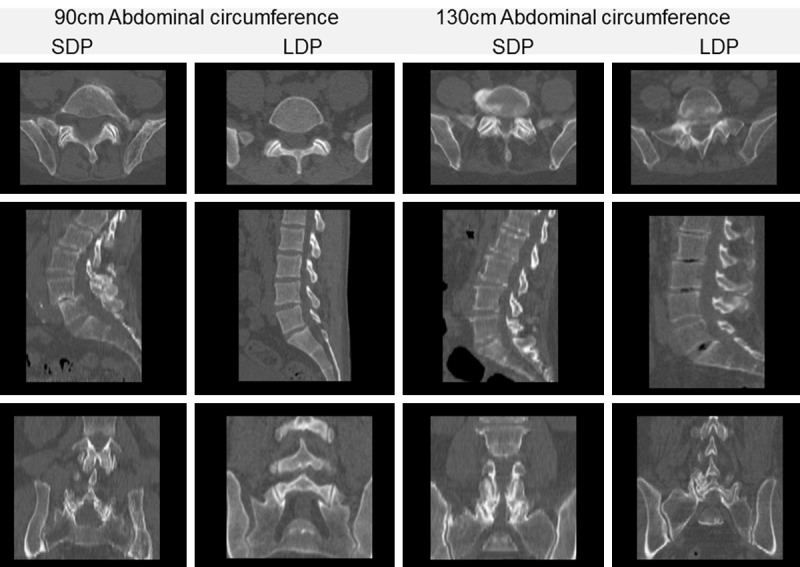
Axial, Sagittal & Coronal reformats of four randomly selected patients of the SDP group and LDP group with abdominal circumference of 90 cm and abdominal circumference of 130 cm. As displayed in the viewing platform, the axial slices in the SDP group are 3 cm thick and in the LDP group are 2 cm thick. All the sagittal and coronal slices in both groups are reformatted from the axial slices into 1 cm thick slices. These images show that while there is not much difference in the axial slices in the two protocols in both 90 cm and 130 cm abdominal circumference patients, there is improvement in the bony delineation in the sagittal and coronal reformats within the LDP group in both 90 cm and 130 cm abdominal circumference patients.
As opposed to the bony structures, qualitatively, the definition and noise for the soft tissue worsened in LDP group, likely related to thinner slices and lower CT dose. However when the axial CT slices of the LDP group were summed to 6 mm, the image quality became comparable with the SDP group. In other words, although an optimal soft tissue assessment is not required for routine bone scans, the quality of LDP CT images can be improved by summing the slices.
Quantitatively, in contrast to visual interpretation, there was slight reduction in the mean noise level in various sites in the LDP group (Table 3). This is likely due to use of a smoother image kernel (B31s medium smooth +) in the LDP group, compared to the sharper kernel (B51s moderate sharp) in the SDP group.
The CT component of the SPECT-CT is different to the diagnostic CT in many ways. Firstly, the CT component of the SPECT-CT is mostly performed for attenuation correction and anatomical localization purposes only [10]. Secondly, only a non-contrast CT is performed, although contrast CTs have been investigated for PET-CTs. Finally, as mentioned previously, the images are reviewed as a supplement to SPECT and hence the sagittal and coronal images are reformatted from the axial slices.
Although we were able to reduce the dose of the CT component in our study, further studies may clarify if this can be reduced even further. However three factors need to be considered:
• For the studies like bone scan, the reduced CT doses should not compromise the anatomical localization. Often the bone scan SPECT-CT is performed for smaller structures e.g. hand, feet, spine etc where small inaccuracy in lesion localization may have significant clinical impact.
• A reasonable quality CT is not only required for better anatomical delineation but for better attenuation correction of SPECT data as well. Hulmes et al demonstrated reduction in the quality of the reconstructed SPECT data with lowering the dose of CT and recommended that a tube voltage to be maintained at 110-130 to minimize beam-hardening artifacts when lowering the mAs [21]. Although CT performed for the bone scan is more for anatomical localization rather than attenuation correction, this may be of more value in other nuclear medicine studies e.g. cardiac, gallium scan etc.
• The dose of the CT needs to be individualized for the study requirements as well as patient’s age and gender. The requirements of CT may differ between the studies e.g. CT in myocardial perfusion scan is predominantly for attenuation correction but for PET-CTs, both attenuation correction and anatomical localization is required. Another example is that the abdominal CT parameters for the bone scan of lumbar spine would be different to that for the labelled white cell scan investigating an inflammatory bowel disease. To further complicate the issue, the CT parameters may change within a particular study depending on the patient’s situation e.g. CT parameters for labelled white cell scan would be different for assessing infection in the extremity in an older patient compared to inflammatory bowel disease in a younger patient. Body habitus usually does not pose much of a problem as the actual mAs upregulates and downregulates, depending on the patient’s body habitus by CareDose4D.
Due to the retrospective nature of this study, there were some limitations. Firstly, the patient’s body habitus could have been better assessed by patient’s body mass index (BMI) but in the absence of this data, we used abdominal circumference. Nevertheless, abdominal circumference may actually represent the localized abdominal body habitus well as BMI does not account for factors such as body size [22] and body fat distribution (e.g. abdominal obesity) [23]. Secondly, many of the CT acquisition parameters were different in both groups. Hence it is difficult to ascertain as to the role of an individual parameter in improving the CT image quality in the LDP group. Also, the studies in the older (SDP group) protocol were performed on two cameras (T2 and T16) and had slight differences in acquisition protocol (Table 1), further complicating the assessment of possible role of individual role of a single parameter. Thirdly, the quantitative assessment of the CT images was not objective and the four point scoring system was rather arbitrary and not based on prior evidence. The scoring system was formulated based on experience and reading physicians were provided with the images (Figure 1) to score. Thus we believe that this method provided closest possible objective stratification of visual image quality. Finally, this study did not look into effect of change CT protocols on attenuation correction of the SPECT data. Although not formally assessed, in our clinical experience, there is no change in attenuation corrected SPECT image quality with lower dose CT protocol.
In summary, we found that the dose reduction and altering the acquisition parameters of the CT component of the lumbar spine bone scan SPECT-CT not only reduces the radiation dose to the patient but also improves the CT image quality. This study not only establishes a baseline CT acquisition parameter for lumbar spine bone scan SPECT-CT but also stimulate similar studies targeting further reduction in the doses as well as many more studies investigating optimal CT acquisition parameters for various other nuclear medicine scans.
Disclosure of conflict of interest
None.
References
- 1.Fahey F, Stabin M. Dose optimization in nuclear medicine. Semin Nucl Med. 2014;44:193–201. doi: 10.1053/j.semnuclmed.2014.03.006. [DOI] [PubMed] [Google Scholar]
- 2.Mhiri A SI, Ghezaiel M, Slimene MFB. Estimation of radiation dosimetry for some common SPECT-CT Exams. Int J Biotechnol Wellness Ind. 2012:266–9. [Google Scholar]
- 3.Brix G, Lechel U, Glatting G, Ziegler SI, Munzing W, Muller SP, Beyer T. Radiation exposure of patients undergoing whole-body dual-modality 18F-FDG PET/CT examinations. J Nucl Med. 2005;46:608–13. [PubMed] [Google Scholar]
- 4.Szucs-Farkas Z, Kurmann L, Strautz T, Patak MA, Vock P, Schindera ST. Patient exposure and image quality of low-dose pulmonary computed tomography angiography: comparison of 100- and 80-kVp protocols. Invest Radiol. 2008;43:871–6. doi: 10.1097/RLI.0b013e3181875e86. [DOI] [PubMed] [Google Scholar]
- 5.Szucs-Farkas Z, Schaller C, Bensler S, Patak MA, Vock P, Schindera ST. Detection of pulmonary emboli with CT angiography at reduced radiation exposure and contrast material volume: comparison of 80 kVp and 120 kVp protocols in a matched cohort. Invest Radiol. 2009;44:793–9. doi: 10.1097/RLI.0b013e3181bfe230. [DOI] [PubMed] [Google Scholar]
- 6.Gnannt R, Winklehner A, Goetti R, Schmidt B, Kollias S, Alkadhi H. Low kilovoltage CT of the neck with 70 kVp: comparison with a standard protocol. AJNR Am J Neuroradiol. 2012;33:1014–9. doi: 10.3174/ajnr.A2910. [DOI] [PMC free article] [PubMed] [Google Scholar]
- 7.Nakaura T, Kidoh M, Nakamura S, Doi Y, Shiraishi S, Awai K, Harada K, Yamashita Y. Low-dose abdominal CT protocols with a tube voltage setting of 100 kVp or 80 kVp: Performance of radiation dose reduction and influence on visual contrast. Clin Radiol. 2014;69:804–11. doi: 10.1016/j.crad.2014.03.013. [DOI] [PubMed] [Google Scholar]
- 8.O’Malley ME, Chung P, Haider M, Jang HJ, Jhaveri K, Khalili K, Panzarella T, Warde P. Comparison of low dose with standard dose abdominal/pelvic multidetector CT in patients with stage 1 testicular cancer under surveillance. Eur Radiol. 2010;20:1624–30. doi: 10.1007/s00330-009-1710-1. [DOI] [PubMed] [Google Scholar]
- 9.Viteri-Ramírez G, García-Lallana A, Simón-Yarza I, Broncano J, Ferreira M, Pueyo JC, Villanueva A, Bastarrika G. Low radiation and low-contrast dose pulmonary CT angiography: Comparison of 80 kVp/60 ml and 100 kVp/80 ml protocols. Clin Radiol. 2012;67:833–9. doi: 10.1016/j.crad.2011.11.016. [DOI] [PubMed] [Google Scholar]
- 10.Delbeke D, Coleman RE, Guiberteau MJ, Brown ML, Royal HD, Siegel BA, Townsend DW, Berland LL, Parker JA, Zubal G, Cronin V. Procedure guideline for SPECT/CT imaging 1.0. J Nucl Med. 2006;47:1227–34. [PubMed] [Google Scholar]
- 11.Papathanassiou D, Bruna-Muraille C, Jouannaud C, Gagneux-Lemoussu L, Eschard JP, Liehn JC. Single-photon emission computed tomography combined with computed tomography (SPECT/CT) in bone diseases. Joint Bone Spine. 2009;76:474–80. doi: 10.1016/j.jbspin.2009.01.016. [DOI] [PubMed] [Google Scholar]
- 12.O’Shaughnessy E, Dixon KL. Reducing CT dose in myocardial perfusion SPECT/CT. Nucl Med Commun. 2015;36:1150–4. doi: 10.1097/MNM.0000000000000366. [DOI] [PubMed] [Google Scholar]
- 13.Krishnasetty V, Bonab AA, Fischman AJ, Halpern EF, Aquino SL. Comparison of standard-dose vs low-dose attenuation correction CT on image quality and positron emission tomographic attenuation correction. J Am Coll Radiol. 2008;5:579–84. doi: 10.1016/j.jacr.2007.12.007. [DOI] [PubMed] [Google Scholar]
- 14.Kumar S, Pandey AK, Sharma P, Malhotra A, Kumar R. Optimization of the CT acquisition protocol to reduce patient dose without compromising the diagnostic quality for PETCT: a phantom study. Nucl Med Commun. 2012;33:164–70. doi: 10.1097/MNM.0b013e32834e0993. [DOI] [PubMed] [Google Scholar]
- 15.Piwowarska-Bilska H, Hahn LJ, Birkenfeld B, Cichon-Bankowska K, Listewnik MH, Zorga P. Optimization of low-dose CT protocol in pediatric nuclear medicine imaging. J Nucl Med Technol. 2010;38:181–5. doi: 10.2967/jnmt.109.073486. [DOI] [PubMed] [Google Scholar]
- 16.Shrimpton PC, Hillier MC, Lewis MA, Dunn M. National survey of doses from CT in the UK: 2003. Br J Radiol. 2006;79:968–80. doi: 10.1259/bjr/93277434. [DOI] [PubMed] [Google Scholar]
- 17.Tonkopi E, Ross AA. Assessment of effective dose from cone beam CT imaging in SPECT/CT examination in comparison with other modalities. Radiat Prot Dosimetry. 2016;172:438–442. doi: 10.1093/rpd/ncv534. [DOI] [PubMed] [Google Scholar]
- 18.Brix G, Nekolla EA, Borowski M, Noßke D. Radiation risk and protection of patients in clinical SPECT/CT. Eur J Nucl Med Mol Imaging. 2014;41(Suppl 1):S125–36. doi: 10.1007/s00259-013-2543-3. [DOI] [PubMed] [Google Scholar]
- 19.Larkin AM, Serulle Y, Wagner S, Noz ME, Friedman K. Quantifying the increase in radiation exposure associated with SPECT/CT compared to SPECT alone for routine nuclear medicine examinations. Int J Mol Imaging. 2011;2011:897202. doi: 10.1155/2011/897202. [DOI] [PMC free article] [PubMed] [Google Scholar]
- 20.Sharma P, Sharma S, Ballal S, Bal C, Malhotra A, Kumar R. SPECT-CT in routine clinical practice: increase in patient radiation dose compared with SPECT alone. Nucl Med Commun. 2012;33:926–32. doi: 10.1097/MNM.0b013e328355b6d5. [DOI] [PubMed] [Google Scholar]
- 21.Hulme KW, Kappadath SC. Implications of CT noise and artifacts for quantitative 99mTc SPECT/CT imaging. Med Phys. 2014;41:042502. doi: 10.1118/1.4868511. [DOI] [PubMed] [Google Scholar]
- 22.Michels KB, Greenland S, Rosner BA. Does body mass index adequately capture the relation of body composition and body size to health outcomes? Am J Epidemiol. 1998;147:167–72. doi: 10.1093/oxfordjournals.aje.a009430. [DOI] [PubMed] [Google Scholar]
- 23.Kyle UG, Schutz Y, Dupertuis YM, Pichard C. Body composition interpretation. Contributions of the fat-free mass index and the body fat mass index. Nutrition. 2003;19:597–604. doi: 10.1016/s0899-9007(03)00061-3. [DOI] [PubMed] [Google Scholar]