Abstract
Although patch pipettes were initially designed to record extracellularly the elementary current events from muscle and neuron membranes, the whole‐cell and loose cell‐attached recording configurations proved to be useful tools for examination of signalling within and between nerve cells. In this Paton Prize Lecture, I will initially summarize work on electrical signalling within single neurons, describing communication between the dendritic compartments, soma and nerve terminals via forward‐ and backward‐propagating action potentials. The newly discovered dendritic excitability endows neurons with the capacity for coincidence detection of spatially separated subthreshold inputs. When these are occurring during a time window of tens of milliseconds, this information is broadcast to other cells by the initiation of bursts of action potentials (AP bursts). The occurrence of AP bursts critically impacts signalling between neurons that are controlled by target‐cell‐specific transmitter release mechanisms at downstream synapses even in different terminals of the same neuron. This can, in turn, induce mechanisms that underly synaptic plasticity when AP bursts occur within a short time window, both presynaptically in terminals and postsynaptically in dendrites. A fundamental question that arises from these findings is: ‘what are the possible functions of active dendritic excitability with respect to network dynamics in the intact cortex of behaving animals?’ To answer this question, I highlight in this review the functional and anatomical architectures of an average cortical column in the vibrissal (whisker) field of the somatosensory cortex (vS1), with an emphasis on the functions of layer 5 thick‐tufted cells (L5tt) embedded in this structure. Sensory‐evoked synaptic and action potential responses of these major cortical output neurons are compared with responses in the afferent pathway, viz. the neurons in primary somatosensory thalamus and in one of their efferent targets, the secondary somatosensory thalamus. Coincidence‐detection mechanisms appear to be implemented in vivo as judged from the occurrence of AP bursts. Three‐dimensional reconstructions of anatomical projections suggest that inputs of several combinations of thalamocortical projections and intra‐ and transcolumnar connections, specifically those from infragranular layers, could trigger active dendritic mechanisms that generate AP bursts. Finally, recordings from target cells of a column reveal the importance of AP bursts for signal transfer to these cells. The observations lead to the hypothesis that in vS1 cortex, the sensory afferent sensory code is transformed, at least in part, from a rate to an interval (burst) code that broadcasts the occurrence of whisker touch to different targets of L5tt cells. In addition, the occurrence of pre‐ and postsynaptic AP bursts may, in the long run, alter touch representation in cortex.
Abbreviations
- AP
action potential
- AP‐RF
receptive field mapped by action potential responses
- CC
corticocortical
- CT
corticothalamic
- 1D
one‐dimensional
- 3D
three‐dimensional
- EPSC
excitatory postsynaptic current
- EPSP
excitatory postsynaptic potential
- IC unit
intracortical unit (cells of a column with their reconstructed axons)
- IPSP
inhibitory postsynaptic potential
- L2
cortical layer 1
- L2
cortical layer 2
- L2/3
cortical layer 2/3
- L3
cortical layer 3
- L4
cortical layer 4
- L4ss cell
spiny stellate cell type in cortical layer 4
- L5B
cortical layer 5B
- L5st cell
slender‐tufted cell type in cortical layer 5
- L5tt cell
thick‐tufted cell type in cortical layer 5
- L6cc cell
cell type in cortical layer 6 with cortical axon projections
- POm
posteromedial nucleus of the thalamus
- PSP
postsynaptic potential
- PSP‐RF
receptive field, mapped by postsynaptic responses
- PW
principal whisker
- RF
receptive field
- STDP
spike timing‐dependent plasticity
- STP
short‐term plasticity
- SuW
surround whisker adjacent to principal whisker
- TC
thalamocortical
- TN
trigeminal nucleus
- VPM
ventral posteromedial nucleus of the thalamus
- vS1
vibrissal area of somatosensory cortex S1.
Introduction
My interest in cortical circuits began during my doctoral work in my adviser Otto Creutzfeldt's department at the Max Plank Institute for Psychiatry in Munich. In his laboratory, both intracellular recording from cortical neurons and research in neuroanatomy was pursued (Creutzfeldt, 1993). In fact, one of my first publications dealt with an attempt to understand the functional structure of the receptive field (RF) of retinal ganglion cells based on their dendrite anatomy and simulated functional input mapping (Creutzfeldt et al. 1968). As it became clear to me that synapses are the structures that are essential for understanding connections in the CNS, I applied for a postdoctoral position in Bernard Katz's laboratory at University College London, supported by a fellowship from the British Council and the earnings of my wife Christiane working as an eye doctor at the Moorfields Eye Hospital. At University College London, Bill Betz and myself developed a method to prepare muscle cells in vitro where the neuromuscular synapse was ‘disjuncted’, meaning that a nerve terminal separated from the muscle fibre, leaving a bare endplate with a high density of functional acetylcholine receptors (Betz & Sakmann, 1973). I also watched the wonders of membrane noise analysis, introduced by Bernard Katz and Ricardo Miledi. They derived the first estimates of ‘elementary’ acetylcholine‐gated ion channel signals at the neuromuscular endplate (Katz & Miledi, 1972) as well as the density of these receptors derived from toxin binding. In short, physiology had become molecular. Moving to Göttingen, I combined efforts with Erwin Neher to try to measure elementary events as single‐channel currents directly, a task in which we ultimately succeeded and proved the ion channel concept of membrane excitability. We shared a Nobel prize in 1991 ‘for discoveries concerning the function of single ion channels in cells’. In collaboration with Shosaku Numa, we identified the subunit composition of endplate channels, their channel‐forming subunits and single amino acids that determine the size of ion flow through open channels, as summarized in my Nobel Lecture (Sakmann, 1992).
Unexpectedly, patch pipettes became more useful than initially thought, because one could not only record small membrane currents with extracellular pipettes but could also gain low‐resistance access to the interior of a cell and thereby record the intracellular membrane potential (in the whole‐cell recording configuration) from small cells, such as mammalian brain cells. We used this recording configuration to examine synaptic transmission at a giant CNS synapse with precise control of pre‐ and postsynaptic membrane voltage and ion composition to sharpen the picture of local non‐uniform calcium ion signalling at the presynaptic membrane that drives transmitter release. This work is summarized in my Hodgkin–Huxley–Katz Lecture (Meinrenken et al. 2003). The whole‐cell recording configuration also brought me back to my initial field of interest, which was to understand signalling in neuronal pathways in subcellular detail.
In this Paton Prize Lecture, I will give a personal account of what we found using whole‐cell and loose‐patch unit recording from nerve cells in brain slices and intact brains by summarizing results on electrical signalling within neurons and then review the significance of intraneuronal signalling for network dynamics on a short time scale (coincidence detection of spatially separate synaptic inputs) and on a longer time scale (the strengthening and weakening of synaptic connectivity).
Methodology
The whole‐cell recording configuration of the patch‐clamp technique proved to be advantageous for the study of signalling in nerve cells embedded in their natural environment in vitro and in vivo. To accomplish such recordings, we first had to develop or adapt the patch pipette recording method to achieve dual and triple whole‐cell recordings from the same neuron or from several neurons in a network and then, at least in part, reconstruct this network in silico, so that we could uncover the major inputs and output targets of the recorded neurons.
The analysis of intraneuronal signalling was made possible by recordings from pyramidal nerve cells with long dendrites in brain slices prepared from the rodent somatosensory cortex. This cortex and the afferent pathway from the whisker pad, as illustrated schematically in the Supplementary material (Fig. S1A), is characterized by a highly stereotypical anatomy of columns and is relevant for tactile‐guided behaviours. The point‐to‐point anatomical pathway between the whisker pad and the cortical columns was described in detail by Woolsey & van der Loos (1970). In brain slices of this cortex, the columnar architecture is, at least partly, maintained (Fig. S1B). Cell‐type identification and whole‐cell recording in cortical slices were made under visual control (Fig. 1).
Figure 1. Whole‐cell voltage recording from a pyramidal cell in a parasagittal brain slice.
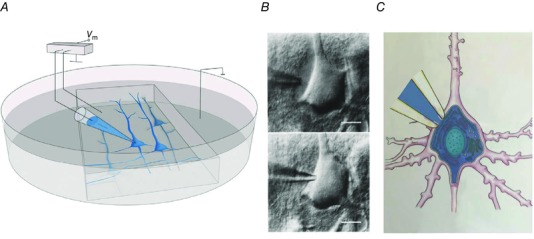
A, brain slice mounted in an experimental chamber for whole‐cell voltage recording via a patch pipette. B, differential interference contrast images of pipette tip approaching the cell body of a neuron and ‘cleaning’ of extracellular neuropil by positive pressure applied to the pipette solution (upper photomicrograph). Termination of positive pressure causes collapse of glial and neuropil tissue around the pipette tip and sealing of the pipette tip to the cell membrane (lower photomicrograph). Application of a brief pulse of negative pressure causes high‐resistance (gigaohm) contact between the pipette tip and cell membrane. The membrane patch drawn into the pipette tip is removed, e.g. by a brief increase in negative pressure (Hamill et al. 1981). Calibration bars represent 10 μm C, neuron cell body, proximal dendrites and initial segment of the axon. A pipette tip with open access between the pipette filling solution and the intracellular space of the neuron allows voltage recording and dialysing of the cell with pipette solution (blue).
In brain slices, the obvious questions to ask were related to the determinants of signal flow within a neuron and between pairs or small groups of neurons. Both types of questions required simultaneous recording with two or more patch pipettes, filling the recorded neurons with dyes and reconstructing their dendrites and axons in three dimensions. Finally, these reconstructions were stored in digital form to build a database that allowed us to use cluster analysis to classify neuron types by their cortical location and morphology (Meyer et al. 2010 a, b ).
Subsequent to the brain slice recordings, the techniques were modified for whole‐cell recordings and extracellular loose‐patch recording in vivo from the intact cortex using
‘blind’ sampling followed by reconstruction of cells filled with a histological marker (Brecht & Sakmann, 2002 a, b ; Brecht et al. 2003; Manns et al. 2004) and their registration in a three‐dimensional (3D) co‐ordinate system (Egger et al. 2012) as detailed below.
Techniques are useful only for the new insights they can provide. Thus, I will focus on new and unexpected results that we obtained from brain slice work and later from using the techniques, in modified versions, in the intact brain of rodents.
Single cortical cells
We focused initially on large pyramidal cells located in layer 5B (L5B) of the somatosensory cortex [layer 5 thick‐tufted (L5tt) cells]. These neurons have thick‐tufted apical dendrites that can be visualized for hundreds of micrometres and have large cell bodies that are clustered, facilitating paired recordings. These cells offer many advantages for the investigation of intra‐ and interneuronal signalling and served as a focus of much of the initial work with brain slices.
Dendritic excitability
With dual whole‐cell voltage recording from the same pyramidal cell (Fig. 2 A and B), we found several time‐sensitive dendritic mechanisms. These rely on the newly discovered active electrical properties of dendrites supporting action potentials in the signal‐receiving compartment of nerve cells. Action potentials in dendrites briefly depolarize the membrane potential and increase the inflow of calcium ions through voltage‐gated ion channels and through active glutamatergic synapses, and thus interfere with synaptic transmission.
Figure 2. Dual whole‐cell voltage recording from a pyramidal cell in a brain slice.
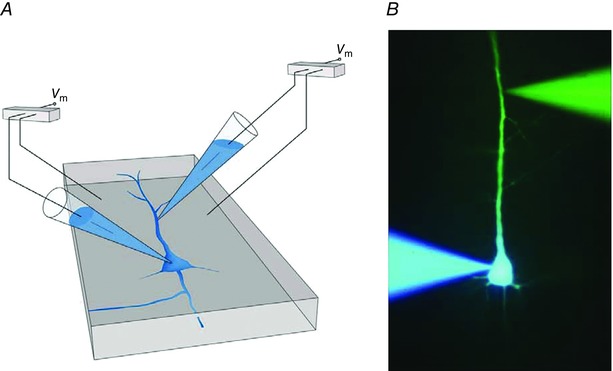
A, pyramidal cell and two pipettes recording membrane voltage from the soma and apical dendrite, respectively, of the same cell. B, verification of dual whole‐cell recording by filling a neuron with two different fluorescent indicators, blue and yellow, via two whole‐cell recording patch pipettes at the soma and apical dendrite of the same cell. Adapted from Stuart & Sakmann (1994).
The major result of multiple whole‐cell recordings made from the same pyramidal cell, pioneered by Greg Stuart (Stuart & Sakmann, 1994) and later by Matthew Larkum, was the insight (Larkum et al. 1999 b, 2001) that action potentials are initiated close to the axons’ initial segment as expected, but surprisingly, we also found that they not only propagate orthogradely into the main axon and axonal branches but also back into the dendrites (Fig. 3 A and B). They are referred to as back‐propagating action potentials (APs). Further analysis of active dendritic excitability showed that electrical signalling in dendrites occurs in both directions, i.e. also propagating along the apical dendrite towards the soma (Stuart et al. 1997; Larkum et al. 2001), or can sometimes remain local (Schiller et al. 1997; Spruston et al. 1997).
Figure 3. Back‐propagating action potential (AP) in the apical dendrite of a pyramidal cell.
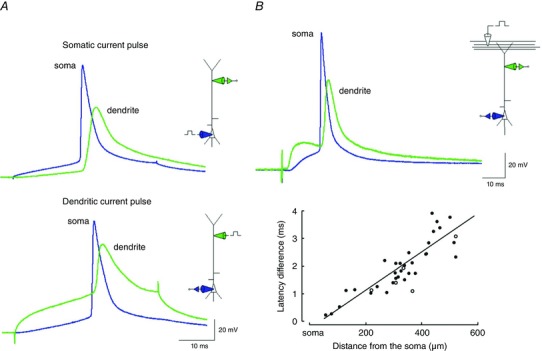
A, action potentials recorded simultaneously by the somatic and dendritic pipettes following current injection into the soma (upper panel) or apical dendrite (lower panel). Dendritic action potential follows somatic action potential. B, EPSPs evoked by synaptic stimulation in layer 1 evoke a somatic AP followed by a back‐propagating AP (upper panel, green trace). Measurement of the conduction velocity of back‐propagation (lower panel) by time differences between the onset of the somatic and dendritic action potentials for various locations of the dendritic recording pipette. Adapted from Stuart & Sakmann (1994).
There are several functions of active dendritic excitability to consider, but I concentrate here on those that are likely to change circuit dynamics, meaning the functional connectivity between cells and the distribution of excitation in the circuit, when the neuron under investigation is embedded in a well‐defined local network [referred to below as the vibrissal area of somatosensory cortex S1 (vS1) network].
Coincidence‐detection capability
One obvious possible function of dendritic APs is to interact with local dendritic synaptic potentials. Examining how, on a short time scale, back‐propagating APs interact with synaptic potentials, we discovered a mechanism that endows pyramidal cells (Fig. 4 A) with the capacity to detect the occurrence of spatially well‐separated synaptic inputs occurring within tens of milliseconds (Larkum et al. 1999 b; for an overview, see Stuart & Spruston, 2015). For a spiking pyramidal neuron, this means that a characteristic sequence of APs is evoked when independent synaptic potentials from spatially separate locations on the dendrite coincide. The dendrite is thus detecting the occurrence of near‐simultaneous feedforward information impinging on dendritic compartments and generating bursts of action potentials (AP bursts; Fig. 4 B). These bursts propagate both back into dendrites and forward along the axon into nerve terminals. Thus, AP bursts are likely to impact both sides of excitatory CNS synapses. On the one hand, bursts alter after forward propagation into the axonal arbor the amount of presynaptic release as a result of residual calcium and vesicle depletion (Neher, 2015); and on the other hand, bursts alter, via back‐propagation into dendrites, the size of postsynaptic potentials as a result of a changing driving potential and removal of magnesium block.
Figure 4. Coincidence‐detection capability of pyramidal cells.
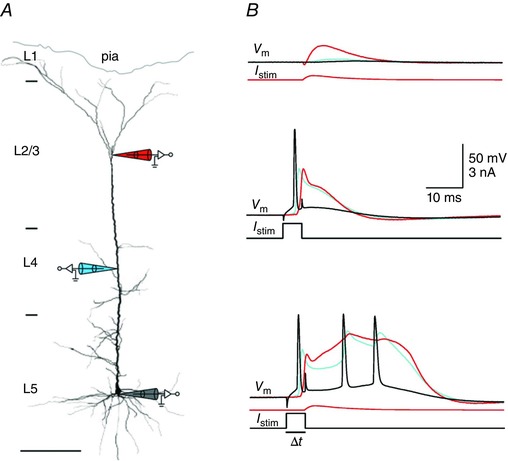
A, whole‐cell recording from the same pyramidal cell with three independent pipettes. Pipette tips are located at the soma and at the proximal [layer (L)4] and distal portions (L1/2) of the apical dendrite. B, whole‐cell voltage recording from the soma (black), proximal apical dendrite (blue) and distal apical dendrite (red). Upper panel shows time courses of the somatic (black) proximal (blue) and distal (red) dendritic membrane potential during stimulation by current injection into the distal apical dendrite (I stim). Middle panel shows somatic (black) and back‐propagating dendritic AP (red, distal and blue, proximal recording) in response to current injection into the soma (I stim). Lower panel shows that a burst of three somatic APs is evoked by combined somatic and dendritic current injection applied within a short time window (<50 ms; Δt). Time courses of somatic and dendritic current injections are shown below the voltage traces. Adapted from Larkum et al. (1999 b).
An unexpected effect of back‐propagating AP bursts was the activation of a calcium ion‐dependent plateau potential referred to as the back‐propagation‐activated calcium potential. It can initiate forward‐propagating dendritic APs and electrically couples the apical and basal dendritic zones (Larkum et al. 2001).
Dendritic initiation zones
Conceptually, the dendrites of pyramidal cells may be divided into three AP trigger zones, designated in Fig. 5 A as compartments A, B and C (Larkum et al. 2001). Input to the basal dendrite input zone (corresponding to compartment C) evokes a single AP in the axon initial segment (Fig. 5 B, middle trace) that propagates back into the dendrites as described above and forward into the axon arbor. Input to the apical dendrites (compartment A), when combined with basal suprathreshold input (compartment C), generates AP bursts (Fig. 4 B, bottom trace). Larger input to compartment A can generate locally restricted calcium ion‐dependent regenerative potentials that might develop into a broad dendritic AP propagating forward towards the soma and by interaction with input from the basal dendrites generate an AP burst (Fig. 5 B, top trace). Importantly, this apical dendritic input was attenuated by stimulating local GABAergic neurons, which also abolished coincidence detection (Larkum et al. 1999 b). A third zone, formed by apical oblique dendrites (compartment B), is located between the basal and apical tuft dendritic zones (Fig. 5 A). This zone is characteristic for a subgroup of the ensemble of L5tt cells that we reconstructed, with dendrites extending within cortical layer 4. In these cells, additional combinations of inputs are also likely to generate AP burst patterns (as illustrated in Fig. 5 B, bottom trace) for coincident inputs from the basal and oblique dendritic zones (compartments C and B).
Figure 5. Action potential burst patterns generated by a thick‐tufted pyramidal cell in layer 5B (L5tt cell) by current injection into different dendritic zones of the cell.
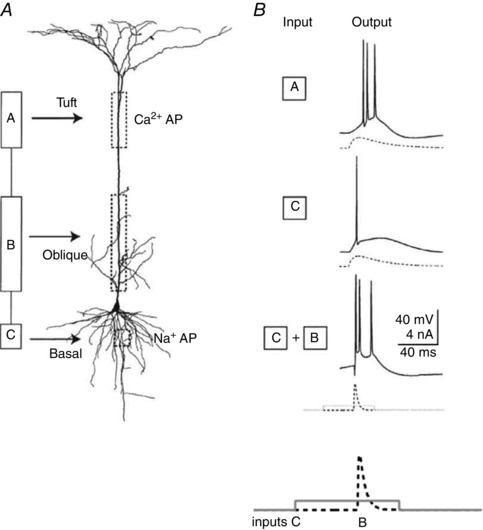
A, dendritic zones designated as functional compartments A, B and C and a reconstruction of the basal, apical oblique and apical tuft dendrites. B, AP burst patterns evoked by current injection into different compartments. Note tripling of the number of APs generated when currents are injected near simultaneously, during a time window of tens of milliseconds, into the soma (compartment C) and proximal oblique dendrites (compartment B). Large current injections into tuft dendrites can cause a calcium‐ion‐dependent plateau potential and a single forward‐propagating dendritic AP, resulting eventually in an AP burst (see Fig. 2 of Larkum et al. 2001). The somatic AP burst (top trace) also causes back‐propagating APs. Action potential burst generation by an apical input is facilitated by inputs to compartment B. The time course of current injections is shown below the voltage traces for compartments C and B. Adapted from Larkum et al. (2001).
In summary, a three‐compartment model (A, B and C) of dendritic zones can describe the generation of AP bursts. It comprises the distal dendritic and basal zones, connected by the proximal apical dendritic zone with its oblique dendrites. Each compartment can contribute to AP initiation and to the pattern of AP discharge in a distinct manner. The anatomical equivalents of the compartments, the dendritic zones, span different cortical layers. Thus, the AP pattern of the L5 thick‐tufted pyramids that have their soma located in L5B and dendrites that span most of the cortical width is likely to reflect the laminar distribution of coincident feedforward synaptic input (Hay et al. 2011).
Implications of AP bursting in a network
Modulation of connectivity in the short term
What is the effect of AP bursts on synaptic transmission? To answer this, we examined synaptic transmission between several connected cells and found that AP bursts of a presynaptic pyramidal cell elicit very different frequency‐dependent changes in the size of postsynaptic potentials in the target cells. A change in the effectiveness of synaptic transmission on the time scale of tens of milliseconds is often referred to as short‐term plasticity (STP). Dual recordings from connected pairs of pyramidal cells indicated that in younger animals AP bursts caused a progressive decrease in postsynaptic potential (PSP) amplitudes, referred to as synaptic depression. In older animals, depression was markedly reduced or changed to synaptic facilitation, indicating that the release mechanism is not rigid but can be modulated in the long term. The obvious question was thus whether frequency‐dependent release depends on the target‐cell type, as demonstrated previously in connections of the insect nervous system (Katz et al. 1993). This we found was indeed the case also in the mammalian cortex (Reyes et al. 1998; Reyes & Sakmann, 1999). To arrive at this conclusion, Alex Reyes made simultaneous recordings from at least two types of postsynaptic target cells while stimulating a connected presynaptic pyramidal cell.
Excitatory‐to‐inhibitory connections
Fig. 6 A shows schematically the recording arrangement for simultaneous recording from a local circuit in a slice of cortex consisting of three cells connected by excitatory synapses. Here, a pyramidal cell targets two types of inhibitory neurons (Fig. 6 B). After the recording of their respective connections, the expression of molecular markers was used for inhibitory cell‐type classification, indicating that the pyramidal cell targeted two different cell types. Clearly, the frequency‐dependent glutamate release from the pyramidal cell onto two inhibitory cell types is target‐cell specific (Fig. 6 C), meaning that the same sequence of APs in a burst elicited by current injection into the soma of the pyramidal cell has opposite effects on synaptic transmission; facilitation in one cell and depression in the other cell, depending on the cell type of the target.
Figure 6. Target‐cell specificity of frequency‐dependent synaptic transmitter release from pyramidal cell terminals.
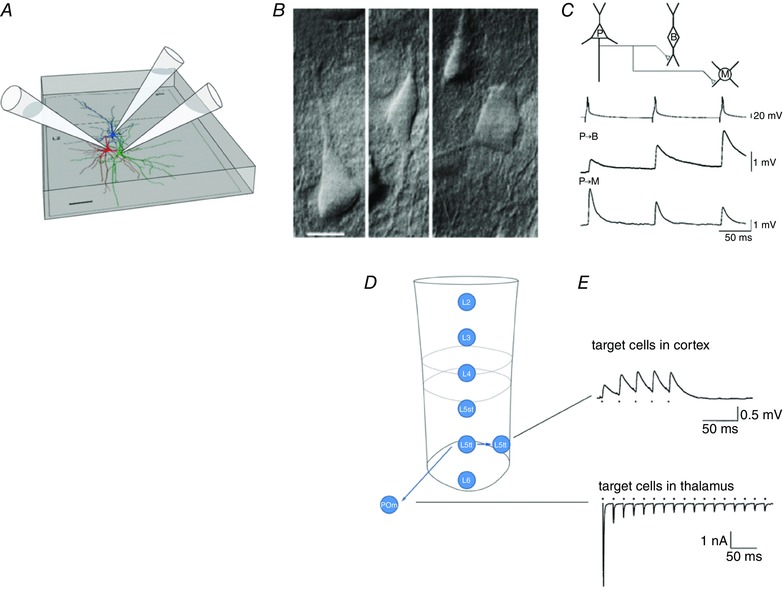
A, simultaneous whole‐cell recording from three neurons. Their somata and dendrites were reconstructed. Cell types are shown in different colours; the presynaptic excitatory pyramidal cell is blue, and the two inhibitory target cells are in red and green, respectively. Scalebar: 50 μm. B, differential interference contrast photomicrograph of a pyramidal cell (left) and two types of inhibitory cells (middle and right) located in the supragranular cortical layer. Scalebar: 10 μm. C, target‐cell dependence of EPSP amplitudes recorded simultaneously in two inhibitory target cells. The EPSPs were evoked by repetitive APs evoked in the pyramidal cell. Note the difference in frequency‐dependent response amplitudes in the two target cells. D, columnar layers and projection of L5tt cells located in layer 5B to two types of excitatory target cells, in the cortex (L5tt cells in the same column) and in the thalamus [principal cells in the posteromedial nucleus of the thalamus (POm)], respectively. E, upper panel shows a paired whole‐cell voltage recording from two L5tt cells illustrating slight frequency‐dependent facilitation of EPSP amplitude in the L5tt target cell. Lower panel is a recording of EPSCs from a POm principal cell. There is strong frequency‐dependent amplitude depression during repetitive stimulation of individual giant boutons of a L5tt cell, forming a giant synapse on the thalamic POm cell. Modified from Reyes et al. (1998), Reyes & Sakmann (1999) and Groh et al. (2008).
Excitatory‐to‐excitatory connections
When we tried to find target‐cell specificity of cortical excitatory connections, there was no systematic rule apparent in the frequency range studied. However, dual recordings of synaptic connections made by pyramidal (L5tt) cells with cortical cells on the one hand and subcortical target cells on the other revealed a large difference in STP (Fig. 6 D and E). The amplitude of excitatory PSPs in corticocortical (CC) connections between pairs of L5tt cells located in the same column is small, i.e. far below AP threshold, and is characterized by frequency‐dependent facilitation or depression as mentioned above (Fig. 6 E, upper trace). In contrast, corticothalamic (CT) synapses made by the same cell type evoked giant EPSPs (Groh et al. 2008), which can reach AP threshold. In the frequency range studied, the underlying EPSCs are characterized by strong frequency‐dependent depression (Fig. 6 E, lower trace). If it is assumed that CC and CT projections of L5tt pyramids are collaterals of the same axon, this result indicates that transmitter release from L5tt terminals is also target‐cell specific in their connections with excitatory cells.
In summary, these experiments showed that frequency‐dependent synaptic transmission depends crucially on the downstream target‐cell type. This was unequivocally established for connections from pyramidal cells onto one inhibitory subtype versus another and is likely also to be true for connections from cortical pyramidal cells to other cortical pyramids versus thalamic neurons. Such differences in target‐cell‐dependent transmitter release mechanisms are likely to influence strongly the state of a network, when AP bursts are generated by the constituent neurons of the network.
Spike timing‐dependent plasticity strengthens or weakens synaptic connections
The discovery of APs in dendrites and the associated dendritic plateau potentials and intracellular calcium signals during AP burst activity prompted us to examine synaptic transmission in pairs of cells in conditions when both the pre‐ and the postsynaptic neuron were generating AP bursts. Bursts increase, via presynaptic depolarization, the calcium ion activity in cortical boutons, leading to glutamate release (Koester & Sakmann, 2000), as expected from the work of Katz and Miledi on squid (Katz & Miledi, 1967). Depolarization of the dendrites leads to increases in calcium ion concentration in the dendritic trunk, dendritic branches and their spines (Markram et al. 1995; Koester & Sakmann, 1998). The increase is attributable to calcium inflow through voltage‐dependent calcium‐selective channels, and through the NMDA receptor type and to a lesser degree through the AMPA recptor type of glutamate receptor channels (Burnashev et al. 1996). The increase in spine calcium‐ion concentration modulates glutamatergic synapses by triggering rearrangements and modification of postsynaptic glutamate receptor channels and altering synaptic gain (the size of the PSP) by presynaptic release mechanisms.
To study reciprocal pre‐ and postsynaptic interactions, the APs had to be timed accurately in both pre‐ and postsynaptic neurons and required paired whole‐cell recordings followed by reconstructions of cell morphology and synapse locations. I reasoned that effects of subtle differences in timing between the back‐propagating AP and the local EPSP of the postsynaptic cell could be missed when only extracellular stimulation was used. Conduction time spread, for example, or overlapping synaptic innervation domains and coactivation of inhibitory axons could mask details of a synaptic interaction. Furthermore, the location of synapses on dendrites had to be known to estimate possible dendritic attenuation of EPSPs in the postsynaptic cell.
The spread of axon collaterals of L5tt pyramidal cells in the horizontal (tangential) plane is narrow (Fig. 7 A), indicating that to find connected neurons in paired recordings, neighbouring cells should be investigated, as synapses are expected to be clustered on the basal dendrites (Markram et al. 1997 a). Henry Markram achieved precise control of AP timing when recording from pairs, including pairs of reciprocally coupled cells. Increases or decreases of synapse strength were demonstrated in pairs of cells that were reconstructed by Michael Frotscher and Joachim Lübke (Markram et al. 1997 a, b ). Shifts in timing of pre‐ and postsynaptic action potentials revealed either a long‐lasting increase (Fig. 7 B, lower panel) or a lasting decrease of the average amplitude of evoked EPSPs. This property of excitatory synapses is now also referred to as spike timing‐dependent plasticity (STDP). Changes in synaptic strength following AP bursts in paired recordings are seen not only for L5tt connections but also in connections between layer 2/3 (L2/3) pyramidal cells (Nevian & Sakmann, 2004) as well as in connections between L2/3 and L5 neurons (Kampa et al. 2007; Letzkus et al. 2006).
Figure 7. Spike timing‐dependent plasticity (STDP) in pairs of connected L5tt cells.
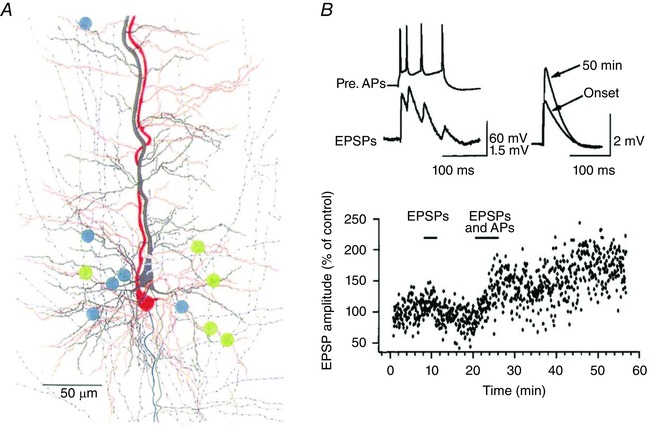
A, two reconstructed L5tt pyramidal cells located in L5B in the same column. Cells were connected reciprocally. The location of their mutual synapses is indicated by blue and green dots, respectively. B, upper panel, AP burst in the presynaptic cell evokes EPSPs in the postsynaptic cell. Unitary EPSPs before (onset) and after pairing EPSPs with postsynaptic APs for 50 min. Lower panel, time course in increase of evoked unitary EPSP amplitude after pairing as indicated (EPSPs and APs). From Markram et al. (1997 b), with permission.
Summary
The combination of whole‐cell recording in brain slices with improved visualization techniques, followed by reconstruction and registration of cells and their connections, led to new insights into mechanisms that might alter the dynamic behaviour in neuronal networks. Recording from single cells or from several connected single cells, in combination with anatomical reconstructions, led to the discovery of the new and interrelated cellular phenomena of dendritic excitability and coincidence‐detection capability that generate AP bursts. Examination of the effects of AP bursts revealed two mechanisms that are relevant for network dynamics in cortical circuits: on a shorter time scale, the target‐cell‐dependent STP, and on a longer time scale, STDP may strengthen or weaken connections and, ultimately, rewire connections. These cellular mechanisms, discovered in vitro, are schematically summarized in Fig. S2.
However, the main drawback in examining what the effects of these mechanisms on network dynamics might be is that the axon morphology of networks in brain slices is severely compromised by the limited volume of a slice of cortex (with a thickness of ∼0.3 mm). Thus, as far as network connections are concerned, even within the putative smallest functional unit, a column in the primary somatosensory cortex or slabs in the visual cortex, brain slices are of limited usefulness, despite attempts to reconstruct anatomical and functional columns from in vitro data (Markram, 2006; Jiang et al. 2015).
We therefore moved to in vivo experiments with the aim of synthesizing anatomical and functional columns in silico.
Single cortical columns
To examine what function(s) dendritic APs and the associated mechanisms of coincidence detection and AP burst generation may have in the intact cortex, it is essential to measure, during sensory stimulation, the sub‐ and suprathreshold signals (EPSPs, IPSPs and APs) in the different cell types of the intact cortex. It is also essential to delineate the anatomical connections between the ensembles of cell types in cortical networks, in particular those of L5tt cells, in order to make educated guesses about the source of their synaptic inputs that might drive coincidence detection. Finally, the outputs of cortex, in particular that of cells located in L5, communicate features of the sensory input to other parts of the brain that might or might not trigger a behavioural response and thus have to be measured in the intact brain.
From brain slices to brains
Thus, I ventured, first with Michael Brecht, into the more puzzling world of in vivo recordings from primary somatosensory cortex, with the aim of recording from and reconstructing defined networks of a cortical column, supposed to be a building block of the cortex (Mountcastle, 1957; Rakic, 1988). The vibrissal cortex is advantageous because a point‐to‐point projection exists connecting the peripheral mechanosensitive receptors in the whisker pad to specific columns in the cortical representational area, as illustrated in Fig. S1A and Fig. 8 A. Research on columns in rodent somatosensory cortex was pioneered by Woolsey & van der Loos (1970). They showed that the vibrissal area of S1 (vS1, or the posterior medial barrel field) offers a number of advantages, such as the possibility to make recordings from defined small volumes of cortex columns with a roughly cylindrical shape (average diameter of 0.38 mm, 2 mm length in rat cortex) in analogous areas of different animals, with a sufficiently high, that is columnar, precision. It is also highly conserved functionally, as demonstrated by unit recordings in rodent cortex (Armstrong‐James & Fox, 1987; Simons & Carvel, 1989). Columnar resolution is reached by histochemical landmarks (cytochrome oxidase staining) that specifically label thalamocortical (TC) axon terminals, which form column‐specific bundles in cortical layer 4 (L4) and thus delineate anatomical and functional whisker‐related columns. The results of experiments on specific cortical columns (e.g. the D3 column; Fig. 8 A) can be averaged, reducing the effects of anisotropy in the geometry of columns across animals (Egger et al. 2012).
Figure 8. Whole‐cell voltage recording and receptive field (RF) mapping of cortical cells identified post hoc in the vibrissal area of somatosensory cortex (vS1).
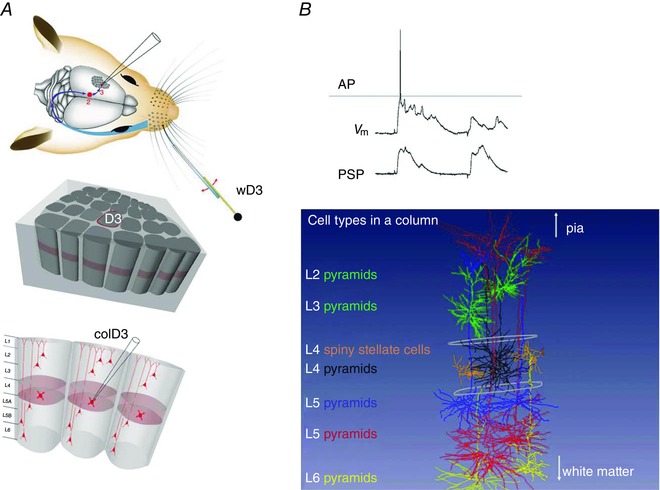
A, anatomy of the whisker system at different resolutions. Top panel, topology of the afferent lemniscal pathway from facial whisker pad to vS1 cortex (blue arrows). Deflection of whisker D3 by a piezo actuator. Middle and bottom panels, column D3, with upper circumference highlighted in red, is driven by whisker wD3 and is designated as the principal whisker column (PW column). The vertical division of columnar layers into granular (light red), supragranular and infragranular layers, respectively, is shown in the lower panel. Schematic drawing of the whisker system in the top panel is modified from Knott et al. (2002). B, upper panel, voltage recording of whisker‐evoked sub‐ and suprathreshold responses from a spiny stellate cell located in L4 of the PW column. Upper trace, single postsynaptic potential (PSP) response eliciting an AP. Lower trace, averaged PSP responses. From Brecht & Sakmann (2002 b), with permission. Lower panel, examples of recorded and post hoc three‐dimensionally (3D) reconstructed cells that are registered into a column in silico. Column length is ∼2 mm (in rats). This value is the distance between the pia and white matter. The column width is given by the outlines of barrels (diameter of ∼350 μm) in the granular layer (indicated schematically in white). Different cell types are designated by the layer location of their cell body and a descriptor of soma and dendrite geometry, given in different colours on the left side.
In the following sections, whole‐cell recordings of synaptic inputs to different cell types followed by the respective cell reconstructions are described, quantifying the electrical representation of a whisker deflection at the level of synaptic potentials with columnar resolution and cells identified post hoc. A description of a whisker deflection at the output AP level, delineating the cell‐type‐specific outputs, is then given. In addition, the time dependencies of stimulus representations are described. The results indicate that the whisker space (or haptic space) is represented in parallel across different layers and that the representation changes rapidly with time and is specific for different cell types and layers. The representations in layer 5 neurons, specifically in thick‐tufted pyramids in L5B (L5tt cells) are described in more detail. These cells constitute the major output neurons, with cortical and subcortical targets that connect vS1 to premotor areas, and are likely to be involved in decision‐making in simple discrimination tasks, such as gap crossing (Hutson & Masterton, 1986).
In vivo recording
Recording from identified cells in vivo involved the following four steps: (i) whole‐cell recording in the vibrissal field (Margrie et al. 2002) to map the evoked sub‐ and suprathreshold postsynaptic potentials (PSPs) and APs (Fig. 8 B, upper panel) and to construct the respective receptive field (RF) maps; (ii) filling of the recorded neuron with a histological marker; (iii) reconstruction of the soma, dendrites and its cortical axon collaterals; and, finally, (iv) registration of the reconstruction in 3D co‐ordinates of a column as illustrated paradigmatically for an L4 spiny stellate cell and other cell types (Fig. 8 B, lower panel). We used these methods to reconstruct systematically soma depth location, dendrite morphology and intracortical axon projections of recorded neurons across layers 2–6. The resultant data base of 3D neuron anatomy (Oberlaender et al. 2012 b; Narayanan et al. 2015) made it possible to compare functional architectures, such as the receptive field of PSPs (PSP‐RF) and that of action potentials (AP‐RF) of the different cell types with regard to the location of their somata and their dendritic and axonal spread.
The aim of whole‐cell recording followed by 3D reconstruction was to find out how RF properties are related to the geometry of cell types, specifically to the spread of their dendrites and axons within and between columns to delineate possible synaptic input projections (Brecht & Sakmann, 2002 b; Brecht et al. 2003) that generate RF maps. In addition, a comparison of PSP‐RFs and AP‐RFs was essential to find out how, in different cell types, the AP‐RF depends on the synaptic input map.
Christiaan DeKock then also used the loose‐patch configuration for extracellular unit recording followed by 3D cell reconstruction to obtain an unbiased map of cell‐type‐specific unit activity (DeKock et al. 2007). Both whole‐cell and loose‐patch recording methods rely on the initial monitoring (Margrie et al. 2002) of a loose (meaning low‐resistance) contact between the recording pipette tip and the cell membrane, independent of ongoing spiking. Such recordings provide a less biased sample of cell activity than those made with conventional extracellular recording.
Functional architecture of a column
All cells in each layer recorded from via whole‐cell recording in a principal whisker (PW) column showed evoked EPSP responses, but only a small fraction responded with APs. Thus, a first insight from in vivo whole‐cell recordings was that cortical AP activity, both spontaneous and evoked, is much sparser (Brecht & Sakmann, 2002 a; Margrie et al. 2002) than anticipated from the earlier unit recordings. In agreement with these results were the data obtained by loose‐patch extracellular unit recordings (DeKock et al. 2007).
Short‐latency PSP inputs
The latency for the EPSP onset in a spiny stellate cell in the granular layer (L4ss cell) of the PW column (Fig. S3A) is of the order of 10 ms after the beginning of the whisker deflection (Fig. S3B). This value is shorter than, for example, responses of cells in the visual cortex, indicating that in rodents the whisker system is one of the fastest‐responding representational sensory systems.
The evoked PSP rises steeply and is characterized by several inflection points during the first 30 ms after stimulus onset, presumably indicating additional delayed input to the PW column. P ostsynaptic potential responses elicited by surrounding whisker (SuW) deflection begin a few milliseconds later than the PW response and have lower amplitudes (Fig. S3B). Longer EPSP onset latencies following SuW deflections are observed also in ventral posteromedial nucleus of the thalamus (VPM) barreloids but evoke APs only infrequently, suggesting that the VPM output precisely reports deflection of a single PW. Multiwhisker cells in the VPM could cause the delayed cortical responses to SuW deflection (Brecht & Sakmann, 2002 a).
Multilayer thalamic PSP input
How do these PSP responses compare with those of other cell types recorded in other layers in response to similar stimuli? To our initial surprise, the onset latency of PSPs recorded in cells located in layers below and above layer 4 had values comparable to PSPs in the granular layer, as illustrated in Fig. 9 A and B for PSPs recorded in layer 5B and layer 3, respectively (Brecht & Sakmann, 2002 b; Brecht et al. 2003; Manns et al. 2004). The observation of similar PSP onset latencies along the vertical axis of a PW column suggested that the different layers are excited near simultaneously, as shown schematically in Fig. 9 C, with the exception of pyramids in layer 2. These respond significantly later than those in the deeper layers, comparable to the cells located in the septa (Brecht et al. 2003).
Figure 9. Near‐simultaneous onset of whisker‐evoked PSP responses in different layers of the PW column.
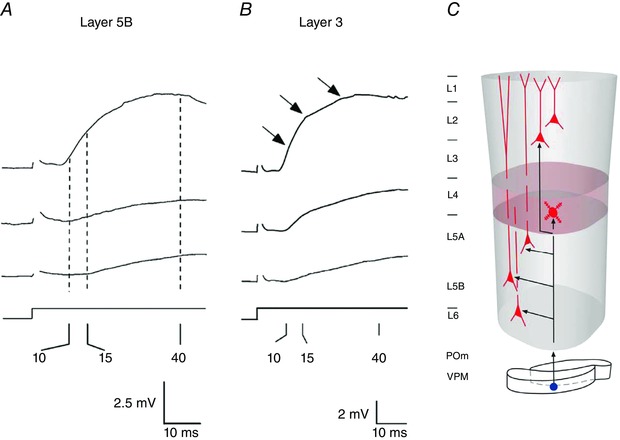
A and B, whisker‐evoked EPSP recordings from infragranular layer 5B (A) and supragranular layer 3 (B). The EPSP onset latencies are of the order of 8–10 ms. Onset latencies are similar to those measured in cells located in the granular layer (L4, shown in Fig. S3). Numbers below axes denote response latencies in milliseconds. C, schematic illustration of near‐simultaneous whisker‐evoked PSP onset in different layers via ventral posteromedial nucleus of the thalamus (VPM) thalamocortical afferents. Modified from Helmstaedter et al. (2007).
From a functional point of view, as derived from synaptic responses, the observations suggested a subdivision in the vibrissal field in the tangential plane between columnar cells and septal cells. In addition, there is also an orthogonal, vertically oriented subdivision within a column between early responding layers 6–3 on the one hand and later responding layer 2 on the other. The fact that PSP responses of pyramids in layer 2 are delayed (Brecht et al. 2003) might indicate that they are not monosynaptically innervated by VPM axon projections but rather driven by L4 and L3 cell axons. A further functional separation of the layers of a column into a lower stratum and an upper stratum was demonstrated by Constantinople & Bruno (2013). Collectively, these observations imply that dendrites of the vast majority of cells, located in the PW column, are monosynaptically connected targets of axons arising from a whisker‐specific barreloid in the VPM. Anatomical 3D reconstructions of VPM axons and the respective dendrites in a column targeted by VPM barreloid cells demonstrated a column‐restricted dense overlap of VPM axons and dendrites extending up to the basal dendrites of L3 pyramids (Meyer et al. 2010 a; Oberlaender et al. 2012 b).
Weak and synchronous synaptic connections
In an impressive effort, Randy Bruno then demonstrated that sensory inputs to layer 4 cells are weak (Fig. S4A and B), meaning that unitary EPSPs in vivo are small, of the order of a few hundred microvolts to a millivolt (Bruno & Sakmann, 2006). Likewise, weak unitary synaptic potentials were observed in in vitro experiments for the intracolumnar connection between L4 spiny stellate cells and supragranular pyramids in L2 and L3, respectively (Silver et al. 2003). These findings imply that unitary EPSPs in a column are far from reaching depolarizations that could initiate evoked APs. As whisker deflections reliably evoke APs in L4 spiny stellate cells, the simplest assumption then is that upon whisker deflection, tens of unitary EPSPs are likely to occur near synchronously to reach the AP threshold. Indeed, we observed connected pairs relatively frequently, consistent with high convergence in this VPM‐to‐L4 pathway. Comparable conclusions apply for intracolumnar connections in series, e.g. the L4‐to‐L2/3 pathway (Silver et al. 2003).
Target‐cell‐specific PSP adaptation
Another potentially important difference between the cell types in a column is the specific PSP response to repeated whisker deflections, illustrated in Fig. S5. The adaptation of synaptic responses shows a division between infragranular layers, with extremely strong frequency‐dependent adaptation (Fig. S5A) and granular and supragranular layers with less adaptation or a sustained response (Fig. S5B). This observation adds further evidence pointing to functional division between the deep stratum below the granular layer and the upper stratum (Constantinople & Bruno, 2013).
Width of PSP‐RFs, point spread function and shared spines
The whole‐cell measurements demonstrated that the PSP‐RFs of all exitatory cell types are broad multiwhisker maps, meaning that PSPs were elicited by deflection not only of the PW, but also of SuWs (Fig. 10 A and Fig. S3). This is likely to reflect the extensive horizontal spread of axons between SuW and PW columns and is consistent with the measurement of the point spread function of a single whisker deflection in vS1 by voltage‐sensitive dye imaging. For the supragranular layers, as seen by voltage‐sensitive dye imaging, excitation spreads from being restricted initially to the PW column to almost the entire barrel field within several tens of milliseconds (Petersen et al. 2003; Wallace & Sakmann, 2008).The PSP‐RFs indicate that the representation of a deflection at the level of synaptic potentials is likely to be multicolumnar in all layers. An example of a multiwhisker PSP‐RF is illustrated for an L4 cell in Fig. 10 B (upper panel). We also found when mapping the PSP‐RF that they are strongly time dependent, indicating that at the level PSPs the representation of a deflection begins rapidly and then slowly fades. Again, the time course of PSP‐RF activation and fading is layer and cell‐type specific.
Figure 10. Receptive fields of PSP input and AP output of spiny stellate cells located in the granular layer (L4) of a PW column.
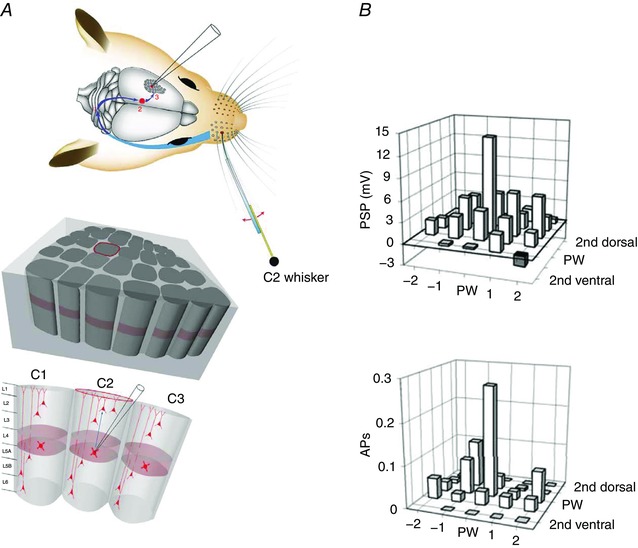
A, anatomy of the rodent whisker system at different resolutions as described in legend of Fig. 8. Upper panel, lemniscal afferent pathway (blue) activated by deflection of the C2 whisker. Middle panel, pseudo‐3D view of the vS1 area in a mediolateral direction with E‐row columns in front and D‐row and C‐row columns behind. The location of column C2 in the middle panel is indicated by the red outline of the upper circumference of the column. Lower panel, whole‐cell recording from a spiny cell located in the granular layer of the C2 column. B, bar histogram maps of response amplitudes recorded from L4 cells evoked by deflection of PW and specified surround whiskers (SuWs), respectively. Upper panel, PSP‐RF map. Lower panel, AP‐RF map. The cell body of the recorded cell was located in the granular layer of the C2 column. The C2 whisker is the PW. Note the narrower AP‐RF map. Modified from Brecht & Sakmann (2002 b).
Shared spines
A surprising finding in this context was the demonstration of shared spines in L2/3 cell dendrites with broad PSP‐RFs activated by both PW and SuW deflection via ‘feeder cells’ (Varga et al. 2011). It showed that their PSP‐RF (and presumably also the AP‐RF) can be determined by synaptic inputs arising not only from the horizontal spread of L2/3 cell axons but in addition from axon projections of cells in the deeper layers (granular and infragranular) of neighbouring columns. Presumably, such inputs from SuW columns are able to set the excitability of a column in response to a PW stimulus.
Action potential output maps are narrower than PSP input maps
In all excitatory cell types, the AP maps are also of a multiwhisker type, meaning multicolumnar representation of a deflection at the level of APs (Fig. 10 B, lower panel) and time dependent (DeKock et al. 2007). Response latencies of AP‐RFs confirmed the near‐simultaneous excitation also at the AP output levels of a column and they also revealed large cell‐type‐specific differences in the magnitude of their AP output (DeKock et al. 2007). The broadest AP‐RFs are those of L5tt and of L2 pyramids (DeKock et al. 2007). This means that the output of a cell type with a broad AP‐RF is likely to reflect both PW and SuW deflections. Cell types with a narrow RF, such as L4ss cells, are activated mostly by the PW. The strength of a particular cell type in exciting other cells in the PW column and the surrounding columns (SuW columns) depends on the spread of its axon projections, as described below by the ‘intracortical (IC) unit’. These might be mostly column restricted, as in the case of L4ss or L5tt cells, which have limited horizontal axonal spread and mediate signalling mainly within the PW column, or that axonal spread is multicolumnar and, accordingly, excitation can be multicolumnar and underlies signalling between columns, as is the case of slender‐tufted cells in cortical layer 5 (L5st cells) and L3 pyramids.
Summary on columns PSP and AP architecture
Excitatory cells in each layer of a column are characterized by, on average, sparse spontaneous and evoked AP activity and have two different types of RFs, namely a synaptic input PSP‐RF and an output AP‐RF. The dynamic input PSP‐RFs reflect the time‐dependent change in the strength of synaptic inputs from within and between columns. All layers have multicolumnar RFs that increase and then decrease in width over time. The AP‐RF is without exception spatially narrower than the PSP‐RF. A column is subdivided functionally into combinations of layers that share properties, such as infragranular/granular layers that respond faster than the upper (L2) ones. Furthermore, a functional subdivision into two almost independent strata became obvious, with a lower one dominated by layer L5tt cells in L5B and an upper one dominated by cells in L4, such as L4ss cells. Surprisingly, the infragranular layers can be activated to emit spikes independently of the granular/supragranular layers (Constantinople & Bruno, 2013). Finally, the AP output of a column is dominated by L5tt cells, which project extensively to subcortical targets and will therefore be described in more detail in the following sections.
Layer 5 thick‐tufted pyramid cells: integrators, coincidence detectors and routers
Thick‐tufted pyramids designated as L5tt cells have their cell body in layer 5B. Their dendrites spread from upper L6 to layer 1 (L1), almost across the entire thickness of the cortex, such that they might ‘probe’ input signals from all cortical layers. They are embedded in the vS1 network as recipients of TC and CC input (Wimmer et al. 2010; Oberlaender et al. 2012 b; Narayanan et al. 2015) and as contributors to CT output (Reichova & Sherman, 2004; Groh et al. 2008; Mease et al. 2016 b, c ). Here, I focus first on the multicolumnar representation of whisker touch and signalling the occurrence of touch to target cells via AP bursts. In a later section is described the partial reconstruction of the vS1 network, which allowed us to delineate anatomical pathways mediating these functions. In addition to these topics, I describe the spike transfer across the efferent synapses to their target cells located in the cortex and a subcortical nucleus in the thalamus in more detail.
Input physiology of L5tt cells: PSP onset latency and broad PSP‐RF
Short‐onset latency suggests direct thalamic excitation
The findings of near‐simultaneous PSP onsets and AP excitation in layers 3, 4, 5 and 6 suggested direct excitation by the VPM (see Discussion by DeKock et al. 2007). Also, the structural overlap between VPM axons and L5tt dendrites (Meyer et al. 2010 a; Oberlaender et al. 2012 b) suggested monosynaptic TC input. The view that deep layers (and L5tt cells) are activated independently of L4 cells was then unambiguously proved by Constantinople & Bruno (2013) demonstrating direct monosynaptic connections between VPM and L5tt cells.
Broad PSP receptive fields suggest crosstalk between labelled lines
In addition to the short‐latency EPSP input, a characteristic feature of L5tt cells is their relatively broad and hence unspecific RFs. Fig. 11 illustrates RFs of two cell types with somata located in L5: that of a cell located in the L5A of column D3 and that of a cell located somewhat deeper in L5B. Both were excited by the corresponding principal whisker, D3 (Fig. 11 A). The two cells were recorded sequentially, and the PSP‐RFs of both cells are multiwhisker maps. The PSP‐RF of the deeper cell is, however, shallower, as illustrated by the respective bar histograms (Fig. 11 B). Reconstructions of the cells (Fig. 11 C) showed that the cell located in L5B was an L5tt cell (red soma and dendrites). The broad PSP‐RF of L5tt cells developed within a few tens of milliseconds after stimulus onset (Fig. 9 of Manns et al. 2004), suggesting that after the initial PW‐PSP, evoked by VPM input, additional SuW inputs contributed to the broad PSP‐RF via horizontal inputs. Likely origins of these additional inputs are addressed below.
Figure 11. Receptive fields of PSP inputs to layer 5 pyramidal cells.
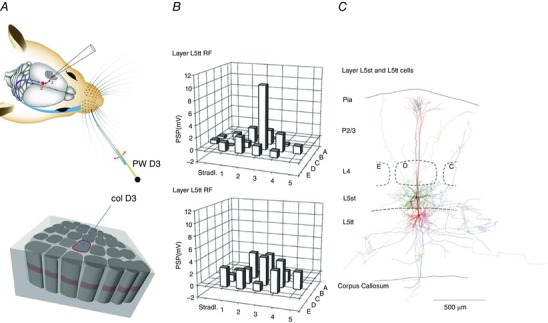
A, whisker system (as described in detail in the legend to Fig. 8). Upper panel, deflecting PW D3 and adjacent SuWs via a piezo actuator and recording from PW column D3 (col D3). B, input PSP‐RF map shown as bar histograms for the two major excitatory cell types, slender‐tufted (L5st) pyramidal cells (located in layer 5A) and L5tt cells (located in layer 5B), as indicated in C. Note the narrow input PSP‐RF of L5st cells (upper panel) compared with the broad and shallow PSP‐RF of L5tt cells (lower panel). Principal whisker is D3. C, reconstruction of L5st (black) and L5tt (red) pyramidal cell bodies and their dendrites. Cells were recorded sequentially and loaded with a histological marker. Three‐dimensional reconstructions are projected on a thalamocortical plane. Cell bodies of both cells were located in a D‐row column. The distance between pia and white matter is indicated on the left. Granular layer is indicated by outlines of a D‐row barrel (dashed lines), apparent after histochemical staining. The depth location of the L5st cell and the L5tt cell recorded from in the infragranular layer is indicated on the left. From Manns et al. (2004), with permission.
A further feature of the inputs to L5tt cells is that PSPs can be evoked by deflection of whiskers on either side of the face (Manns et al. 2004), supporting the view that cells in the lower stratum are sampling inputs of diverse sources of cortical afferents, also originating from outside vS1.
Output physiology of L5tt cells: broad AP‐RFs, reliable response and AP bursts
Broad AP‐RFs and reliable response
The L5tt AP output map is illustrated for a cell located in the D2 column, where the main output is generated by (principal) whisker D2 deflection (Fig. 12 A). The broad AP‐RF (Fig. 12 B, upper panel) indicates that the ensemble of L5tt cells in a PW column represents and communicates touches of most of the vibrissae. This also implies that deflection of a single whisker is represented not only in the PW column, but with almost equal strength in most SuW columns (Fig. 12 B) when quantifying responses by poststimulus time histograms. Thus, the spatial specificity of the representation of a whisker deflection would be blurred, assuming a pure AP rate code for representation of a touch. The calculated total AP output evoked by PW and SuW deflections indicates that the largest spike output of a column is also generated by L5tt cells (Fig. 12 B, lower panel). Spontaneous spiking is also cell‐type specific. Here again, L5tt cells have the highest spontaneous spike rate. Thus, the average spontaneous and evoked spike output of a column is dominated by L5tt cells. The supragranular layers are characterized by sparser spiking, as well as the activity of L5st pyramids, which is sparse and imprecisely locked to stimulus onset. In summary, the ensemble of L5tt cells constitutes a hub in the vS1 network that integrates afferent input signals from both the PW and SuWs and then reliably broadcasts efferent output signals (DeKock et al. 2007).
Figure 12. Output receptive fields of L5tt cells and the total L5tt AP output.
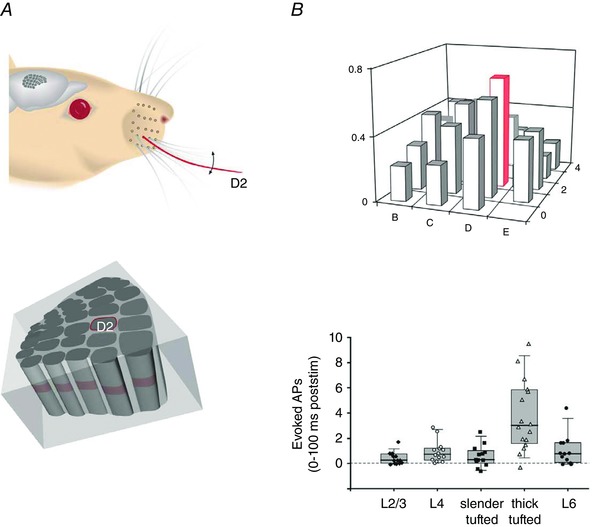
A, whisker system, viewing the right facial whisker pad. Upper panel, deflection of the D2 whisker. Lower panel, tissue block with columns illustrating the location of the D2 column (caudal–rostral view, looking onto the arc of ‘greek’ whisker columns α, β, γ and δ, respectively). The E‐row columns are located on the right side of the tissue block. B, AP‐RF and total spike output. Upper panel, bar histogram of output AP‐RF map of L5tt cells. Responses of arc of greek columns in front to match the pseudo‐3D view onto the arc of greek columns as shown in A (lower panel). The response of the L5tt cell located in the D2 column (red outline) is maximal when the D2 whisker is deflected (red). The RF map is broad and shallow. Ordinate indicates probability of occurrence of evoked AP response. Lower panel, average whisker‐evoked AP output of a column is dominated by L5tt pyramid cells. From DeKock et al. (2007), with permission.
Action potential burst patterns
In vitro, AP bursts are elicited in L5tt cells by coincident inputs to different dendritic zones, and one question arising from this observation is whether this capacity to generate AP bursts has a functional significance for the state of excitation of the vS1 network. Related to this question, we found (Fig. 13 A) that in the anaesthetized animal the spiking of L5tt cells is characterized by the occurrence of AP bursts, during both ongoing and evoked spiking (Fig. 13 B, left panel). Bursting is also cell‐type specific (DeKock & Sakmann, 2008) because the spontaneous and evoked burst activity was observed only in L5tt pyramids and was virtually absent supragranular pyramids (Fig. 13 B, right panel). In the awake animal, AP bursting persisted in L5tt cells and, surprisingly, appeared in supragranular pyramids.
Figure 13. Action potential bursts of L5tt pyramidal cell activity.
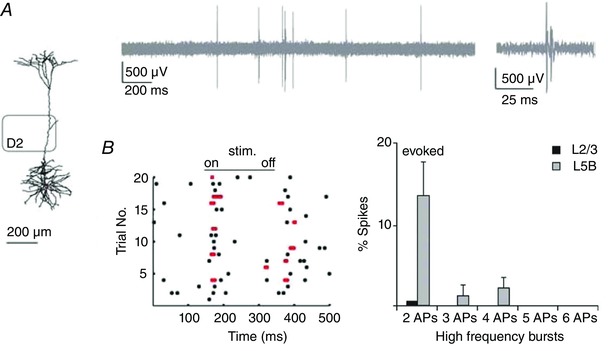
A, reconstruction of L5tt cell in the D2 column and extracellular (loose patch) recording of L5tt cell spiking at low and high time resolution (inset) illustrating the occurrence of high‐frequency AP bursts during spontaneous (ongoing) spiking. B, left graph, raster plots showing the occurrence of spikes during whisker‐evoked responses (stim.). The occurrence of high‐frequency bursts is indicated by pairs of red dots. Right graph, frequency of occurrence of APs that are part of AP bursts recorded in L5tt cells compared with L2/3 pyramid cells. Most supragranular cells were silent. From DeKock & Sakmann (2008), with permission.
Burst coding
The AP spike rate might not be the only relevant parameter in coding the occurrence of a whisker touch. Rather, it has been suggested that communication in the form of short AP bursts could increase information content (Lisman, 1997). Bursting of L5tt cells may be relevant for several of their functions in a network. Bursts modulate coupling to downstream target cells at nerve terminals, the cell's output compartments, as well as modulating input from upstream cells at dendritic spines, the neuron's input compartments’ in the following ways. Firstly, there is short‐term synaptic coupling to target cells via modulation of calcium ion inflow into boutons. Synaptic transmission during AP bursts conveyed to target cells depends on the release properties of the presynaptic terminals; hence, it is determined by the excitation state of the network. For instance, strongly depressing synapses can reduce transmission of high‐frequency components of spike trains, whereas strongly facilitating synapses favour transmission. The occurrence of AP bursts thus enhances differences in the strength of coupling of L5tt cells to different types of target cells. In addition, the magnitude of these differences might be modulated by slow transmitter systems via superpriming (Taschenberger et al. 2016). Secondly, AP bursts modulate distal dendritic input integration via calcium ion electrogenesis. Back‐propagating APs are able to trigger regenerative calcium ion activity in dendritic compartments (Markram et al. 1995; Koester & Sakmann, 1998; Waters & Helmchen, 2004), which induces mechanisms that strongly affect dendritic integration. Back‐propagation leads to local calcium influx through voltage‐gated calcium channels, generating plateau potentials. Single back‐propagating APs are, however, attenuated in distal apical dendrites. Short AP bursts, particularly ≥ 100 Hz, are crucial for regenerative calcium electrogenesis in distal dendritic compartments of L2/3 and L5tt neurons. The regular occurrence of somatic bursts of ≥ 100 Hz in evoked responses makes it likely that in those conditions bursts are back‐propagated far into the distal dendrites, where they cause membrane depolarization and initiate calcium ion electrogenesis (Larkum et al. 1999 a). Increases of calcium fluorescence in distal dendrites are associated with behavioural perception tasks (Xu et al. 2012; Manita et al. 2015) and increases in AP output spiking (Takahashi et al. 2016). Thirdly, AP bursts modulate long‐term synaptic coupling via calcium inflow through glutamate receptor channels of the NMDA receptor subtype. The dendritc membrane potential briefly becomes more positive during back‐propagating AP bursts, allowing calcium ion inflow during coincident glutamatergic PSPs. This, in turn, initiates mechanisms that change the strength of synaptic connections (Makram et al. 1995; Williams & Stuart, 1999).
Structures and functions of vS1 and embedded L5tt cells
Structure–function relationships in the vS1 network became apparent only when the vertical position (layer) and the horizontal position (specific column versus septum) were evaluated in combination with a cell type's dendritic and axonal fields and its RF maps (Brecht &
Sakmann, 2002 b). The following three main functional properties of L5tt cells are based on their position in the vS1 network: (i) input integration from TC afferents and CC projections from within and across columns that generate the broad AP‐RFs; (ii) AP burst generation via inputs to the three dendritic initiation zones that may produce an L5tt cell‐specific code for touch; and (iii) routing of the touch‐specific information in a target‐specific way.
We thus aimed to reconstruct the vS1 network anatomically in order to identify the main anatomical input and output projections of L5tt cells. Two methods were used. Initially, histological sections were made from brains bulk injected previously with orthogradely transported bouton markers in combination with soma–dendrite reconstructions of cells recorded in brain slices to calculate bouton–dendrite overlaps. Later, bouton–dendrite overlaps of 3D‐reconstructed axon and dendrite fields were calculated, following in vivo recording their PSP and AP response maps.
Bulk‐labelling data helped to identify the sites of potential TC innervations for the different cell types, specifically to delineate TC inputs to L5tt cells (Wimmer et al. 2010; Meyer et al. 2010 a, b ). The dendrite and axon reconstructions from in vivo data (Oberlaender et al. 2012 b; Narayanan et al. 2015) then enabled us (i) to classify 10 excitatory cell types, based on their dendritic and axonal morphology and (ii) to identify CC connections that are relevant for the integration of specific inputs and that underlie the broad RFs, as well as inputs that potentially drive coincidence‐dependent AP burst generation. Reconstructions also helped to describe the routing functions of L5tt cells as outlined in the following section.
Reconstruction of anatomical building blocks by axon–dendrite overlaps
In order to establish connection rules for TC and CC pathways, one needs to have detailed morphological reconstructions of synapses between pairs of cells from which recordings were made. Ideally, synapse reconstructions should be made from electron microscopic sections, such as, for example, after paired recordings in brain slices (Markram et al. 1997 a; Silver et al. 2003). At present, however, the time required for segmenting electron microscopic data is still a limiting factor. Obviously, the most accurate way to delineate connections is to reconstruct all connections anatomically at ultrastructural resolution and to reconstruct them also functionally by whole‐cell voltage recordings and imaging the active spines of entire cells in the retina (Briggman et al. 2011; Helmstaedter et al. 2013). In cortex, given the relatively large volumes (tens of cubic millimetres) of the PW‐dendrite column and PW‐axon column described below, this is, at present, a formidable methodological challenge. In addition, spine fluorescence imaging to map active synaptic inputs is still difficult to achieve in deep cortical layers at the necessary time resolution.
Alternatively, in order to delineate the anatomical basis of the functional architectures in cortex volumes of tens of cubic millimetres, such as vS1, we combined the two‐dimensional and 3D reference frames of vS1 with quantified 3D soma distributions and the database of 3D dendrite and axon morphologies. Superpositioning of registered axon/bouton fields with dendrite reconstructions of 10 types of excitatory columnar cells allowed estimations of predicted average connectivity of TC connections and of connections within the vS1 network between any two cell pairs within the column. As a first step to quantify average synaptic connectivity in the vS1 network in silico, we then converted single‐cell reconstructions into density profiles along the vertical axis of a column, taking into account axonal and dendritic architecture, bouton density and spine density. The overlap between boutons and dendrites then allowed us to determine the density of potential synaptic connections between pre‐ and postsynaptic cell types and, recently, also that of cell pairs.
The aim is to generate, as a first step, a statistical model of a wiring diagram of TC and CC connections (Egger et al. 2014). The resulting anatomical connection probability matrix will allow more precise estimates of the most likely used pathways, when anatomical maps are combined with (i) synaptic efficiency data from paired whole‐cell recordings and imaging of spine calcium fluorescence data (Varga et al. 2011; Jia et al. 2014) and (ii) spiking probability data from whole‐cell and extracellular loose‐patch unit recordings (de Kock et al. 2007) or only indirectly, by calcium fluorescence imaging data of active cell somata. Eventually, such data will also allow the construction of functional (i.e. time‐dependent) average connection matrices.
Thalamocortical unit as a building block
The reconstructed TC axon and bouton projection fields in a single column, in combination with reconstructed cortical dendrite fields, is referred to as a ‘dendrite column’ and enabled us to define a ‘TC unit in silico’. This TC unit represents one basic building block of a vS1 in silico and describes the average VPM and posteromedial nucleus of the thalamus (POm) projections and their overlaps with the dendrites of the excitatory cell types of a PW column.
Thalamocortical projections into vS1
Thalamocortical innervations of a PW column were studied with bulk labelling of VPM and POm boutons and reconstructions of single VPM axon arbors, both of which were combined with soma–dendrite reconstructions of excitatory cell types visualized via biocytin filling in vitro or in vivo.
Bulk‐labelled bouton–dendrite overlaps
Initially, we used viral synaptophysin‐enhanced green fluorescent protein expression in thalamic neurons and reconstructions of biocytin‐labelled cortical neurons in TC slices to quantify the number and distribution of boutons supplied by VPM and POm cells that innervate dendrites of excitatory neurons located in layers 2–6 of a column.
A cortical column in rodent vS1 is composed of six cellular layers extending between the pia and the white matter. Layers are designated according to cell body density, and accordingly, the borders between layers are delineated by changes in density (Figs S6A and B and Fig. S7B; right panels from Meyer et al. 2010 a). The layer borders are convenient landmarks for registration of cell reconstructions in a reference frame of vS1.
We found that all excitatory neurons potentially receive substantial TC input (90–580 boutons per neuron) and that pyramidal neurons in L3–L6 receive dual TC input from both VPM and POm (Fig. S7A) that is potentially of equal magnitude for L5tt pyramidal neurons (∼300 boutons each from VPM and POm). We concluded that the substantial TC innervation of all layers of a cortical column (Fig. S7B) constitutes the main anatomical basis for the initial near‐simultaneous subthreshold representation of a sensory stimulus in different layers and cell types, as illustrated schematically in Fig. 9 C.
Single‐cell axon–dendrite overlaps
We further established a detailed cellular anatomy of network components of vS1, in particular the thalamic axonal and cortical dendritic fields and their overlaps. Using 3D reconstructions of dendrites and axons, we identified groups of excitatory cell types (Oberlaender et al. 2012 b; Narayanan et al. 2015) and determined where thalamic axons and cortical dendrites overlap. Figure 14 A shows the bundling of VPM axons that are restricted, in the tangential plane, to roughly the outlines of a histochemically defined standard PW column. The spread of dendrites of a standard PW column is illustrated in Fig. 14 B, indicating that the width of a ‘PW dendrite column’ is only slightly larger than the dimensions of a histochemically delineated column (Oberlaender et al. 2012 b; Narayanan et al. 2015).
Figure 14. Bundling of VPM axons projecting into a PW column defines a ‘thalamocortical (TC) unit’ and an ‘intracortical (IC unit)’ as basic building blocks of vS1.
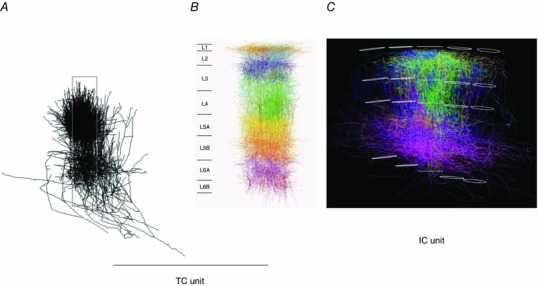
A, projection of 3D VPM axon reconstructions onto sagittal plane. Individually reconstructed axons were registered into a standard 3D reference frame of vS1. The ensemble of reconstructions shows that bundling of VPM axons is restricted approximately to the dimensions of a histochemically delineated average single column. Column borders are outlined by a grey box. B, projection of dendrites of a PW column onto sagittal plane. The dendrite column consists of 3D‐reconstructed somata and their dendrites registered into a standard 3D reference frame of vS1. Dendrites of the different excitatory cell types are shown in different colours. The L5tt cell dendrites are shown in ochre. The width of cytologically delineated cortical layers is given on the left. C, projection of axons of a PW column onto thalamocortical plane. This column, located in the middle, consists of reconstructed and registered axons of 10 excitatory cell types. Their axons are shown in cell‐type‐specific colours, e.g. those of spiny stellate cells are in green. Upper and lower outlines of the PW column and of four SuW columns are shown in white. Pia is on top, white matter on bottom. The borders of the granular layer are indicated by the two white outlines in the middle of the columns. From Oberlaender et al. (2012 b) and Narayanan et al. (2015), with permission.
Intracortical (IC) unit as a building block
A second elementary building block of vS1 comprised the ensemble of intracortical axons of excitatory cells that have their somata located within the borders of the histochemically defined PW column. The volume of this ‘PW axon column’ far exceeds the volume of the approximately cylindrical PW dendrite column (Fig. 14 C). We refer to it as the IC unit of vS1 in silico (Narayanan et al. 2015). Its volume is equivalent to the volume of about nine PW dendrite columns plus that of the septa in between them. The shape of the IC unit's volume is that of an hourglass and shows a layer‐specific anisotropy of transcolumnar projections. The extensive tangential spread of the axons originating in the PW axon column across several surrounding columns raises questions about the definition of a column when defined only by histochemical markers. In a simplified view, the early signals arising from a PW deflection are first processed in the TC unit. Excitation then spreads anisotropically within the IC unit to up to about eight neighbouring columns surrounding the PW column.
Several lines of evidence (such as the axonal projections to subcortical areas and the magnitude of the spike response) suggest that the most significant contribution to a column's evoked output of APs is that emitted by the lower layers L5 and L6, respectively (Fig. 12 B, lower panel). For this reason, the focus in the next sections is on the architectures of the lower layers and in particular, on the ensemble of embedded L5tt pyramidal cells.
Functionally relevant projections to L5tt cells
Making use of TC and IC unit connection matrices, one can specify likely inputs to L5tt cells that might generate broad RFs (Fig. 12 B) and AP bursts (Fig. 13 B) by deconstructing the in silico units to the anatomically densest connections, based on geometrical (overlap) arguments.
Columnar and transcolumnar projections
The basal dendrites of L5tt cells remain, in the tangential plane, mostly within the dimensions of a column. The VPM axons also extend mostly within the lateral borders of a column (Fig. 15 A) and thus partly co‐extend with the basal dendrites. The co‐extension is also obvious in axon and dendrite projections onto the coronal plane (Fig. S8). Thus, the VPM axon inputs are likely to generate the initial narrow PSP‐RF of L5tt cells, which is restricted to the PW input (Fig. 9 of Manns et al. 2004), and the RF only later includes input from all SuWs. The broad RF indicates multicolumnar representation of a deflection extending almost across all columns of vS1 owing to additional inputs from cells with multicolumnar axon spread, such as L6 CC (L6cc) cell axons (Fig. 15 B). Presumably, they form (Egger, 2016) a major anatomical input mediating the generation of multiwhisker RFs or the multicolumnar representation of a PW deflection.
Figure 15. Tangential view of VPM cell and L6 cell axons in deep cortical layers projected onto a tangential column pattern of vS1.
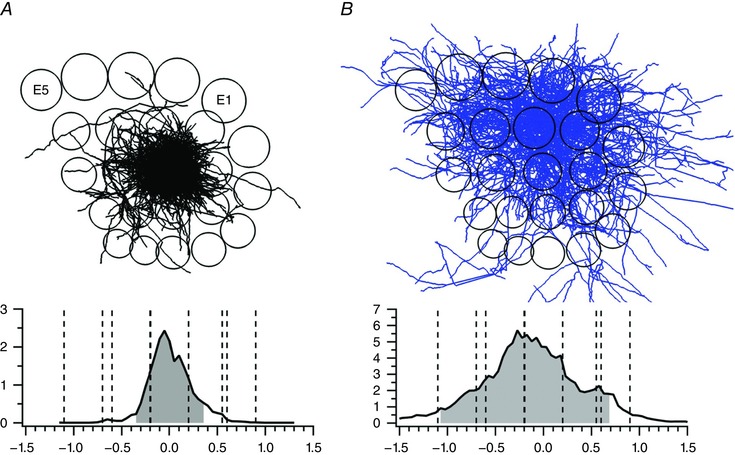
A, VPM axons. Upper panel, projection of axons (black) on tangential plane superimposed onto column pattern (circles) of left vS1. Top, E‐row columns. Columns E1 and E5 are labelled. Lower panel, one‐dimensional (1D) axon‐density profile along a row. The ordinate specifies the axon length density in millimetres per 50 μm bin. The abscissa specifies the distance from the PW centre along the row (in millimetres). Dashed lines indicate the borders of the PW column and adjacent SuW columns, respectively. Grey area denotes 90% axon density. B, L6cc cell axons. Upper panel, projection of axons (blue) on tangential plane superimposed onto column pattern (circles), as in A. Lower panel, 1D axon‐density profile along a row, as in A. Note broader and denser projections into surround columns compared with A. From Narayanan et al. (2015), with permission.
Cells of the supragranular layers (specifically, L3 pyramids) also have broad multicolumnar axon projections to the infragranular layers (Narayanan et al. 2015) that could contribute to the broad L5tt RFs. In the anaesthetized cortex, however, supragranular cells respond unreliably, with sparse APs, and they are imprecisely time locked to deflection onset (Fig. 4 of DeKock et al. 2007). Thus, they are unlikely to contribute substantially to the broad PSP‐RFs and AP‐RFs of L5tt cells. Why this is the case is not obvious, but it may reflect the activity of inhibitory neurons abundant in these layers.
Layer‐specific projections
The observation that whisker‐evoked responses of L5tt cells are characterized by AP bursts may indicate that these are the result of coincident inputs to two or more dendritic zones along the vertical axis of the column. We therefore delineated possible inputs to the three different dendritic zones for AP burst initiation (Fig. 5 A and B). We restricted ourselves to TC and CC inputs and quantified the axon–dendrite overlaps by vertical axon‐density profiles of TC and CC projections.
Thalamocortical axons
All three dendritic zones of L5tt pyramids appear to be targets of the two TC pathways that connect a cortical column to the outside sensory world. One originates from the lemniscal VPM and the other from the paralemniscal nucleus, POm. Dense bouton–dendrite overlaps are obvious when axonal projections from the thalamus are overlaid with dendrites of registered L5tt cells using the columnar layer borders as reference marks.
Axons of VPM cells
These primarily target cortical layer 4. There was a long‐standing dogma that VPM input to layer 4 had the strongest influence on L5tt neurons via intracolumnar L4‐to‐L5tt projections, but it turns out that a significant number of VPM axon projections target cells located in infragranular layers 5 and 6, directly overlapping with their dendrites (Fig. 16 A–C and Fig. S8). Here, the VPM axons precisely overlap with the L5tt basal dendrites (Fig. 16 C, blue and red lines), which we quantified by VPM bulk labelling of boutons (Meyer et al. 2010 a, b ) and by superposition of 3D axon reconstructions of individual VPM and L5tt neurons (Oberlaender et al. 2012 b). The monosynaptic functional connectivity between VPM and L5tt was demonstrated by dual whole‐cell recordings in vivo (Constantinople & Bruno, 2013). Of particular interest are the L5tt pyramid cells with proximal apical oblique dendrites extending in L4 (Fig. 16 B, violet line). This dendritic zone is functionally important because a comparison of axon and dendrite density profiles on the one hand (Fig. 16 D) and functional zones of L5tt pyramids on the other (Fig. 5 A, compartment B) suggests that the input to the L4 domain dendrites markedly increases the AP burst output (Fig. 5 B).
Figure 16. Thalamocortical innervation patterns of L5tt cell dendrites by VPM and POm axons.
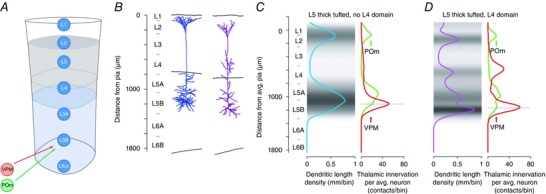
A, schematic drawing of the layers of a PW column and thalamic inputs from VPM (red) and POm (green) to L5B. B, examples of dendrite geometry of two subtypes of L5tt cells, defined by cluster analysis of dendrite geometry. The difference between the major fraction (blue, left) and a smaller fraction (violet, right) of L5tt cells is the greater length of the oblique apical dendrites in the L4 domain of the cell type shown on the right. C and D, overlay of L5tt dendrite density (blue and violet lines) and calculated thalamic bouton density profiles (red and green lines) for the two subtypes of L5tt cells, suggesting that L5tt pyramids are differentially innervated by VPM and POm axons. Only POm boutons are likely to innervate apical tuft dendrites. D shows that the L5tt subtype with oblique dendrites in the L4 domain (violet curve) is likely to be innervated dually by VPM projections at its basal and apical oblique dendrites. From Meyer et al. 2010 b, with permission.
Axons of POm cells
In a network model of vS1 (Oberlaender et al. 2012 a), also included are POm axons–boutons, which target layers 1/2 and 5A, resulting in overlap between POm axons and L5tt apical and oblique dendrites (Fig. 16 C, blue and green lines). Monosynaptic connectivity between POm and L5tt cells was shown functionally by whole‐cell recordings from L5tt cells during optogenetic activation of POm projections (Mease et al. 2016 a).
Axons of L6cc cells
We found that L6cc neurons have elaborate axonal projections, which overlap extensively with L5tt (basal) dendrites in both PW and SuW columns (Fig. 17, left panel). Based on the axodendritic overlap between L6cc and L5tt neurons, we hypothesize that these cell types, both in the PW column and in the SuW columns, form direct synaptic connections, albeit diffusely organized, mostly on basal dendrites across several columns. The overlap is quantified by one‐dimensional (1D) density profiles (Fig. 18 A–D) indicating a peak of potential innervation density in the basal dendritic zone.
Figure 17. Corticocortical axon overlaps with L5tt cell dendrites.
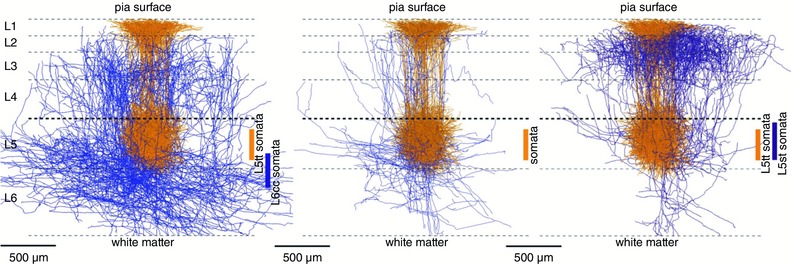
From left to right are shown the overlays of 3D reconstructions of L6cc axons (left panel), L5tt cell axons (middle) and L5st cell axons (right, all in blue) with the L5tt dendrites (ochre) of a PW column. There is preferential and multicolumnar overlap of L6 cortico‐cortical cell axons with basal L5tt dendrites and L4 domain dendrites (left). There is preferential and multicolumnar overlap of L5st axons with apical tuft L5tt cell dendrites (right). There is relatively sparse overlap of L5tt axons and dendrites (middle). From Narayanan et al. (2015), with permission.
Figure 18. Quantification of corticocortical (CC) axon overlaps with L5tt cell dendrites.
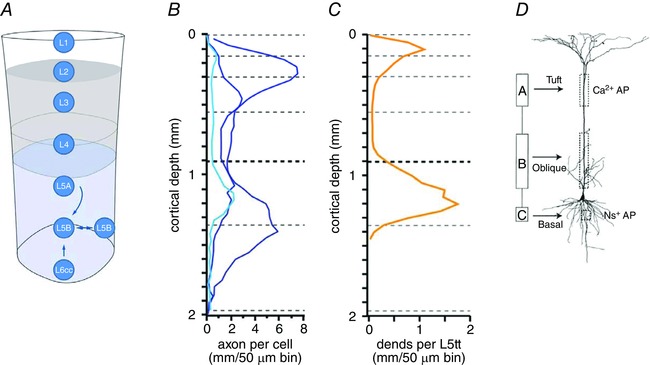
A, schematic drawing of PW‐column layers and cortical input to L5tt cells from infragranular layers L6, L5B and L5A, respectively. B and C, 1D vertical axon‐density profiles of cell‐type‐specific CC projections from L6cc (dark blue), L5tt (light blue) and L5st (dark blue) cell ensembles are shown in B, and the 1D vertical L5tt dendrite density profile (ochre) is shown in C. The L6cc axon density peaks in the infragranular layer, whereas the L5st axon density peaks in supragranular layers. D, three AP initiation zones of L5tt cell dendrites (compartments A, B and C as depicted in Fig. 5 A), for comparison between anatomical axon–dendrite overlay profiles and the three functional input compartments that mediate, via AP burst signalling, the occurrence of multilayer coincident input. From Larkum et al. (2001) and Narayanan et al. (2015), with permission.
Axons of L5st cells, L5tt cells and L3 pyramidal cells
A second example of potentially dense CC input to a different zone of L5tt apical dendrites is the extensive and across‐column distributed axon projection of L5st cells (Fig. 17, right panel). This overlap in the supragranular layers, as quantified in Fig. 18 B, suggests that L5st cells directly innervate L5tt cells mostly at the level of the apical (tuft) dendrites.
In contrast, the axonal projection between L5tt cell axons and L5tt dendrites is sparser and preferentially targets basal dendrites (Fig. 17, middle panel and Fig. 18 B), as also inferred previously from in vitro work (Markram et al. 1997 a). Finally L3 pyramidal cell axons overlay L5tt cell dendrites densely.
Anatomical pathways mediating broad AP‐RFs and AP burst coding of L5tt cells
The L5tt pyramidal neurons have three subcellular TC innervation domains that match the three dendritic compartments (A, B and C), including an L5tt cell subtype that has a VPM innervation domain in L4 (Fig. S7B). The 1D bouton and dendrite density profiles shown in Figs 15 A and 16 C and D suggest that the innervation of L5tt pyramidal cells by VPM projections is densest in the basal dendritic zone, whereas innervation by POm projections is densest in the apical tuft zone (Meyer et al. 2010 a). The 1D density profiles for CC axons and L5tt dendrites strongly suggest that the major inputs to L5tt cells are those from the L6cc and L5st cell ensembles and possibly those of L3 cells, to the basal dendritic zone and the apical tuft zone, respectively (Fig. 18 B and C). These input zones correspond to the compartments C and A of L5tt dendritic fields (Figs 5 A and 18 D). In addition, axon projections of cells in the granular cell layer are densest within L4, corresponding to the apical oblique zone of L5tt cells with an L4 dendritic domain.
Combining the data from the TC and the IC units, the anatomical basis of the major properties of L5tt cells, broad RFs and AP bursts, can be explained tentatively as shown schematically in Fig. 19. It summarizes a possible anatomical basis for the broad RFs via integration of inputs from projections across columns and for AP burst generation by coincident input to the three dendritic zones in different layers. The scheme assumes a labelled line from the whisker pad through the barrelettes of the trigeminal nucleus to barreloids of the VPM to a single PW column.
Figure 19. Anatomical pathways that could generate broad RFs and AP burst patterns of L5tt cells.
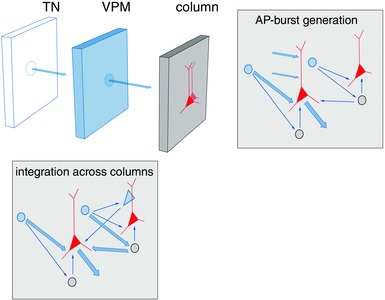
Arrows between modules (square blocks) that represent the trigeminal nucleus (TN), the VPM and the PW column are anatomical connections of an individual PW projection pathway to deep layers (L6 and L5tt pyramids) of a column. Lower panel, integration across columns by layer 5tt cells via direct VPM input to the L5tt cell (red pyramid) in the PW column (foreground) and L6 cell (grey circles) inputs from a neighbouring SuW‐column pathway. For simplicity, the dense transcolumnar projections of L3 pyramidal cells to L5tt dendrites are not shown. Upper right panel, same as in lower panel but in addition the projections of spatially separate inputs to the apical oblique and the tuft dendrite zone are indicated by two arrows. A tentative AP‐burst‐generating input combination is that by VPM, L4 or L5st cell projections or by POm projections or projections from outside vS1 (upper arrow).
Time‐dependent broad RFs
The rapidly expanding RFs of L5tt cells following a whisker deflection are likely to reflect the initial excitation by VPM input followed by CC inputs. The major cell type responsible for generating the broad RFs could be L6cc cells and L3 pyramidal cells. These respond to touch with short latency and reliably, but the density of responding cells per column is low (DeKock et al. 2007). As a result of their extensive multicolumnar axonal arbors, even a few L6cc (and L6 inverted pyramidal cells) cells projecting into L5B (Figs 15 B and 17, left) may act as hub cells, generating the multicolumnar RFs of L5tt cells. Owing to the extensive projections, the L5tt cells of the PW column are also targeted by L6cc axon projections from SuW columns, as illustrated schematically for a PW column and an SuW column (Fig. 19, lower panel). The multicolumnar projections from L3 pyramids could also contribute to broad RF maps, but their spiking activity is relatively sparse.
Action potential burst coding
The three dendritic AP initiation zones are targeted differentially by thalamic and columnar axons. Basal dendrites are targets of VPM axons and of L6cc cell, L5tt cell and L3 pyramid cell axons. The apical tuft dendrites are targeted by POm axons and L5st axons. Thus, there are several possible combinations of thalamic and cortical inputs to these dendritic zones (Fig. 19, upper right panel) which, when active near simultaneously, could evoke bursts of APs. Based on anatomical and physiological data, a combination of VPM and L5st cell inputs is one likely possibility. In the awake rat, the AP activity of L5st cells is phase locked to whisker movement (DeKock & Sakmann, 2009 and Fig. S9). Thus, an L5tt response to a whisker touch by the VPM input to the basal dendrites in combination with the whisker‐movement‐locked L5st input to the apical dendrites (Fig. 19, upper right panel) could generate a coincidence‐dependent increase in AP bursting (Oberlaender et al. 2012 a). The axons of L4 cells also overlap with the basal and more densely with the apical oblique dendrite zone in a subset of L5tt cells. In view of the L4 cell responsiveness to whisker touch, they also could contribute to combinations of coincident inputs that evoke AP bursts, in particular in those L5tt cells with an L4 dendrite domain.
Synaptic inputs to apical dendrites by projections from areas outside vS1 could constitute another contribution to input combinations generating AP bursts. Reports of dendritic calcium fluorescence transients in apical dendrites (Xu et al. 2012; Manita et al. 2015) have been interpreted to indicate inputs from vibrissal motor cortex and AP burst generation. However, AP burst generation is not necessarily coupled to calcium fluorescence transients in dendritic tufts (Helmchen et al. 1999; and Fig. 4 of Hill et al. 2013).
Routing and broadcasting: L5 thick‐tufted cell AP outputs are broadcast and are decoded differentially by target cells
Following the work aimed at understanding the anatomical basis of potential inputs to a column and the functional activation of columns, in particular their L5tt neurons, the next challenge is to understand how cortical output activates its cortical and subcortical target neurons via the L5tt cells CC and CT projections. This means also finding out which response features in the vS1 cortex spiking, specifically that of L5tt cells, are likely to be relevant for target‐cell spiking and eventually initiating a behavioural response.
Cortical targets of L5 thick‐tufted cells
Feedforward and reciprocal monosynaptic connections between L5tt cells in vS1 have been characterized in detail functionally and anatomically by Markram et al. (1997 a). The unitary connections are weak and reliable (Fig. 20 A), with estimates of convergence of between 10 and 100 near‐synchronous unitary L5tt inputs necessary to elicit APs. The connections are characterized by weak frequency‐dependent facilitation (Fig. 20 B). Thus, AP burst activity is one factor to enhance connectivity between L5tt cells in the short term by STP and potentially to strengthen or weaken them by STDP in the long term. Cortical synchronicity, as seen for example during membrane voltage fluctuations (Up/Down states) of ensembles of cortical cells and/or following sensory stimulation, possibly enhances the strength of these connections (Chen et al. 2013).
Figure 20. Connections between L5tt cells within a column.
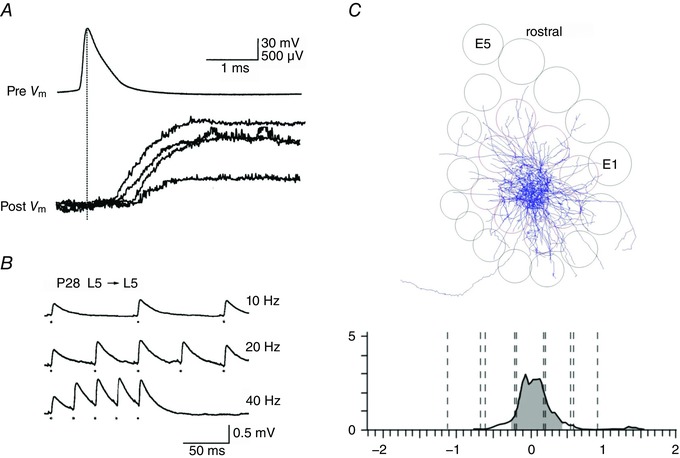
A, L5tt cell connections are characterized by weak, short‐latency synaptic responses. Paired recording in vitro showing presynaptic AP and evoked EPSPs, illustrating the variability of onset latency and amplitude of unitary EPSPs (Markram et al. 1997 a). B, L5tt cell connections are characterized by weak frequency‐dependent facilitation (Reyes & Sakmann, 1999). C, CC projections of L5tt axons viewed tangentially. Upper panel, projection of L5tt axons superimposed on columnar pattern of left vS1 oriented in a caudorostral direction. Columns E1 and E5 are labelled. Lower panel, 1D axon‐density profile along a row. The ordinate specifies the axon length density in millimetres per 50 μm bin. The abscissa specifies the distance from the PW centre along the row in millimetres. Dashed lines indicate the borders of the PW column (middle) and adjacent SuW columns, respectively. Grey area denotes 90% of total axon density. From Narayanan et al. (2015), with permission.
Targets of L5tt pyramidal cells in the cortex are located largely within in the same PW column. The L5tt cell axon spread suggests low‐density projection, extending predominantly within the dimensions of the PW column (Fig. 20 C, upper panel). The tangential axon‐density profile suggests an almost homogeneous axon density within a PW column (Fig. 20 C, lower panel). Layer 5tt cell somata are clustered, and paired recordings within and between clusters did not reveal significant differences in the connection probability (Krieger et al. 2007), suggesting an isotropic connection density between L5tt cells, mostly within a column. Thus, the connections between L5tt cells are likely to be modulated by changes in L5tt spiking in both the short and the long term.
Thalamic targets of L5 thick‐tufted cells
Alex Groh and Rebecca Mease investigated ‘top‐down’ signalling from cortex to secondary thalamus via the cortical layer L5B‐to‐POm pathway in the anaesthetized mouse. The initial questions were related to the synaptic properties of this CT pathway and to its spike transfer function. The properties of the CT pathway were found to contrast strongly with those of the TC pathway (Mease et al. 2016 b, c ), whereas the anatomical somatotopy of projections was comparable.
The results firstly support the view of anatomical and functional subdivisions of the POm. In a larger ‘non‐convergent zone’ of the POm, target cells receive whisker signals predominantly via a few L5tt neurons, greatly facilitating the dissection of the details of CT synaptic inputs to the POm by this pathway (Mease et al. 2016 b).
In vivo recordings of spontaneous large (‘giant’) EPSPs measured in these cells during global cortical Up states showed that EPSPs were locked to spiking of L5tt cells. The transfer of spikes in L5tt cells to PSPs in the thalamus in vivo is robust, as reported for in vitro experiments (Groh et al. 2008), and is mediated by only a few (one to three) active L5B–POm synapses. The synaptic gain (PSP size evoked by a presynaptic AP) of this CT pathway is, however, not constant but instead is controlled by global cortical Up/Down states. Analysis of unitary PSPs in cells with putative single L5tt inputs shows that unitary EPSP amplitudes are large but decrease strongly with the frequency of cortical spiking (Mease et al. 2016 b).
Optogenetic photostimulation of L5tt cells also evokes early large EPSPs, which match L5tt input criteria (Fig. 21 A, upper panel). The PSP amplitude is reduced, depending on the interval between the occurrence a spontaneous‐spiking‐evoked EPSP and the light‐evoked EPSP (Fig. 21 B, lower panel). Thus, in the L5B‐to‐POm pathway in the POm, sub‐ and suprathreshold activity is tightly locked to L5tt cell spiking but with variable synaptic gain. Simulations suggest that AP bursts in L5tt cells overcome tonic synaptic depression and evoke POm spiking (Fig. 21 B). The transfer of whisker‐evoked L5tt spikes (Mease et al. 2016 c) at the L5tt‐to‐POm synapse is thus controlled by the ongoing spontaneous spiking in L5tt cells and, by inference, tonic depression is overcome by the occurrence of AP bursts in L5tt cells or, as suggested by in vitro experiments, by coincident spiking of L5tt cells (Groh et al. 2008).
Figure 21. Corticothalamic pathway from L5tt cells to POm principal cells.
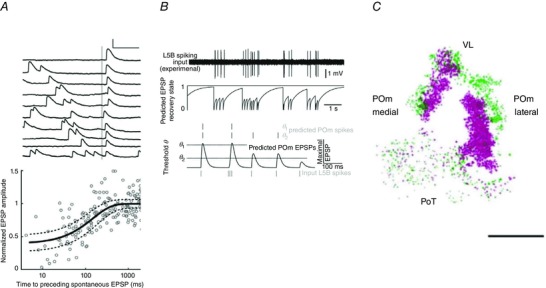
From Mease et al. (2016 b, c ), with permission. A, upper and lower panels, response amplitudes of photostimulation (grey line)‐evoked giant EPSPs depending on the time of occurrence of previous spontaneous giant EPSPs. Calibration bars indicate 10 mV and 100 ms. Graph, quantification of evoked EPSP amplitude depression as a function of time between a spontaneously occurring EPSP and evoked EPSP. Note logarithmic scale of the time axis. B, simulation of the effects of frequency of occurrence of L5tt cell‐dependent EPSPs on AP transmission across the L5tt‐to‐POm synapse. Action potentials of L5tt cells are experimental (top trace). Action potential transmission is occurring when giant EPSPs are evoked by an AP, occurring either in isolation or as a burst of APs (bottom trace). Middle trace shows normalized predicted recovery state of EPSP. From Fig. 7 of Mease et al. (2016 b), with permission. C, corticothalamic projections of L5tt axon target regions visualized by distribution of giant nerve terminals projected onto the horizontal plane. Two cortical columns were labelled by virus deposits encoding two different fluorescent indicators (red and green) tagged to synaptophysin, a marker of nerve terminals. The fluorescence image shows well‐separated projection fields of L5tt axons in two portions of POm, designated as medial and lateral portion respectively. Calibration bar represents 0.5 mm. Ventral lateral nucleus (VL); Posterior triangular nucleus (PoT). From Sumser (2016), with permission.
In summary, cortical AP output, via relatively few strong L5tt projections, efficiently activates its target neurons in the thalamic POm, in contrast to the highly convergent but weak synapses by which the cortex is activated via the thalamic VPM. Activation of L5tt cells by VPM input strictly relies on a high degree of input synchronization. For POm activation by L5tt cells, less synchronous activity is required for transfer of APs, but transfer is dependent on dynamic synaptic gain.
Anatomically, L5tt pyramidal cell axon boutons are located in circumscribed portions of the POm, suggesting precise CT somatotopy (Alloway et al. 2003; Sumser, 2016). Layer 5 thick‐tufted cells of vS1 connect to the POm thalamus via projections that are characterized by giant terminals (Hoogland et al. 1991), but their function in the vS1 network in vivo is not yet well understood. The patterned projection fields of giant L5tt boutons in the POm reflect the anatomical map of cortical columns (Fig. 21 C). However, as the AP‐RF of L5tt cells is broad (Manns et al. 2004; DeKock et al. 2007; but see Ramirez et al. 2014 for maps constructed with responses to repetitive whisker deflections), the AP representation of a whisker deflection would therefore, with respect to the topology, lack columnar and single‐whisker resolution, assuming a pure rate code.
Layer 5 thick‐tufted cells as hubs in the vS1 network
We initially wanted to know how functional properties of L5tt pyramidal cells, which we discovered in brain slices, might contribute to network properties in the functioning brain. For this purpose, one may consider the subcortical afferents to L5tt and the L5tt efferents to subcortical targets as well as their intra‐ and intercolumnar connections as part of a vibrissal cortex (vS1) network consisting of sequentially ordered modules representing the trigeminal nucleus (TN), VPM, the TC and IC units and several premotor nuclei, including POm, as targets (Fig. 22).
Figure 22. Layer 5tt cells act as routers in the vS1 network.
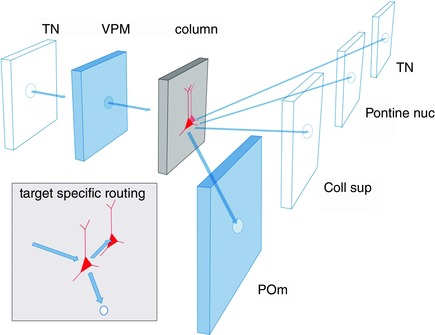
Scheme of two sensory modules [trigeminal nucleus (TN) and thalamic VPM], a transforming module (deep layers of a cortical column) and three premotor modules [thalamus, POm; midbrain, colliculus superior (Coll sup) and brainstem, pontine nuclei] plus a feedback pathway to a sensory module (TN). Symbols in the cartoon (circles and triangles for different cell ensembles) indicate anatomical connections (arrows) of a single PW pathway maintaining a precise topographical projection. Connections between L5tt cells within a PW column are indicated by two pyramids. Inset, L5tt cell projections to (i) adjacent L5tt cells in the PW column and SuW columns and to (ii) POm and other subcortical targets via axon collaterals (Fig. S11). The AP output of L5tt cells is read differently by cortical L5tt cells and thalamic POm cells, owing to target‐cell‐specific transmitter release from L5tt terminals. Differences in the strength of coupling to different target cells are enhanced when projecting L5tt cells generate AP bursts.
Stacks of modules
In a simplified view, each module consists of a sub‐network that receives synaptic input from the upstream module and from local connections and projects to downstream modules. A module is topographically ordered by labelled line input and output projections, which specify an anatomical map of the whisker pad in the module. The superposition of upstream and local inputs computes the AP outputs of the modules. The APs encode the occurrence of a whisker touch by their rate and/or interval pattern and the location of the whisker by the position of the cells in the anatomical map. The downstream module reads this AP output pattern, depending on the properties of synapses between the up‐ and downstream modules.
Sensory input module
The sensory input module connects the cortex to the whisker space. It comprises the VPM neurons, which receive TN afferents with high synaptic gain, and the local inhibitory projections from the reticular zone. The stereotypical AP output is attributable to short‐latency, fast‐rising evoked EPSPs (Brecht & Sakmann, 2002 a) from the trigeminal input and is followed by large, briefly delayed IPSPs elicited by the PW in a subgroup of the single whisker cell types, via reticular zone input (Fig. S10A, upper panels). The output projections of this module to columns are topologically precise. The highly reliable AP output (Fig. 10A, lower panels) consists of one to three spikes on top of a low rate of spontaneous spiking (Brecht & Sakmann, 2002 a).
Transform module
The transform module integrates afferent and local network input, transforms the code for touch by the occurrence of AP bursts and routes touch information to different downstream targets. It consists of neurons located in the lower stratum of a PW column comprising L6 and L5. Tens of topologically precise TC outputs converge, with low synaptic gain, on single L5tt target cells (Fig. S10B, upper panel). Additional local inputs generate a multicolumnar AP‐RF map (Fig. S10B, lower panel), presumably from L6cc cell inputs (Fig. 19, lower panel). The anatomical output projections of L5tt cells are topographically precise in the case of targets such as the POm (Fig. 21 C) and other subcortical targets (Fig. S11). The output AP activity from L5tt cells is broadcast to subcortical targets and would be topographically imprecise as discussed above (Fig. 19, lower panel).
Premotor modules
The premotor modules are downstream targets of L5tt cells and eventually drive whisker‐touch‐dependent behaviours. They consist of the principal cells located in the POm, colliculus superior (the stratum griseum intermediale of colliculus superior or layer 3), pontine nuclei and a trigeminal nucleus. The projections of L5tt cells to the POm principal cells (Mease et al. 2016 b, c ; Sumser, 2016) are sparse, with high synaptic gain that can elicit ‘giant’ EPSPs (Fig. S10C, upper panel; Reichova & Sherman, 2004; Groh et al. 2008; Mease et al. 2016 b). Their amplitude is controlled by the recent history of spiking in the cortex (Fig. 21 A). Simulations suggested that when APs in L5tt cells occur in bursts, this can overcome a reduced synaptic gain (Fig. 21 B; and Fig. 7 of Mease et al. 2016 b). The spike transfer rate from L5tt to POm is low (Fig. S10C, lower panel). The topological precision of the POm projections to downstream targets, for example in motor cortex, is so far not well understood.
Which mechanisms that depend on dendritic excitability are implemented in vivo?
Phenomena depending on dendritic excitability, while well documented in the brain slice preparation, have to be demonstrated also in the functioning brain before they can be considered relevant for network dynamics. The main properties of L5tt cells that are potentially relevant for network behaviour are their active dendritic excitability and the associated capacity to generate AP bursts following coincident inputs to dendritic initiation zones.
Electrical dendritic excitability mediating back‐propagating dendritic APs was reported in vivo by Waters et al. (2003) and Waters & Helmchen (2004), as was the occurrence of AP burst spiking in L5tt cells (DeKock & Sakmann, 2009). Whether this AP bursting indicates that coincident synaptic input has occurred is yet to be shown. This would require precise control of the inputs to the different AP initiation zones of L5tt cells. Recently, active dendritic excitability has been demonstrated in a subset of L5tt cells during perceptual tasks, correlating with an increased AP response to touch (Takahashi et al. 2016). The implications of AP bursting and STP target‐cell specificity of AP transfer are documented in vivo (Mease et al. 2016 b), and STDP has been shown in vivo to drive receptive field plasticity of L2/3 pyramids in the visual cortex (Pawlak et al. 2013).
Discussion
How L5 thick‐tufted cells may affect vS1 network states
What have reconstructions of functional and anatomical architectures in vS1 revealed about the impact of L5tt dendritic excitability on the vS1 network, in which L5tt cells are embedded?
Possible answers to this question are based on the coincidence‐detection capability of L5tt cells that can cause AP burst activity. On the one hand, their AP burst activity in combination with their anatomical position as routers suggest that the occurrence of a touch of a particular whisker is encoded by AP bursts and conveyed differently to different types of target cells. On the other hand, AP burst generation could be at the basis of sensory learning in the cortex via strengthening or weakening connections in an IC unit by STDP. For both functions, viz. coding the occurrence of a touch and sensory learning, a major question remaining is: what are the most frequently occurring combinations of coincident inputs to L5tt cells from the TC and the IC unit, and possibly from additional projections originating outside of vS1?
Encoding touch of specific whiskers
The contribution of L5tt cells in the vS1 network might be described as being essential for transforming the code for the occurrence of a touch and for routing the information that a touch has occurred in a target‐cell‐specific way. The anatomically specific line from VPM through vS1 to POm, as suggested by the respective projection anatomies to vS1 and from vS1, is, however, blurred functionally. Assuming a rate code, because of the broad projection fields of L6cc axons to L5B, the downstream targets of L5tt would receive imprecise information encoded by the AP number and rate about the whisker location, even when only a single whisker is deflected. Therefore, encoding the deflection of a particular whisker should be implemented by a feature of the evoked response other than simply spike rate. How, for example, are subcortical target cells capable of discriminating which whisker or which group of whiskers was deflected from reading the L5tt spike pattern? Or, how are subcortical target cells able to ‘see’ a deflection pattern of the whisker pad?
One possibility would be to assume that the ‘spike rate code’ in the labelled line that characterizes the VPM input to the cortex is transformed in the lower stratum of the IC unit network into a ‘spike interval’ or AP burst code of L5tt cells. The AP patterns of L5tt cells could differ depending on whether AP responses were evoked by PW or by SuW touch. One such difference would be the higher frequency of occurrence of AP bursts when the response is evoked by a touch by the PW. The AP burst response is read more efficiently by the topologically specific target cells of L5tt cells located in the PW column.
One could even hypothesize that a multivibrissal deflection pattern might be precisely represented in the vS1 network if one assumes that upon touch of several whiskers a network state is triggered that is characterized by an increased number of AP bursts in the ensemble of L5tt cells that are located in the respective PW columns. This hypothesis implies that the electrical excitability and the associated coincidence‐detection mechanism of L5tt cell dendrites discovered in vitro are one important basis for sensory‐triggered behaviours.
Sensory learning in cortex
Anatomically, the CC projections of L5tt axons are largely restricted to the IC unit of the PW. The output of L5tt cells, evoked by a PW deflection, excites preferentially and maybe synchronously other cells that are also located in the PW column (Chen et al. 2013). The fact that single‐whisker‐guided behaviours, such as decision‐making in a gap‐crossing task (Hutson & Masterton, 1986; Celikel & Sakmann, 2007), are learned behaviours raises the possibility that they are based on sensory learning in the vS1 network. Assuming that active touch of a whisker evokes a higher percentage of AP bursts in its PW column compared with SuW columns, this difference could drive such sensory learning by the strengthening or weakening via STDP of synapses between coactivated L5tt cells (or additional coactivated pyramidal cell types located in the PW column). One consequence could be that the PSP‐RFs and AP‐RFs of a whisker that is repeatedly and actively touching during a training period become narrower because of the increase in excitability of its PW‐column connections. The touch responses in trained animals could be stronger and/or more reliable than in naive animals. This hypothesis also implies that the electrical excitability and a coincidence detection mechanism of L5tt cell dendrites, discovered in vitro, are one basis for STDP‐dependent sensory learning.
Conclusion
I have tried to summarize a bottom‐up effort, undertaken with my collaborators during two decades, aimed at elucidating the mechanics in a simple cortical network that represents electrically a whisker deflection. Activity in this network can drive a behavioural response, such as gap‐crossing. Conclusions that follow from this effort are as follows.
To understand mechanistically and eventually to simulate in silico the transient flows of signals through the vS1 network, the following factors seem to me essential.
-
(i)
The biophysical properties in vitro must first be extablished for individual groups of cell types and their synaptic connections constituting the network, meaning that a bottom‐up approach must be followed by synthesizing the network from defined elements, that is neurons with electrically active dendrites (Fig. S2).
-
(ii)
The function of the different elements must be described when they are embedded in the in vivo network (Figs. 19 and 22). This requires recordings of synaptic potentials and unit recordings in vivo followed by an in silico anatomical reconstruction of individual pathways at the subcellular level. Such reconstructions are necessary to be able to make educated guesses, that is simulations, on what features of an AP pattern emitted by a projection cell ensemble are ‘read’ by the ensembles of target cells.
-
(iii)
Average 3D anatomical reconstructions of complete (ensemble) pathways must be established by calculating axodendritic overlaps for entire ensembles of projecting and targeted cell types in a quantitative way by establishing a basic ‘digital neuroanatomy’ of the cortex.
The approach we took, in order to discover structure–function relationships that help to unravel simple design principles of cortical networks, was first to determine functions and then reconstruct the underlying morphology assuming that ‘form follows function’, a dictum of the architect Louis Sullivan (Sullivan, 1896) and a Bauhaus design principle, keeping in mind that the Max Planck Institute for Medical Research in Heidelberg, where most of the work described here began, was the first laboratory building designed by a Bauhaus architect. Sullivan also suggested: ‘Whether it be the sweeping eagle in his flight, or the open apple‐blossom, the toiling work‐horse, the blithe swan, the branching oak, the winding stream at its base, the drifting clouds, over all the coursing sun, form ever follows function, and this is the law. Where function does not change, form does not change.’
How this applies to structure–function relationships of the cortex remains to be seen. At present, however, it seems that ‘what we cannot reconstruct in silico and model, we have not understood’.
Additional information
Competing interests
None declared.
Funding
Max Planck Society.
Supporting information
Disclaimer: Supporting information has been peer‐reviewed but not copyedited.
Figure S1. Rodent somatosensory cortex and brain slice preparations.
Figure S2. Subcellular structure elements of L5tt pyramids that are functionally relevant shown in a simple cortical network consisting of two pyramidal cells and one (multipolar) non‐pyramidal cell.
Figure S3. Whisker evoked subthreshold responses in granular layer 4. From Brecht and Sakmann (2002b).
Figure S4. Average postsynaptic potential that a single thalamic AP evokes in a cortical L4 cell. From Bruno & Sakmann (2006).
Figure S5. Response adaptation of whisker evoked PSPs in infragranular and granular layers during repetitive (10Hz) deflections of a principal whisker. From Brecht and Sakmann (2002b) & Manns et al. (2004).
Figure S6. Density of cell bodies along a columns vertical axis. From Meyer et al. (2010b).
Figure S7. Thalamocortical innervation of vS1. From Wimmer et al. (2010) & Meyer et al. (2010a).
Figure S8. Thalamo‐cortical (VPM) axon overlap with L5tt dendrites. From Narayanan et al. (2015).
Figure S9. Unit AP‐activity of L5st and L5tt cells during free whisking in awake animals. From DeKock & Sakmann (2009).
Figure S10. Principal whisker and surround whisker evoked PSP inputs (upper panels) and AP outputs (lower panels) in three (VPM, deep cortical layers of columns and POm) sequentially stacked modules of the vS1 network.
Figure S11. Whisker specific projection fields of fluorescent boutons of bulk labeled L5tt cells located in two separated columns.
Acknowledgements
This work could not have been done without the many postdoctoral fellows with whom I had the privilege to work. They are pursuing their own ideas now, and I am deeply impressed by their scientific achievements. In many instances, their current research began in the laboratories at the Max Planck Insitute for Medical Research in Heidelberg (see Dendrites by Stuart et al. 2008), Max Planck Florida Institute in Jupiter, FL, USA and in Munich, at the Max Planck Insitute for Neurobiology and in Arthur Konnerth's department at the Institute for Neuroscience at the Technical University Munich in Munich. In particular, I would like to thank, related to the work described in the different sections: Greg Stuart, Henry Markram, Matthew Larkum, Alex Reyes, Jackie and Itzhak Schiller, Michael Häusser, Alon Korngren, Thomas Nevian, Verena Wimmer, Michael Brecht, Troy Margrie, Rady Bruno, Damian Wallace, Christiaan de Kock, Hanno Meyer, Marcel Oberländer, Moritz Helmstädter, Dirk Feldmeyer, Thomas Kuner, Patrik Krieger, Alex Groh, Rebecca Mease and Anton Sumser. My thanks are due to Daniel Udvary (CAESAR, Bonn, Germany) for help with Figures. I thank Hans Brenner (University of Basel, Basel, CH) and Erwin Neher (Max Planck Institute for Biophysical Chemistry, Goettingen, Germany) for very helpful comments.
This article is based on my Paton Prize Lecture, which I had the honor to give on 31 July 2016 at ‘Physiology 2016’ in the Convention Centre, Dublin, Ireland. I would like to express my thanks to the colleagues who invited me to review work on cortical circuits that I have done since being awarded the 1991 Nobel Prize in Physiology or Medicine, jointly with Erwin Neher, ‘for discoveries concerning the function of single ion channels in cells’. This lecture is a progress report on many years of collaborative work on cortical circuits with dedicated postdoctoral fellows named at the end of the article.
Edited by: Paul McLoughlin
References
- Agmon A & Connors BW (1991). Thalamocortical responses of mouse somatosensory (barrel) cortex in vitro . Neuroscience 41, 365–379. [DOI] [PubMed] [Google Scholar]
- Alloway KD, Hoffer ZS & Hoover JE (2003). Quantitative comparisons of corticothalamic topography within the ventrobasal complex and the posterior nucleus of the rodent thalamus. Brain Res 968, 45–68. [DOI] [PubMed] [Google Scholar]
- Armstrong‐James M & Fox K (1987). Spatio‐temporal divergence and convergence in the rat “barrel” cortex. J Comp Neurol 263, 265–281. [DOI] [PubMed] [Google Scholar]
- Betz W & Sakmann B (1973). Effect of proteolytic enzymes on function and structure of frog neuromuscular junctions. J Physiol 230, 673–688. [DOI] [PMC free article] [PubMed] [Google Scholar]
- Brecht M, Roth A & Sakmann B (2003). Dynamic receptive fields of reconstructed pyramidal cells in layers 3 and 2 of rat somatosensory barrel cortex. J Physiol 553, 243–265. [DOI] [PMC free article] [PubMed] [Google Scholar]
- Brecht M & Sakmann B (2002. a). Whisker maps of neuronal subclasses of the rat ventral posterior medial thalamus, identified by whole‐cell voltage recording and morphological reconstruction. J Physiol 538, 495–515. [DOI] [PMC free article] [PubMed] [Google Scholar]
- Brecht M & Sakmann B (2002. b). Dynamic representation of whisker deflection by synaptic potentials in spiny stellate and pyramidal cells in the barrels and septa of layer 4 rat somatosensory cortex. J Physiol 543, 49–70. [DOI] [PMC free article] [PubMed] [Google Scholar]
- Briggman KL, Helmstaedter M & Denk W (2011). Wiring specificity in the direction selectivity circuit of the retina. Nature 471, 183–188. [DOI] [PubMed] [Google Scholar]
- Bruno RM & Sakmann B (2006). Cortex is driven by weak but synchronously active thalamocortical synapses. Science 312, 1622–1627. [DOI] [PubMed] [Google Scholar]
- Burnashev N, Villarroel A & Sakmann B (1996). Dimensions and ion selectivity of recombinant AMPA and kainate receptor channels and their dependence on Q/R site residues. J Physiol 496, 165–173. [DOI] [PMC free article] [PubMed] [Google Scholar]
- Celikel T & Sakmann B (2007). Sensory integration across space and in time for decision making in the somatosensory system of rodents. Proc Natl Acad Sci USA 104, 1395–1400. [DOI] [PMC free article] [PubMed] [Google Scholar]
- Chen X, Rochefort NW, Sakmann B & Konnerth A (2013). Reactivation of the same synapses during spontaneous up states and sensory stimuli. Cell Rep 4, 31–39. [DOI] [PubMed] [Google Scholar]
- Constantinople CM & Bruno RM (2013). Deep cortical layers are activated directly by thalamus. Science 340, 1591–1594. [DOI] [PMC free article] [PubMed] [Google Scholar]
- Creutzfeldt OD (1993). Cortex Cerebri. Springer Verlag, Berlin and Heidelberg. [Google Scholar]
- Creutzfeldt OD, Sakmann B & Scheich H (1968). Zusammenhang zwischen Struktur und Funktion der Retina In Kybernetik 1968, ed. Marko H. & Färber G, pp. 239–262. Oldenbourg‐Verlag, München. [Google Scholar]
- DeKock CPJ, Bruno RM, Spors H & Sakmann B (2007). Layer‐ and cell‐type‐specific suprathreshold stimulus representation in rat primary somatosensory cortex. J Physiol 581, 139–154. [DOI] [PMC free article] [PubMed] [Google Scholar]
- DeKock CPJ & Sakmann B (2008). High frequency action potential bursts (≥100 Hz) in L2/3 and L5B thick tufted neurons in anaesthetized and awake rat primary somatosensory cortex. J Physiol 586, 3353–3364. [DOI] [PMC free article] [PubMed] [Google Scholar]
- DeKock CPJ & Sakmann B (2009). Spiking in primary somatosensory cortex during natural whisking behavior in the awake rat. Proc Natl Acad Sci USA 106, 16446–16450. [DOI] [PMC free article] [PubMed] [Google Scholar]
- Egger R (2016). Simulation of sensory‐evoked signal flow in anatomically realistic models of neural networks. PhD thesis, Mathematisch‐Naturwissenschaftliche Fakultät und Medizinische Fakultät, Eberhard‐Karls‐Universität Tübingen, Germany.
- Egger R, Dercksen VJ, Udvary D, Hege HC & Oberlaender M (2014). Generation of dense statistical connectomes from sparse morphological data. Front Neuroanat 8, 129. [DOI] [PMC free article] [PubMed] [Google Scholar]
- Egger R, Narayanan RT, Helmstaedter M, de Kock CP & Oberlaender M (2012). 3D reconstruction and standardization of the rat vibrissal cortex for precise registration of single neuron morphology. PLoS Comput Biol 8, e1002837. [DOI] [PMC free article] [PubMed] [Google Scholar]
- Groh A, de Kock CPJ, Wimmer VC, Sakmann B & Kuner T (2008). Driver or coincidence detector: modal switch of a corticothalamic giant synapse controlled by spontaneous activity and short‐term depression. J Neurosci 28, 9652–9663. [DOI] [PMC free article] [PubMed] [Google Scholar]
- Hamill OP, Marty A, Neher E, Sakmann B & Sigworth F (1981). Improved patch‐clamp techniques for high‐resolution current recording from cells and cell‐free membranes. Pflugers Arch 391, 85–100. [DOI] [PubMed] [Google Scholar]
- Hay E, Hill S, Schürmann F & Segev I (2011). Models of neocortical Layer 5b Pyramidal cells Capturing a Wide Range of Dendritic and Perisomatic Active Properties. PLoS Comput Biol 7, e1002107.doi:10.1371/journal.pcpi 1002107 [DOI] [PMC free article] [PubMed] [Google Scholar]
- Helmchen F, Svoboda K, Denk W & Tank DW (1999). In vivo dendritic calcium dynamics in deep‐layer cortical pyramidal neurons. Nat Neurosci 2, 989–996. [DOI] [PubMed] [Google Scholar]
- Helmstaedter M, Briggman KL, Turaga SC, Jain V, Seung S & Denk W (2013). Connectomic reconstruction of the inner plexiform layer in the mouse retina. Nature 500, 168–174. [DOI] [PubMed] [Google Scholar]
- Helmstaedter M, de Kock CPJ, Feldmeyer D, Bruno RM & Sakmann B (2007). Reconstruction of an average cortical column in silico . Brain Res Rev 55, 193–203. [DOI] [PubMed] [Google Scholar]
- Hill DN, Varga Z, Jia H, Sakmann B & Konnerth A (2013). Multibranch activity in basal and tuft dendrites during firing of layer 5 cortical neurons in vivo. Proc Natl Acad Sci USA 110, 13618–13623. [DOI] [PMC free article] [PubMed] [Google Scholar]
- Hoogland PV, Wouterlood FG, Welker E & Van der Loos H (1991). Ultrastructure of giant and small thalamic terminals of cortical origin: a study of the projections from the barrel cortex in mice using Phaseolus vulgaris leuco‐agglutinin (PHA‐L). Exp Brain Res 87, 159–172. [DOI] [PubMed] [Google Scholar]
- Hutson KA & Masterton RB (1986). The sensory contribution of a single vibrissa's cortical barrel. J Neurophysiol 56, 1196–1223. [DOI] [PubMed] [Google Scholar]
- Jia H, Varga Z, Sakmann B, Konnerth A (2014). Linear integration of spine Ca2+ signals in layer 4 cortical neurons in vivo. Proc Natl Acad Sci USA 25, 9277–9282. [DOI] [PMC free article] [PubMed] [Google Scholar]
- Jiang X, Shan S, Cadwell CR, Berens P, Sinz F, Ecker AS, Saumil P & Tolias AS (2015). Principles of connectivity among morphologically defined cell types in adult neocortex. Science 350, 6264–6267. [DOI] [PMC free article] [PubMed] [Google Scholar]
- Kampa BM, Letzkus JJ & Stuart GJ (2007). Dendritic mechanisms controlling spike‐timing‐dependent synaptic plasticity. Trends Neurosci 30, 456–463. [DOI] [PubMed] [Google Scholar]
- Katz B & Miledi R (1967). A study of synaptic transmission in the absence of nerve impulses. J Physiol 192, 407–436. [DOI] [PMC free article] [PubMed] [Google Scholar]
- Katz B & Miledi R (1972). The statistical nature of the acetylcholine potential and its molecular components. J Physiol 224, 665–699. [DOI] [PMC free article] [PubMed] [Google Scholar]
- Katz PS, Kirk MD & Govind CK (1993). Facilitation and depression at different branches of the same motor axon: evidence for presynaptic differences in release. J Neurosci 13, 3075–3089. [DOI] [PMC free article] [PubMed] [Google Scholar]
- Knott GW, Quairiaux C, Genoud C & Welker E (2002). Formation of dendritic spines with GABAergic synapses induced by whisker stimulation in adult mice. Neuron 34, 265–273. [DOI] [PubMed] [Google Scholar]
- Koester HJ & Sakmann B (1998). Calcium dynamics in single spines during coincident pre‐ and postsynaptic activity depend on relative timing of back‐propagating action potentials and subthreshold excitatory postsynaptic potentials. Proc Natl Acad Sci USA 95, 9596–9601. [DOI] [PMC free article] [PubMed] [Google Scholar]
- Koester HJ & Sakmann B (2000). Calcium dynamics associated with action potentials in single nerve terminals of pyramidal cells in layer 2/3 of the young rat neocortex. J Physiol 529, 625–646. [DOI] [PMC free article] [PubMed] [Google Scholar]
- Krieger P, Kuner T & Sakmann B (2007). Synaptic connections between layer 5B pyramidal neurons in mouse somatosensory cortex are independent of apical dendrite bundling. J Neurosci 27, 11473–11482. [DOI] [PMC free article] [PubMed] [Google Scholar]
- Larkum ME, Kaiser KMM & Sakmann B (1999. a). Calcium electrogenesis in distal apical dendrites of layer 5 pyramidal cells at a critical frequency of back‐propagating action potentials. Proc Natl Acad Sci USA 96, 14600–14604. [DOI] [PMC free article] [PubMed] [Google Scholar]
- Larkum ME, Zhu JJ & Sakmann B (1999. b). A new cellular mechanism for coupling inputs arriving at different cortical layers. Nature 398, 338–341. [DOI] [PubMed] [Google Scholar]
- Larkum ME, Zhu JJ & Sakmann B (2001). Dendritic mechanisms underlying the coupling of the dendritic with the axonal action potential initiation zone of adult rat layer 5 pyramidal neurons. J Physiol 533, 447–466. [DOI] [PMC free article] [PubMed] [Google Scholar]
- Letzkus JB, Kampa BM & Stuart GJ (2006). Learning Rules for spike timing‐dependent plasticity depend on dendritic synapse location. J Neurosci 26, 10420–10429. [DOI] [PMC free article] [PubMed] [Google Scholar]
- Lisman JE (1997). Bursts as a unit of neural information: making unreliable synapses reliable. Trends Neurosci 20, 38–43. [DOI] [PubMed] [Google Scholar]
- Manita S, Suzuki T, Homma C, Matsumoto T, Odagawa M, Yamada K, Ota K, Matsubara C, Inutsuka A, Sato M, Ohkura M, Yamanaka A, Yanagawa Y, Nakai J, Hayashi Y, Larkum ME & Murayama M (2015). A top‐down cortical circuit for accurate sensory perception. Neuron 86, 1304–1316. [DOI] [PubMed] [Google Scholar]
- Manns IA, Sakmann B & Brecht M (2004). Sub‐ and suprathreshold receptive field properties of pyramidal neurones in layers 5A and 5B of rat somatosensory barrel cortex. J Physiol 556, 601–622. [DOI] [PMC free article] [PubMed] [Google Scholar]
- Margrie T, Brecht M & Sakmann B (2002). In vivo, low‐resistance, whole‐cell recordings from neurons in the anaesthesized and awake mammalian brain. Pflugers Arch 444, 491–498. [DOI] [PubMed] [Google Scholar]
- Markram H (2006). The blue brain project. Nat Rev Neurosci 7, 153–160. [DOI] [PubMed] [Google Scholar]
- Markram H, Helm PJ & Sakmann B (1995). Dendritic calcium transients evoked by single back‐progapating action potentials in rat neocortical pyramidal neurons. J Physiol 485, 1–20. [DOI] [PMC free article] [PubMed] [Google Scholar]
- Markram H, Lübke J, Frotscher M, Roth A & Sakmann B (1997. a). Physiology and anatomy of synaptic connections between thick‐tufted pyramidal neurones in the developing rat neocortex. J Physiol 500, 409–440. [DOI] [PMC free article] [PubMed] [Google Scholar]
- Markram H, Lübke J, Frotscher M & Sakmann B (1997. b). Regulation of synaptic efficacy by coincidence of postsynaptic action potentials and EPSPs. Science 275, 213–215. [DOI] [PubMed] [Google Scholar]
- Mease RA, Metz M & Groh A (2016. a). Cortical sensory responses are enhanced by the higher‐order thalamus. Cell Rep 14, 208–215. [DOI] [PubMed] [Google Scholar]
- Mease RA, Sumser A, Sakmann B & Groh A (2016. b). Corticothalamic spike transfer via the L5B–POm pathway in vivo. Cereb Cortex 26, 3461–3475. [DOI] [PMC free article] [PubMed] [Google Scholar]
- Mease RA, Sumser A, Sakmann B & Groh A (2016. c). Cortical dependence of whisker responses in posterior medial thalamus in vivo. Cereb Cortex 26, 3534–3543. [DOI] [PMC free article] [PubMed] [Google Scholar]
- Meinrenken CJ, Borst JGG & Sakmann B (2003). The Hodgkin–Huxley–Katz Prize Lecture. Local routes revisited: the space and time dependence of the Ca2+ signal for phasic transmitter release at the rat calyx of Held. J Physiol 547, 665–689. [DOI] [PMC free article] [PubMed] [Google Scholar]
- Meyer HS, Wimmer VC, Hemberger M, Bruno RM, de Kock CPJ, Frick A, Sakmann B & Helmstaedter M (2010. a). Cell type‐specific thalamic innervation in a column of rat vibrissal cortex. Cereb Cortex 20, 2287–2303. [DOI] [PMC free article] [PubMed] [Google Scholar]
- Meyer HS, Wimmer VC, Oberlaender M, de Kock CPJ, Frick A, Sakmann B & Helmstaedter M (2010. b). Number and laminar distribution of neurons in a thalamocortical projection of rat vibrissal cortex. Cereb Cortex 20, 2277–2286. [DOI] [PMC free article] [PubMed] [Google Scholar]
- Mountcastle VB (1957). Modality and topographic properties of single neurons of cat's somatosensory cortex. J Neurophysiol 20, 403–434. [DOI] [PubMed] [Google Scholar]
- Narayanan R, Egger R, Johnson AS, Mansvelder HD, Sakmann B, de Kock CPJ & Oberlaender M (2015). Beyond columnar organization: cell type‐ and target layer‐specific principles of horizontal axon projection patterns in rat vibrissal cortex. Cereb Cortex 25, 4450–4468. [DOI] [PMC free article] [PubMed] [Google Scholar]
- Neher E (2015). Merits and limitations of vesicle pool models in view of heterogeneous populations of synaptic vesicles. Neuron 87, 1131–1142. [DOI] [PubMed] [Google Scholar]
- Nevian T & Sakmann B (2004). Single spine Ca2+ signals evoked by coincident EPSPs and backpropagating action potentials in spiny stellate cells of layer 4 in the juvenile rat somatosensory barrel cortex. J Neurosci 24, 1689–1699. [DOI] [PMC free article] [PubMed] [Google Scholar]
- Oberlaender M, Boudewijns ZSR, Kleele M, Mansvelder THD, Sakmann B & de Kock CPJ (2012. a). Three‐dimensional axon morphologies of individual layer 5 neurons indicate cell type‐specific intracortical pathways for whisker motion and touch. Proc Natl Acad Sci USA 108, 4188–4193. [DOI] [PMC free article] [PubMed] [Google Scholar]
- Oberlaender M, de Kock CPJ, Bruno RM, Ramirez A, Meyer HS, Dercksen VJ, Helmstaedter M & Sakmann B (2012. b). Cell type‐specific three‐dimensional structure of thalamocortical networks in a barrel column in rat vibrissal cortex. Cereb Cortex 22, 2375–2391. [DOI] [PMC free article] [PubMed] [Google Scholar]
- Pawlak V, Greenberg DS, Sprekeler H, Gerstner W & Kerr J (2013). Changing the responses of cortical neurons from sub‐ to suprathreshold using single spikes in vivo. eLife 2, e00012. [DOI] [PMC free article] [PubMed] [Google Scholar]
- Petersen CCH, Grinvald A & Sakmann B (2003). Spatiotemporal dynamics of sensory responses in layer 2/3 of rat barrel cortex measured in vivo by voltage‐sensitive dye imaging combined with whole‐cell voltage recordings and neuron reconstructions. J Neurosci 23, 1298–1309. [DOI] [PMC free article] [PubMed] [Google Scholar]
- Rakic P (1988). Specification of cerebral cortical areas. Science 241, 170–176. [DOI] [PubMed] [Google Scholar]
- Ramirez A, Pnevmatikakis EA, Merel J, Paninski L, Miller KD & Bruno RM (2014). Spatiotemporal receptive fields of barrel cortex revealed by reverse correlation of synaptic input. Nat Neurosci 17, 866–875. [DOI] [PMC free article] [PubMed] [Google Scholar]
- Reichova I & Sherman SM (2004). Somatosensory corticothalamic projections: distinguishing drivers from modulators. J Neurophysiol 92, 2185–2197. [DOI] [PubMed] [Google Scholar]
- Reyes A, Lujan R, Rozov A, Burnashev N, Somogyi P & Sakmann B (1998). Target‐cell‐specific facilitation and depression in neocortical circuits. Nat Neurosci 1, 279–285. [DOI] [PubMed] [Google Scholar]
- Reyes A & Sakmann B (1999). Developmental switch in the short‐term modification of unitary EPSPs evoked in layer 2/3 and layer 5 pyramidal neurons of rat neocortex. J Neurosci 19, 3827–3835. [DOI] [PMC free article] [PubMed] [Google Scholar]
- Sakmann B (1992). Nobel Lecture: elementary steps in synaptic transmission revealed by currents through single ion channels In Les Prix Nobel 1991, ed. Frängsmyr T, pp. 137–169. Almqvist & Wiksell, Stockholm. [Google Scholar]
- Sakmann B (2006). Patch pipettes are more useful than initially thought: simultaneous pre‐ and postsynaptic recording from mammalian CNS synapses in vitro and in vivo. Pflugers Arch 453, 249–259. [DOI] [PubMed] [Google Scholar]
- Schiller J, Schiller Y, Stuart G & Sakmann B (1997). Calcium action potentials restricted to distal apical dendrites of rat neocortical pyramidal neurons. J Physiol 505, 605–616. [DOI] [PMC free article] [PubMed] [Google Scholar]
- Silver RA, Lübke J, Sakmann B & Feldmeyer D (2003). High‐probability uniquantal transmission at excitatory synapses in barrel cortex. Science 302, 1981–1984. [DOI] [PubMed] [Google Scholar]
- Simons DJ & Carvel GE (1989). Thalamocortical response transformations in the rat vibrissa/barrel system. J Neurophysiol 61, 311–330. [DOI] [PubMed] [Google Scholar]
- Spruston N, Schiller Y, Stuart G & Sakmann B (1997). Activity‐dependent action potential invasion and calcium influx into hippocampal CA1 dendrites. Science 268, 297–300. [DOI] [PubMed] [Google Scholar]
- Stuart GJ, Dodt H & Sakmann B (1993). Patch‐clamp recordings from the soma and dendrites of neurones in brain slices using infrared video microscopy. Pflugers Arch 423, 511–518. [DOI] [PubMed] [Google Scholar]
- Stuart GJ & Sakmann B (1994). Active propagation of somatic action potentials into neocortical pyramidal cell dendrites. Nature 367, 69–72. [DOI] [PubMed] [Google Scholar]
- Stuart G, Schiller J & Sakmann B (1997). Action potential initiation and propagation in rat neocortical pyramidal neurons. J Physiol 505, 617–632. [DOI] [PMC free article] [PubMed] [Google Scholar]
- Stuart GJ & Spruston N (2015). Dendritic integration: 60 years of progress. Nat Neurosci 18, 1713–1721. [DOI] [PubMed] [Google Scholar]
- Stuart G, Spruston N & Häusser M (2008). Dendrites, 2nd edition Oxford University Press Inc, New York. [Google Scholar]
- Sullivan LH (1896). The Tall Office Building Artistically Considered. Lippincotts Magazine 57, 403–409. [Google Scholar]
- Sumser A (2016). Structure and dynamics of the corticothalamic driver pathway in the mouse whisker system. PhD thesis, Graduate School of Systemic Neuroscience, Faculty of Biology, LMU Munich, Germany.
- Taschenberger H, Woehler A & Neher E (2016). Superpriming of synaptic vesicles as a common basis for intersynapse variability and modulation of synaptic strength. Proc Natl Acad Sci USA 113, E4548–E4557. [DOI] [PMC free article] [PubMed] [Google Scholar]
- Takahashi N, Oertner T, Hegemann P & Larkum ME (2016). Active cortical dendrites modulate perception. Science 354, 1587–1590. [DOI] [PubMed] [Google Scholar]
- Varga Z, Jia H, Sakmann B & Konnerth A (2011). Dendritic coding of multiple sensory inputs in single cortical neurons in vivo. Proc Natl Acad Sci USA 108, 15420–15425. [DOI] [PMC free article] [PubMed] [Google Scholar]
- Wallace DJ & Sakmann B (2008). Plasticity of representational maps in somatosensory observed by in vivo voltage‐sensitive dye imaging. Cereb Cortex 18, 1361–1373. [DOI] [PubMed] [Google Scholar]
- Waters J & Helmchen F (2004). Boosting of action potential backpropagation by neocortical network activity in vivo . J Neurosci 24, 11127–11136. [DOI] [PMC free article] [PubMed] [Google Scholar]
- Waters J, Larkum ME, Sakmann B & Helmchen F (2003). Supralinear Ca2+ influx into dendritic tufts of layer 2/3 neocortical pyramidal neurons in vitro and in vivo . J Neurosci 23, 8558–8567. [DOI] [PMC free article] [PubMed] [Google Scholar]
- Williams SR & Stuart GJ (1999). Mechanisms and consequences of action potential burst firing in rat neocortical pyramidal neurons. J Physiol 521, 467–482. [DOI] [PMC free article] [PubMed] [Google Scholar]
- Wimmer VC, Bruno R, de Kock CPJ, Kuner T & Sakmann B (2010). Dimensions of a projection column and architecture of VPM and POm axons in rat vibrissal cortex. Cereb Cortex 20, 2265–2276. [DOI] [PMC free article] [PubMed] [Google Scholar]
- Woolsey TA & Van der Loos H (1970). The description of a cortical field composed of discrete cytoarchitectonic units. Brain Res 17, 205–242. [DOI] [PubMed] [Google Scholar]
- Xu NL, Harnett MT, Williams SR, Huber D, O'Connor DH, Svoboda K & Magee JC (2012). Nonlinear dendritic integration of sensory and motor input during an active sensing task. Nature 492, 247–251. [DOI] [PubMed] [Google Scholar]
Associated Data
This section collects any data citations, data availability statements, or supplementary materials included in this article.
Supplementary Materials
Disclaimer: Supporting information has been peer‐reviewed but not copyedited.
Figure S1. Rodent somatosensory cortex and brain slice preparations.
Figure S2. Subcellular structure elements of L5tt pyramids that are functionally relevant shown in a simple cortical network consisting of two pyramidal cells and one (multipolar) non‐pyramidal cell.
Figure S3. Whisker evoked subthreshold responses in granular layer 4. From Brecht and Sakmann (2002b).
Figure S4. Average postsynaptic potential that a single thalamic AP evokes in a cortical L4 cell. From Bruno & Sakmann (2006).
Figure S5. Response adaptation of whisker evoked PSPs in infragranular and granular layers during repetitive (10Hz) deflections of a principal whisker. From Brecht and Sakmann (2002b) & Manns et al. (2004).
Figure S6. Density of cell bodies along a columns vertical axis. From Meyer et al. (2010b).
Figure S7. Thalamocortical innervation of vS1. From Wimmer et al. (2010) & Meyer et al. (2010a).
Figure S8. Thalamo‐cortical (VPM) axon overlap with L5tt dendrites. From Narayanan et al. (2015).
Figure S9. Unit AP‐activity of L5st and L5tt cells during free whisking in awake animals. From DeKock & Sakmann (2009).
Figure S10. Principal whisker and surround whisker evoked PSP inputs (upper panels) and AP outputs (lower panels) in three (VPM, deep cortical layers of columns and POm) sequentially stacked modules of the vS1 network.
Figure S11. Whisker specific projection fields of fluorescent boutons of bulk labeled L5tt cells located in two separated columns.


