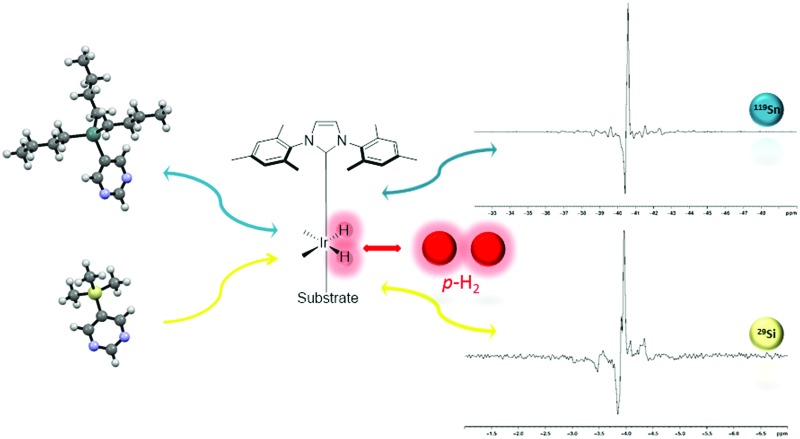
 The hyperpolarisation of the 119Sn and 29Si nuclei in 5-(tributylstannyl)pyrimidine (A
Sn) and 5-(trimethylsilyl)pyrimidine (B
Si) is achieved through their reaction with [IrCl(COD)(IMes)] (1a) or [IrCl(COD)(SIMes)] (1b) and parahydrogen via the SABRE process.
Abstract
The hyperpolarisation of the 119Sn and 29Si nuclei in 5-(tributylstannyl)pyrimidine (A Sn) and 5-(trimethylsilyl)pyrimidine (B Si) is achieved through their reaction with [IrCl(COD)(IMes)] (1a) or [IrCl(COD)(SIMes)] (1b) and parahydrogen via the SABRE process. 1a exhibits superior activity in both cases. The two inequivalent pyrimidine proton environments of A Sn readily yielded signal enhancements totalling ∼2300-fold in its 1H NMR spectrum at a field strength of 9.4 T, with the corresponding 119Sn signal being 700 times stronger than normal. In contrast, B Si produced analogous 1H signal gains of ∼2400-fold and a 29Si signal that could be detected with a signal to noise ratio of 200 in a single scan. These sensitivity improvements allow NMR detection within seconds using micromole amounts of substrate and illustrate the analytical potential of this approach for high-sensitivity screening. Furthermore, after extended reaction times, a series of novel iridium trimers of general form [Ir(H)2Cl(NHC)(μ-pyrimidine-κN:κN′)]3 precipitate from these solutions whose identity was confirmed crystallographically for B Si.
Nuclear magnetic resonance (NMR) spectroscopy is an incredibly powerful technique which yields chemically diagnostic information that is highly useful for structure elucidation.1 It achieves this result despite suffering from inherently low sensitivity as a consequence of the fact that when atoms with a nuclear spin are placed in a magnetic field, their energy levels are only weakly split. While this Zeeman splitting increases with magnetic field strength, for standard NMR spectrometers the population difference, governed by the Boltzmann distribution, is very small. In fact, for protons at 298 K in a field of 9.4 T, the acquired signal is effectively derived from only 1 in every 32 000 of these nuclei, while the corresponding 29Si and 119Sn proportions are just 1 in ∼156 000 and ∼83 000 respectively. Their natural abundance of just 4.7 and 8.6% amplifies this effect even further.
Organotin reagents find wide use in synthetic chemistry in carbon–carbon sigma bond forming reactions that are often mediated by Pd(0) catalysts.2 This approach reflects a major advantage over traditional boronic acid methods due to the mild conditions that can be employed and the reaction's high functional group tolerance. Organosilanes react in a similar way with organohalides or triflates via the Hiyama coupling.3 They also find use as protecting groups, reducing agents and isosteres in drug discovery.4 Hence as these nuclei feature in many significant synthetic procedures their fast NMR detection would enable their analytical use as reaction probes and potentially the development of a role in pharmaceutical analysis. We exploit here the fact that molecular hydrogen exists in quantum states that span two manifolds, triplet or orthohydrogen (o-H2) and singlet or parahydrogen (p-H2), to achieve this aim.
It was originally theorized by Bowers and Weitekamp that the spin order of p-H2 could be transformed into accessible nuclear spin polarisation through its chemical addition to a suitable molecular acceptor.5,6 The resulting non-Boltzmann spin state distribution creates what is now referred to as a hyperpolarised state which, when examined, gives rise to larger than normal NMR signals.7 In this work we use the signal amplification by reversible exchange (SABRE) variant of p-H2 induced polarisation, which achieves catalytic magnetisation transfer into a substrate.8–10 This effect occurs while the substrate is bound to a complex that also contains spin polarisation derived from p-H2 in the form of a pair of hydride ligands and the magnetisation is transferred through the J-coupling network into the nuclei of the ligand. The enhanced spin polarisation of the bound substrate is retained after dissociation and, when interrogated by NMR spectroscopy methods, it yields signals of substantially larger intensity than those which would normally be observed. In the case of pyridine, a 1H-signal enhancement factor of over 5500-fold has been reported at 9.4 T,10 and several reports on the performance of SABRE in biocompatible solvents such as ethanol and water have since been published.11,12 While a significant amount of attention has been dedicated to 1H SABRE NMR,13–17 this technique has also been shown to enable the hyperpolarisation of the heteronuclei 13C,13,18–20 15N21–27 or 31P28,29 with the reported 15N signal gains being particularly noteworthy.24
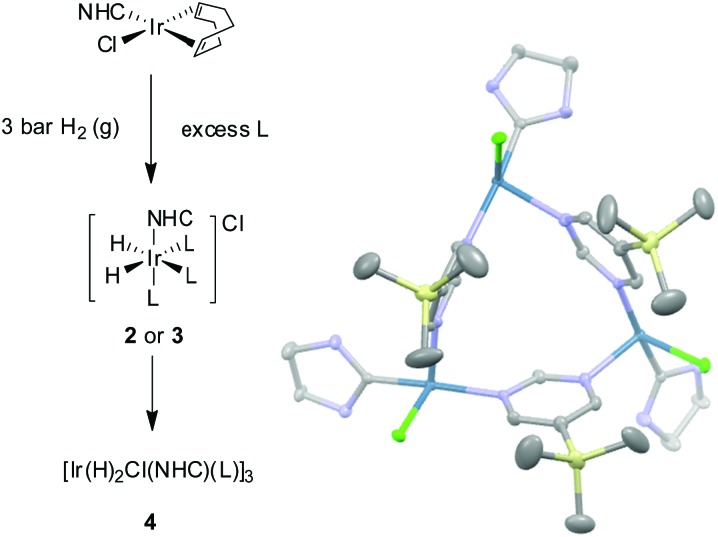
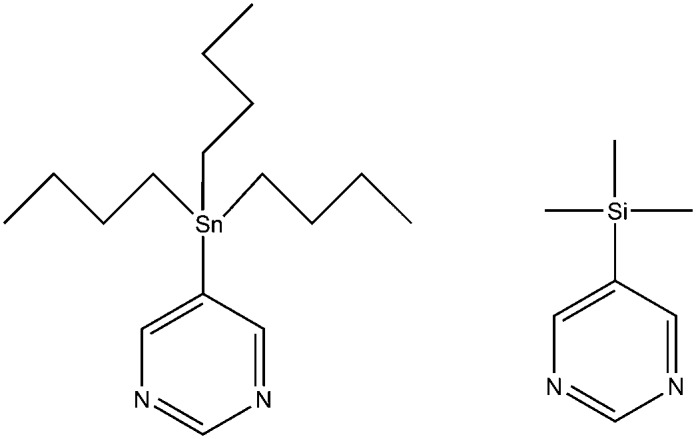
In this report we use SABRE to hyperpolarise the 119Sn and 29Si nuclei of 5-(tributylstannyl)pyrimidine (A Sn) and 5-(trimethylsilyl)pyrimidine (B Si) respectively (Scheme 1). In order to achieve this result they are reacted with H2 and [IrCl(COD)(IMes)] (1a) or [IrCl(COD)(SIMes)] (1b) (where COD is 1,5-cyclooctadiene, IMes is 1,3-bis(2,4,6-trimethylphenyl)imidazol-2-ylidene and SIMes is 1,3-bis(2,4,6-trimethylphenyl)-4,5-dihydroimidazol-2-ylidene). This reaction forms the complexes [Ir(H)2(IMes)(A Sn)3]Cl (2a), [Ir(H)2(SIMes)(A Sn)3]Cl (2b), [Ir(H)2(IMes)(B Si)3]Cl (3a) and [Ir(H)2(SIMes)(B Si)3]Cl (3b) according to the pathway shown in Scheme 2 and they are SABRE active.
Scheme 1. 5-Tributylstannylpyrimidine (A Sn) and 5-trimethylsilylpyrimidine (B Si).
Scheme 2. Reaction of [IrCl(COD)(NHC)] where NHC = IMes (1a) or SIMes (1b) with L (A Sn or B Si) and H2 yields [Ir(H)2(IMes)(A Sn)3]Cl (2a), [Ir(H)2(IMes)(B Si)3]Cl (3a), [Ir(H)2(SIMes)(A Sn)3]Cl (2b) or [Ir(H)2(SIMes)(B)3]Cl (3b). In each case, a trinuclear complex of general formula [Ir(H)2Cl(NHC)(μ-pyrimidine-κN:κN′)]3 (4) eventually precipitates from these samples; the ORTEP for the product formed on reaction of 1b with B Si is shown to the right.
In the case of 2a, the original orange solution turns pale yellow over a 5 minute period at 295 K and a hydride signal at δ H –22.06 for [Ir(H)2(IMes)(A Sn)3]Cl (see ESI,‡ Table S27) appears in the corresponding 1H NMR spectrum. When such a sample is shaken with p-H2, SABRE is visible in the 1H resonances of free A Sn. By examining the role that the iridium catalysts concentration and the ligand excess play on the level of signal enhancement (see ESI‡) we found that a 2.5 mM concentration and 7-fold excess led to an 803 ± 73 fold increase in size of the H-2 signal, and a 1486 ± 156 fold increase for the combined H-4, H-6 signals of A Sn, respectively, after transfer at 70 G.
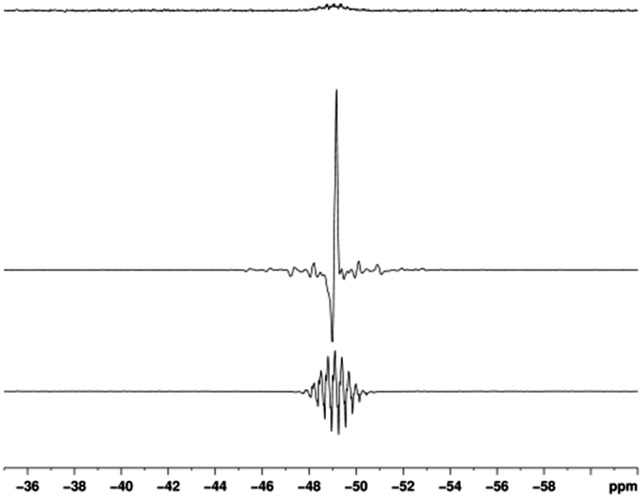
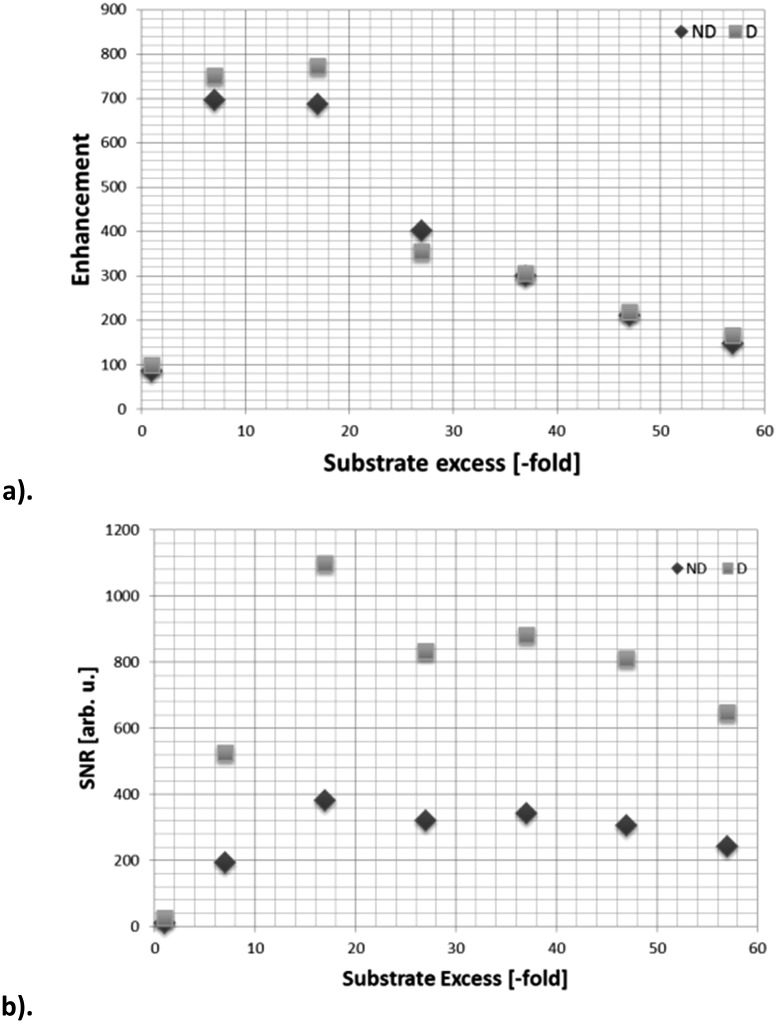
When SABRE transfer was repeated in a magnetic field of 25 G a 119Sn signal could be readily detected (Fig. 1). In this case, the 119Sn response receives its polarisation indirectly via the 1H polarisation of A Sn rather than through a direct route as exemplified recently by Theis et al. for 15N22 and Koptyug for 31P.29 Fig. 2 shows how the resulting 119Sn signal enhancements and SNR values change with free ligand concentration when the concentration of 1a is 5 mM. The 100 mM substrate loading, which corresponds to an excess of A Sn to 2a of 17 : 1, yielded the most intense 119Sn signal, with a SNR of 375 : 1 in the fully coupled spectrum, and 1099 : 1 in the decoupled spectrum. The signal enhancement obtained with this 100 mM loading was 772-fold (see ESI‡) and illustrates a time saving of in excess of 400 hours when set against the corresponding measurement under Boltzmann conditions.
Fig. 1. 119Sn spectra of A Sn. Thermal trace acquired in Boltzmann equilibrium conditions using 3096 scans (top), hyperpolarised spectra acquired with (middle) and without butyl proton decoupling (bottom).
Fig. 2. 119Sn NMR data for the hyperpolarization of 5-(tributylstannyl)pyrimidine (2) in methanol-d 4 through SABRE by 2a; (a) signal enhancement as a function of ligand excess, relative to a 5 mM concentration of catalyst, (b) SNR as a function of ligand excess for the 5 mM loading. Data have been acquired with (D) and without (ND) butyl proton decoupling.
While the SIMes derived catalyst 1b system forms the analogous SABRE active complex 2b upon reaction with A
Sn it yields consistently lower enhancements than those seen with 2a at 348 ± 47 and 301 ± 48 fold in the corresponding fully coupled and decoupled 119Sn NMR spectra. In order to rationalise this behaviour, the rates of H2 elimination from 2a and 2b were determined by exchange spectroscopy (EXSY) in methanol-d
4 solution. At 295 K, H2 loss from 2a proceeds at a rate of 0.56 s–1 whilst the analogous value for 2b is 2.29 s–1. Furthermore, for 2a, ΔH
‡ = 99.5 ± 3.4 kJ mol–1 and ΔS
‡ = 93.2 ± 11.6 J K–1 mol–1 while for 2b, ΔH
‡ = 82.9 ± 2.9 kJ mol–1 and ΔS
‡ = 48.9 ± 10.1 J K–1 mol–1. These result in 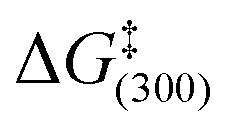 values of 71.5 ± 0.1 kJ mol–1 and 68.3 ± 0.2 kJ mol–1 respectively for these transformations and confirm that 2b undergoes more rapid ligand loss than 2a, which for this substrate is detrimental to SABRE activity. It should be noted that these exchange rates are far lower than those that are optimal for transfer to pyridine10,30,31 which suggests the associated scalar coupling to a hydride ligand in 2 must be smaller in size.32
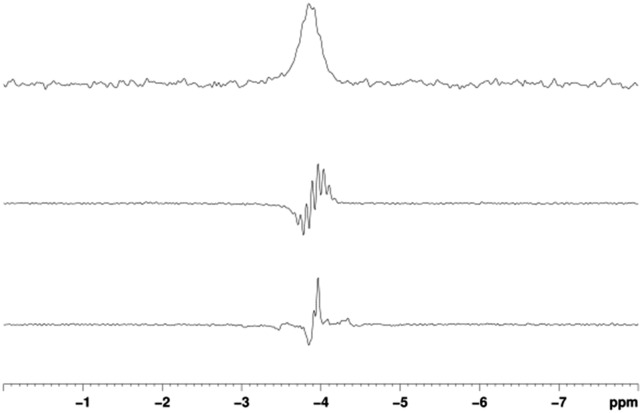
When the corresponding reaction between [IrCI(COD)(IMes)] (1a), 5-(trimethylsilyl)pyrimidine (B Si) and H2 in methanol-d 4 is examined, the formation of 3a is revealed. This complex yields a hydride signal at δ H –22.44, which is almost identical in chemical shift to that of 2a. A series of SABRE experiments were then performed which showed that the resulting 1H NMR signals of free B Si were also strongly enhanced. When 1a was used, transfer at 70 G ultimately yielded –761 ± 41 and –1524 ± 79 fold gains for the H-2 and the combined H-4, H-6 signals respectively. The corresponding values with 1b were –450 ± 41 and –897 ± 82. Additionally, transfer to 29Si was observed and a non-decoupled SNR of 200 was obtained for a single shot measurement at a 25 mM concentration of substrate (Fig. 3).
Fig. 3. 29Si spectra of a solution containing B Si. Thermal trace (top) acquired using 128 averages, hyperpolarised trace acquired using 1 average with (middle) and without (bottom) methyl protons decoupling.
The rates of H2 elimination from 3a and 3b were determined at 295 K and found to proceed at rates of 1.44 s–1 and 5.11 s–1 respectively. The corresponding activation parameters are ΔH
‡ = 104.7 ± 10.3 kJ mol–1 and ΔS
‡ = 119.9 ± 36.2 J K–1 mol–1 and ΔH
‡ = 90.4 ± 6.0 kJ mol–1 and ΔS
‡ = 82.3 ± 21.8 J K–1 mol–1 respectively. These result in 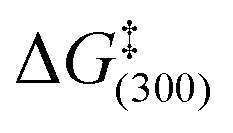 values of 68.7 ± 0.1 kJ mol–1 and 65.7 ± 0.1 kJ mol–1 respectively and demonstrate again that the SIMes form undergoes more rapid ligand loss but this is detrimental to SABRE activity.
Interestingly, when these samples are left at 298 K the slow precipitation of a bright yellow powder is observed. X-ray diffraction studies on the analogous product formed with B Si confirmed its identify as the iridium trimer 4 of general formula [Ir(H)2(Cl)(NHC)(μ-pyrimidine-κN:κN′)]3 (see ESI,‡ Sections 2.7 and 2.8). The formation of a related trinuclear iridium complex has been reported,33 alongside a series of related systems which feature bridging hydride ligands.34,35
In this paper we have described how the addition of H2 and the N-heterocycles 5-(tributylstannyl)pyrimidine (A Sn) and 5-(trimethylsilyl)pyrimidine (B Si) to [IrCl(COD)(IMes)] (1a) and [IrCl(COD)(SIMes)] (1b) result in the formation of a series of cationic dihydride complexes of the type [Ir(H)2(NHC)(L)3]Cl where L is A Sn of B Si. These complexes prove to be able to catalyse the transfer of polarisation from parahydrogen into their NMR active groups thereby making them readily detectable. For example, the 1H NMR signal for the H-2 resonance of A Sn shows an 827-fold intensity improvement when compared to that normally attained in Boltzmann equilibrium conditions. In the case of B Sn the corresponding value is 761-fold.
When polarisation transfer to 119Sn is observed, a 700-fold intensity gain in its signal strength was measured which would require over 400 hours of measurement for comparable results. In contrast, the 29Si resonance of B Si provided a 200-fold SNR gain in the analogous experiment. We believe such remarkable improvements could be exploited in the future for reaction monitoring in synthetic procedures such as those outline in the introduction.
The values of 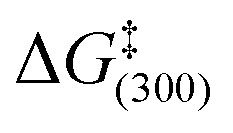 for H2 loss in these complexes follow the order 2a > 3a > 2b > 3b and confirm that the remote silicon and tin centres of these pyrimidine substrates play a role in determining the ligand exchange rates even though they are isolated from the metal centre by four bonds. Furthermore, SABRE is a catalytic process, in which the product and starting materials chemical identity remains the same, but their magnetic properties are changed. Hence both catalyst deactivation and reaction selectivity reflect important points when analysing such processes, just like they would in a normal reaction. Here, the slow formation of a series of novel trimeric complexes with general formula [Ir(H)2(Cl)(NHC)(μ-pyrimidine-κN:κN′)]3 that have been characterised by X-ray crystallography for B
Si results in the need to employ fresh samples during the SABRE analysis. Hence while high levels of signal gain are readily achieved through SABRE, there is a need to refresh the catalyst periodically if activity is to be maintained over several hours.
The EPSRC (grant no. EP/G009546/1) and the Wellcome Trust (092506 and 098335) are thanked for funding. We also acknowledge Bruker Biospin for support and help from James Hayes.
Footnotes
†Data created during this research are available by request from the University of York Data Catalogue http://dx.doi.org/10.15124/12345.
References
- Aue W. P., Bartholdi E., Ernst R. R. J. Chem. Phys. 1976;64:2229–2246. [Google Scholar]
- Stille J. K. Angew. Chem., Int. Ed. Engl. 1986;25:508–524. [Google Scholar]
- Hatanaka Y., Hiyama T. J. Org. Chem. 1988;53:918–920. [Google Scholar]
- Showell G. A., Mills J. S. Drug Discovery Today. 2003;8:551–556. doi: 10.1016/s1359-6446(03)02726-0. [DOI] [PubMed] [Google Scholar]
- Bowers C. R., Weitekamp D. P. Phys. Rev. Lett. 1986;57:2645–2648. doi: 10.1103/PhysRevLett.57.2645. [DOI] [PubMed] [Google Scholar]
- Bowers C. R., Weitekamp D. P. J. Am. Chem. Soc. 1987;109:5541–5542. [Google Scholar]
- Green R. A., Adams R. W., Duckett S. B., Mewis R. E., Williamson D. C., Green G. G. R. Prog. Nucl. Magn. Reson. Spectrosc. 2012;67:1–48. doi: 10.1016/j.pnmrs.2012.03.001. [DOI] [PubMed] [Google Scholar]
- Adams R. W., Aguilar J. A., Atkinson K. D., Cowley M. J., Elliott P. I. P., Duckett S. B., Green G. G. R., Khazal I. G., López-Serrano J., Williamson D. C. Science. 2009;323:1708–1711. doi: 10.1126/science.1168877. [DOI] [PubMed] [Google Scholar]
- van Weerdenburg B. J. A., Gloggler S., Eshuis N., Engwerda A. H. J., Smits J. M. M., de Gelder R., Appelt S., Wymenga S. S., Tessari M., Feiters M. C., Blumich B., Rutjes F. Chem. Commun. 2013;49:7388–7390. doi: 10.1039/c3cc43423k. [DOI] [PubMed] [Google Scholar]
- Lloyd L. S., Asghar A., Burns M. J., Charlton A., Coombes S., Cowley M. J., Dear G. J., Duckett S. B., Genov G. R., Green G. G. R., Highton L. A. R., Hooper A. J. J., Khan M., Khazal I. G., Lewis R. J., Mewis R. E., Roberts A. D., Ruddlesden A. J. Catal. Sci. Technol. 2014;4:3544–3554. [Google Scholar]
- Spannring P., Reile I., Emondts M., Schleker P. P. M., Hermkens N. K. J., van der Zwaluw N. G. J., van Weerdenburg B. J. A., Tinnemans P., Tessari M., Blümich B., Rutjes F. P. J. T., Feiters M. C. Chem. – Eur. J. 2016;22:9277–9282. doi: 10.1002/chem.201601211. [DOI] [PMC free article] [PubMed] [Google Scholar]
- Truong M. L., Shi F., He P., Yuan B., Plunkett K. N., Coffey A. M., Shchepin R. V., Barskiy D. A., Kovtunov K. V., Koptyug I. V., Waddell K. W., Goodson B. M., Chekmenev E. Y. J. Phys. Chem. B. 2014;118:13882–13889. doi: 10.1021/jp510825b. [DOI] [PMC free article] [PubMed] [Google Scholar]
- Mewis R. E., Atkinson K. D., Cowley M. J., Duckett S. B., Green G. G. R., Green R. A., Highton L. A. R., Kilgour D., Lloyd L. S., Lohman J. A. B., Williamson D. C. Magn. Reson. Chem. 2014;52:358–369. doi: 10.1002/mrc.4073. [DOI] [PMC free article] [PubMed] [Google Scholar]
- Olaru A. M., Roy S. S., Lloyd L. S., Coombes S., Green G. G. R., Duckett S. B. Chem. Commun. 2016;52:7842–7845. doi: 10.1039/c6cc02020h. [DOI] [PMC free article] [PubMed] [Google Scholar]
- Eshuis N., Hermkens N., van Weerdenburg B. J. A., Feiters M. C., Rutjes F. P. J. T., Wijmenga S. S., Tessari M. J. Am. Chem. Soc. 2014;136:2695–2698. doi: 10.1021/ja412994k. [DOI] [PubMed] [Google Scholar]
- Zeng H. F., Xu J. D., Gillen J., McMahon M. T., Artemov D., Tyburn J. M., Lohman J. A. B., Mewis R. E., Atkinson K. D., Green G. G. R., Duckett S. B., van Zijl P. C. M. J. Magn. Reson. 2013;237:73–78. doi: 10.1016/j.jmr.2013.09.012. [DOI] [PMC free article] [PubMed] [Google Scholar]
- Ducker E. B., Kuhn L. T., Munnemann K., Griesinger C. J. Magn. Reson. 2012;214:159–165. doi: 10.1016/j.jmr.2011.11.001. [DOI] [PubMed] [Google Scholar]
- Hövener J.-B., Schwaderlapp N., Borowiak R., Lickert T., Duckett S. B., Mewis R. E., Adams R. W., Burns M. J., Highton L. A. R., Green G. G. R., Olaru A., Hennig J., von Elverfeldt D. Anal. Chem. 2014;86:1767–1774. doi: 10.1021/ac403653q. [DOI] [PMC free article] [PubMed] [Google Scholar]
- Mewis R. E., Green R. A., Cockett M. C. R., Cowley M. J., Duckett S. B., Green G. G. R., John R. O., Rayner P. J., Williamson D. C. J. Phys. Chem. B. 2015;119:1416–1424. doi: 10.1021/jp511492q. [DOI] [PMC free article] [PubMed] [Google Scholar]
- Lloyd L. S., Adams R. W., Bernstein M., Coombes S., Duckett S. B., Green G. G. R., Lewis R. J., Mewis R. E., Sleigh C. J. J. Am. Chem. Soc. 2012;134:12904–12907. doi: 10.1021/ja3051052. [DOI] [PubMed] [Google Scholar]
- Truong M. L., Theis T., Coffey A. M., Shchepin R. V., Waddell K. W., Shi F., Goodson B. M., Warren W. S., Chekmenev E. Y. J. Phys. Chem. C. 2015;119:8786–8797. doi: 10.1021/acs.jpcc.5b01799. [DOI] [PMC free article] [PubMed] [Google Scholar]
- Theis T., Truong M. L., Coffey A. M., Shchepin R. V., Waddell K. W., Shi F., Goodson B. M., Warren W. S., Chekmenev E. Y. J. Am. Chem. Soc. 2015;137:1404–1407. doi: 10.1021/ja512242d. [DOI] [PMC free article] [PubMed] [Google Scholar]
- Logan A. W. J., Theis T., Colell J. F. P., Warren W. S., Malcolmson S. J. Chem. – Eur. J. 2016;22:10777–10781. doi: 10.1002/chem.201602393. [DOI] [PubMed] [Google Scholar]
- Barskiy D. A., Shchepin R. V., Coffey A. M., Theis T., Warren W. S., Goodson B. M., Chekmenev E. Y. J. Am. Chem. Soc. 2016;138:8080–8083. doi: 10.1021/jacs.6b04784. [DOI] [PMC free article] [PubMed] [Google Scholar]
- Shchepin R. V., Barskiy D. A., Mikhaylov D. M., Chekmenev E. Y. Bioconjugate Chem. 2016;27:878–882. doi: 10.1021/acs.bioconjchem.6b00148. [DOI] [PMC free article] [PubMed] [Google Scholar]
- Shchepin R. V., Chekmenev E. Y. J. Labelled Compd. Radiopharm. 2014;57:621–624. doi: 10.1002/jlcr.3220. [DOI] [PMC free article] [PubMed] [Google Scholar]
- Reineri F., Viale A., Ellena S., Alberti D., Boi T., Giovenzana G. B., Gobetto R., Premkumar S. S. D., Aime S. J. Am. Chem. Soc. 2012;134:11146–11152. doi: 10.1021/ja209884h. [DOI] [PubMed] [Google Scholar]
- Burns M. J., Rayner P. J., Green G. G. R., Highton L. A. R., Mewis R. E., Duckett S. B. J. Phys. Chem. B. 2015;119:5020–5027. doi: 10.1021/acs.jpcb.5b00686. [DOI] [PMC free article] [PubMed] [Google Scholar]
- Zhivonitko V. V., Skovpin I. V., Koptyug I. V. Chem. Commun. 2015;51:2506–2509. doi: 10.1039/c4cc08115c. [DOI] [PubMed] [Google Scholar]
- Adams R. W., Duckett S. B., Green R. A., Williamson D. C., Green G. G. R. J. Chem. Phys. 2009;131:194505. doi: 10.1063/1.3254386. [DOI] [PubMed] [Google Scholar]
- Barskiy D. A., Pravdivtsev A. N., Ivanov K. L., Kovtunov K. V., Koptyug I. V. Phys. Chem. Chem. Phys. 2016;18:89–93. doi: 10.1039/c5cp05134g. [DOI] [PubMed] [Google Scholar]
- Eshuis N., Aspers R., van Weerdenburg B. J. A., Feiters M. C., Rutjes F., Wijmenga S. S., Tessari M. J. Magn. Reson. 2016;265:59–66. doi: 10.1016/j.jmr.2016.01.012. [DOI] [PubMed] [Google Scholar]
- Mayer H. A., Kaska W. C. Chem. Ber. 1995;128:95–98. [Google Scholar]
- Albano V., Bellon P., Scatturin V. Chem. Commun. 1967:730–731. [Google Scholar]
- Smidt S. P., Pfaltz A., Martinez-Viviente E., Pregosin P. S., Albinati A. Organometallics. 2003;22:1000–1009. [Google Scholar]
Associated Data
This section collects any data citations, data availability statements, or supplementary materials included in this article.


