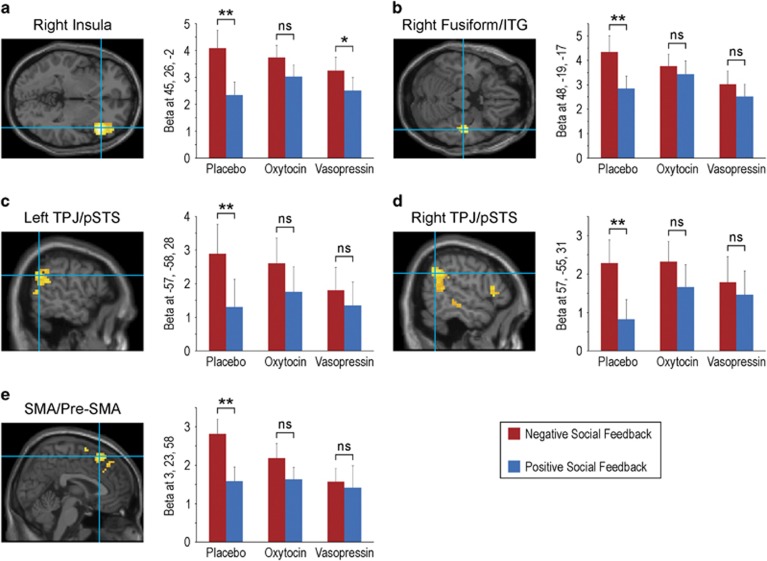
Figure 2.
Significant (p<0.05, corrected) activation foci for negative social feedback>positive social feedback during placebo: (a) right anterior insula, (b) right fusiform/inferior temporal gyrus (ITG), (c) left temporoparietal junction (TPJ), (d) right TPJ, and (e) supplementary motor area (SMA)/pre-SMA. For each of these activations (peak voxel), mean beta estimates (and SEM) for negative social feedback and positive social feedback are plotted separately under placebo, oxytocin and vasopressin administration. **p<0.001; *p=0.006; ns, not significant.

