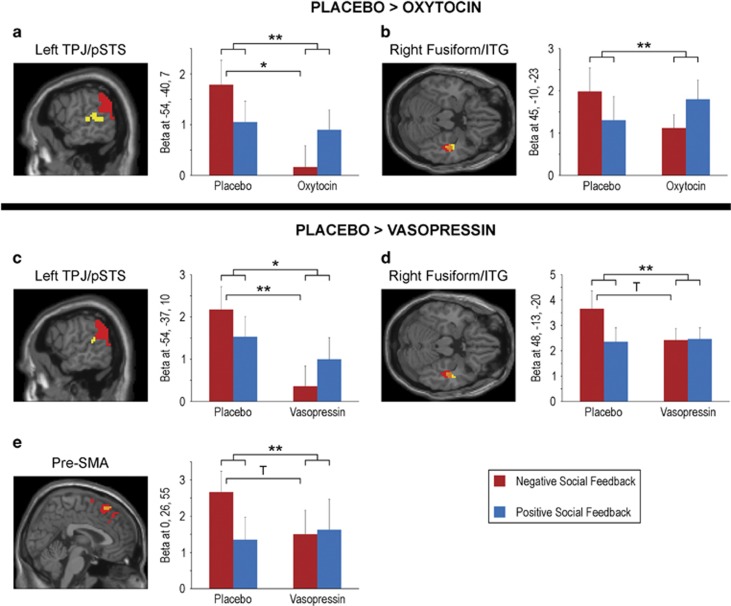
Figure 3.
Activations corresponding to preferential neural responses to negative social feedback (ie, negative>positive social feedback) under placebo in regions that also have an outcome (negative–positive) by drug (placebo–oxytocin or placebo–vasopressin) interaction (p⩽0.001, uncorrected, t>3). The preferential neural response to negative social feedback is greater under placebo than oxytocin in (a) left temporoparietal junction (TPJ)/posterior superior temporal sulcus (pSTS), and (b) right fusiform/inferior temporal gryus (ITG). The preferential neural response to negative social feedback is greater under placebo than vasopressin in (c) left TPJ/pSTS, (d) right fusiform/ITG, and (e) pre-supplementary motor area (pre-SMA). Significant activations under placebo alone are displayed in red, activations for placebo–drug comparisons are displayed in yellow (p<0.005, cluster size⩾25 for illustrative purposes), and where they overlap is displayed in orange. For each peak from the placebo–drug comparison, mean beta estimates (and SEM) for negative social feedback and positive social feedback are plotted separately under placebo and drug. The legend corresponds to the beta graphs. **p⩽0.005; *p⩽0.01; T indicates a trend for significance that does not survive correction for multiple comparisons (p=0.016–0.05).

