Abstract
Protein post-translational modification (PTM) is an essential cellular regulatory mechanism and disruptions in PTM have been implicated in disease. PTMs are an active area of study in many fields, leading to a wealth of PTM information in the scientific literature. There is a need for user-friendly bioinformatics resources that capture PTM information from the literature and support analyses of PTMs and their functional consequences. This chapter describes the use of iPTMnet (http://research.bioinformatics.udel.edu/iptmnet/), a resource that integrates PTM information from text mining, curated databases, and ontologies and provides visualization tools for exploring PTM networks, PTM crosstalk, and PTM conservation across species. We present several PTM-related queries and demonstrate how they can be addressed using iPTMnet.
Keywords: post-translational modification, phosphorylation, acetylation, text-mining, protein-protein interaction, Protein Ontology, database, PTM cross-talk
1. Introduction
Post-translation modification (PTM) is a major mechanism by which the cell regulates the biological activity of proteins. PTMs, such as phosphorylation, acetylation, and ubiquitination have a broad range of effects, altering protein stability, enzymatic activity, sub-cellular localization, and interactions. Coordination of multiple PTMs at the same site or at multiple sites on a protein affords another layer of complexity, giving the cell exquisite control over protein function [1]. Abnormalities in PTM have been implicated in many diseases, and modulation of PTM is being actively pursued as a therapeutic strategy. A growing number of kinase inhibitors is being used to treat cancer as well as inflammatory and autoimmune diseases [2]. Histone deacetylase inhibitors are also showing promise in cancer treatment [3].
Because of the extent and importance of PTM events in the cell, researchers from many fields are often confronted by PTM-related questions, from simple questions such as: “What are the substrates of this kinase?” and “Which sites are acetylated in this protein?” to more complex queries such as: “How does this PTM interact with other PTMs in the same protein?”, “What are the functional consequences of this PTM events?” and “Which of these PTM events that have been observed in mouse are likely to also occur in humans?” The ultimate resource for answering these questions is the scientific literature; however, it can be overwhelming. A PubMed search for “phosphorylation” returns >250,000 articles; a search for “acetylation” returns nearly 30,000. Several efforts are underway to summarize this information in bioinformatics databases for easy consumption by biologists. Resources such as UniProtKB [4], PhosphoSitePlus [5] and Phospho.ELM [6] provide high quality PTM information manually curated from the literature. However, manual curation is time and labor-intensive, making it nearly impossible to keep up with the vast body of PTM literature. Use of automated text mining tools to capture PTM information from the literature is a promising approach to supplement the work of human curators.
We have developed iPTMnet (http://research.bioinformatics.udel.edu/iptmnet/), a user-friendly web resource that integrates text-mined information with information from curated databases to provide a detailed, current picture of PTM events. iPTMnet includes automated results from two text mining tools—RLIMS-P, which identifies mentions of kinases, substrates, and phosphorylation sites in text [7], and eFIP, which identifies mentions of phosphorylation-dependent protein-protein interactions (PPIs) [8]. The system incorporates PTM databases that specialize in different organisms, including mammals, plants, and yeast (see Note 1). With an emphasis on PTM relationships, including enzyme-substrate relationships and PTM-dependent PPIs, iPTMnet offers a user-customizable PTM network view. Furthermore, iPTMnet uses the Protein Ontology (PRO, see Note 2) [9] to represent combinatorial PTM forms (proteoforms, see Note 3) and orthologous relationships between PTM proteins in different organisms to support studies of PTM conservation across species and PTM crosstalk. Here we describe the use of iPTMnet to answer a variety of PTM-related biological questions (see Note 4).
2. Methods
2.1 Browsing in iPTMnet. Example: overview of plant kinase information
The iPTMnet Browse feature provides a general overview of PTMs and/or PTM enzymes in organisms of interest. To explore information about plant kinases:
Go to the iPTMnet home page at http://research.bioinformatics.udel.edu/iptmnet/ and click “Browse” (Figure 1).
The panel on the left side of the page allows you to select individual organisms (e.g. Maize) or groups of organisms (e.g. Plant). For this example, select “Plant.” Output can be further filtered using the two menus—PTM type and Has Role—located directly below the orange “Browse” button. To display kinases, select “Phosphorylation” from the PTM type menu and “Enzyme” from the Has Role menu. Click “Browse” (Figure 1).
Results are displayed in a table with nine columns (Figure 2). The first column shows the iPTMnet identifier. Clicking here will take you to the iPTMnet entry page for the protein (see Section 2.2). Clickable links to the iProClass, UniProt, and PRO pages for the protein are also provided. The next columns display the protein name, gene names, and organism. Reviewing the organism column reveals that most of the results (34/36) are proteins from Arabidopsis. The remaining two are from maize. The Substrate Role column displays a green check mark if the protein has known PTM sites and lists the number of known PTM enzymes, if any. Thirty-one out of the 36 plant kinases undergo PTM themselves (i.e., they have at least one PTM site); however, a PTM enzyme is known in only 17 of those cases. The Enzyme Role column displays a green check mark if the protein is a PTM enzyme, followed by the number of known substrates. Because we filtered the list for proteins with kinase activity, every result has a green check mark in this column. The final three columns display the number of PTM-dependent PPIs automatically identified by eFIP, the number of PTM sites, and the number of isoforms for the protein. The numbers in the last five columns of the table are clickable links to the relevant sections of the protein entry page.
You can select results to download or display in a network view (see below) by checking the box to the left of the iPTMnet identifier (Figure 2).
Figure 1.
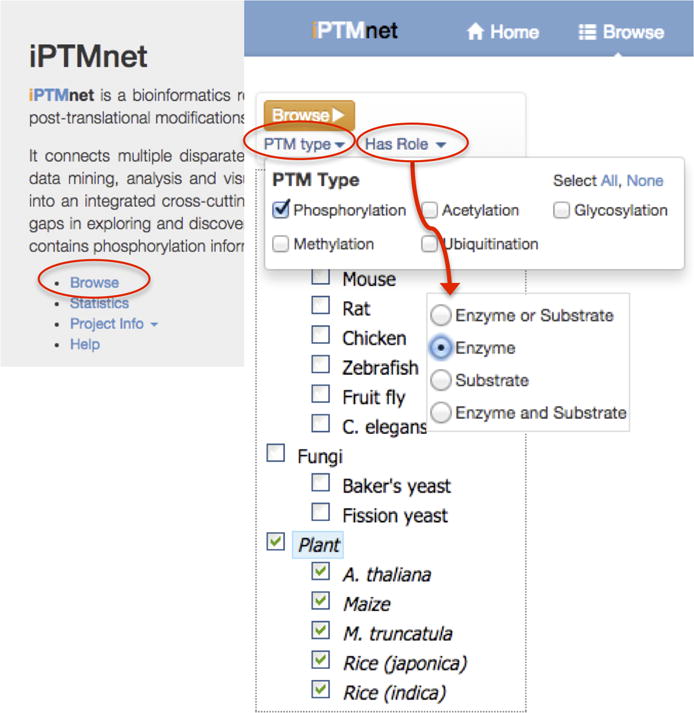
Menu selections for browsing plant kinases in iPTMnet.
Figure 2.
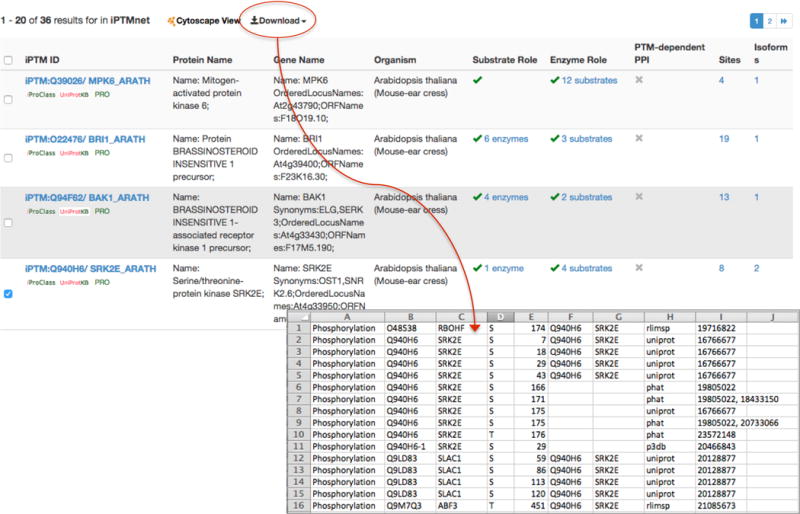
Table of results of browsing plant kinases in iPTMnet. Users can select rows in the table and download the PTM information in tab-delimited format for viewing in a spreadsheet program such as Microsoft Excel.
2.2 Basic Exploration of a PTM network. Example: Arabidopsis thaliana Mitogen-activated protein kinase 6 (MPK6)
The iPTMnet protein entry pages are organized into several tables that provide information about PTM sites, PTM enzymes, proteoforms, and PTM-dependent PPIs for the selected protein. If the protein is itself a PTM enzyme, information about its substrates is also given. Users can access two visualization options from the entry pages: (i) a Cytoscape network view of the PTM relationships and (ii) a multiple sequence alignment view that shows an alignment of proteoforms of the selected protein as well as orthologous proteins from other organisms with PTM sites highlighted (see sections 2.5 and 2.6). We will illustrate how the protein entry page can be used to answer PTM-related questions about a protein of interest using Arabidopsis MPK6 as an example. MPK6 is a MAPK, one of the terminal kinases in the MAPK signaling cascade, and plays a key role in the response to pathogens [10]. In general, MAPKs are activated via phosphorylation by upstream kinases. Therefore, we would expect MPK6 to be a phosphoprotein as well.
2.2.1 Is MPK6 a phosphoprotein? If so, what sites is it phosphorylated on? What phosphorylated proteoforms of MPK6 are known?
In the section labeled “Search for Protein in the iPTMnet Database” on the iPTMnet home page (http://research.bioinformatics.udel.edu/iptmnet/), enter MPK6 in the search box (Figure 3A). Because we are interested in Arabidopsis MPK6, select A. thaliana from the “Restrict by Organism” menu, and click Submit.
Search results are displayed on a new page with the search term highlighted in yellow (Figure 3B). The columns in the search results table are the same as in the browse results table described above. In this case, only one iPTMnet entry, our desired protein Arabidopsis MPK6, matches the search criteria. Click on the iPTMnet ID to go to the entry page (Figure 3C).
To view information about PTM sites in MPK6, click on “Q39026 (MPK6) as Substrate” in the gray “Display” box in the upper left corner of the page (Figure 4A). This will bring the Substrate table to the top of the browser window (Figure 4B). The table has five columns: Site, PTM Type, PTM Enzyme, Source, and PMID. We can see that MPK6 is indeed a phosphoprotein. It has four phosphorylation sites at S215, T221, Y223, and T226. The PTM enzyme is not known for any of these sites. We can view the information in its source database or view the associated literature citations, by clicking on the links in the Source and PMID columns, respectively.
To view proteoforms of MPK6, click on “Proteoforms” in the “Display” box (Figure 4C). The Proteoform table lists the proteoform ID, the site and type of modification, the modifying enzymes if known, source, and literature reference. One MPK6 proteoform has been described: MPK6/Phos:1 (PR:000028874), which is doubly phosphorylated on T221 and Y223, two of the sites listed in the Substrate table. Inspection of the Results section of one of the literature references by clicking on its PMID, 10713056, and then navigating to the full-text article via PubMed indicates that this proteoform is the active form of MPK6 [11].
Figure 3.
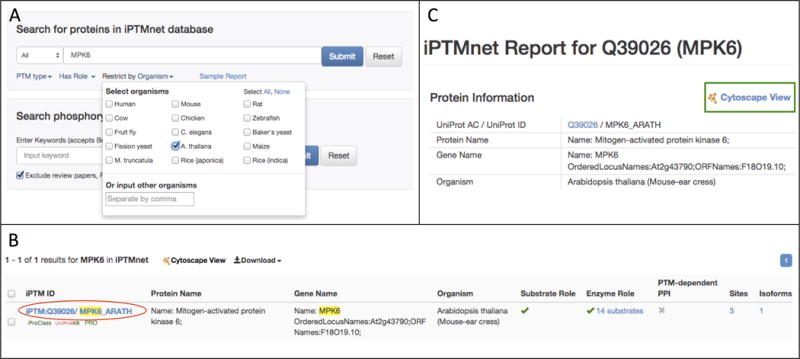
(A) The iPTMnet protein search interface. Settings for searching for MPK6 kinase in Arabidopsis are shown. (B) Results page for the search shown in (A). (C) Top portion of the iPTMnet entry page for Arabidopsis MPK6. The link to the Cytoscape network view for this protein is outlined in the green box.
Figure 4.

Parts of the iPTMnet entry page for Arabidopsis MPK6. (A) The Display panel with links to the various tables on the entry page. Links to the MPK6 as Substrate table shown in (B) and the Proteoforms table shown in (C) are indicated by the red circles. (B) The MPK6 as Substrate table, which shows information about PTM sites on MPK6. (C) Proteoforms table, which shows PTM proteoforms of MPK6 that have been curated in PRO. Clicking on links in the PMID column (red circle) will display the PubMed abstracts of articles used as evidence for the PRO terms. From there, users can navigate to the full-text articles, if available, using the PubMed interface. An evidence sentence taken from the Results section of PMID:10713056 is shown in the blue box.
2.2.2 What are the substrates of MPK6?
To view substrates of MPK6, click on “Q39026 (MPK6) as PTM Enzyme” in the “Display” box. The PTM enzyme table has two tabs. The first tab “Protein as Phosphorylation Enzyme” (Figure 5A) shows all substrates of MPK6 in cases where the relevant MPK6 proteoform is not reported; the second tab “Proteoform as Phosphorylation Enzyme” (Figure 5B) shows the substrates of specific proteoforms of MPK6. The “Protein as Phosphorylation Enzyme” table lists the ID of the substrate, the site, the source database, and literature references (see Note 5). Each substrate-site pair is listed in its own row. Thus, the first and second rows of the table indicate that MPK6 phosphorylates the substrate ZAP6 on S8 and S223, respectively. Overall, there are 7 substrates, and 10 substrate-site pairs listed. The “Proteoform as Phosphorylation Enzyme” table lists the ID of the modified proteoform, the modification sites, and the ID of the MPK6 proteoform that is acting as the PTM enzyme as well as source information and references. In this table we see that the doubly phosphorylated activated form of MPK6 (MPK6/Phos:1, PR:000028874) phosphorylates one or more sites on five different proteins (see Note 6).
Figure 5.
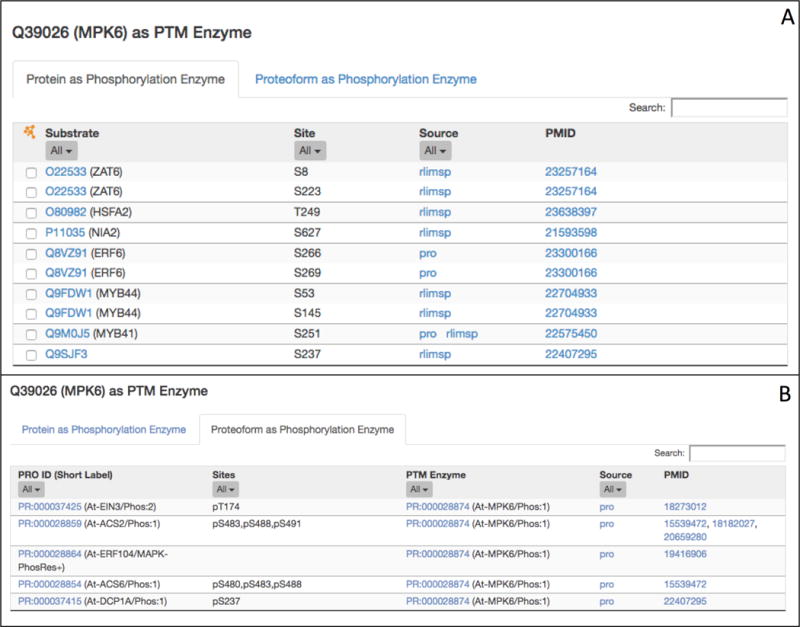
The MPK6 as PTM Enzyme table for Arabidopsis MPK6. The table has two tabs. The first tab (A) shows substrate and site information for MPK6 in general. The second tab (B) shows substrate and site information for a phosphorylated proteoform of MPK6 (At-MPK6/Phos:1, PR:000028874).
2.2.3 Visualization of the MPK6 Phosphorylation Network
For a network view of MPK6 relationships, click on the Cytoscape View icon at the top right of the page in the Protein Information section (green box in Figure 3C). The network will be displayed in a new tab/window (Figure 6). Click on “LEGEND” in the upper left corner of the window to display an explanation of the node and edge style. PTM enzyme nodes are pentagons and substrates and sites are circles. PTM-enzyme→site PTM-enzyme→proteoform, and site→substrate edges are shown. The color of the PTM-enzyme nodes and PTM-enzyme→site/proteoform edges indicates the PTM type (e.g., pink represents phosphorylation).
Figure 6.
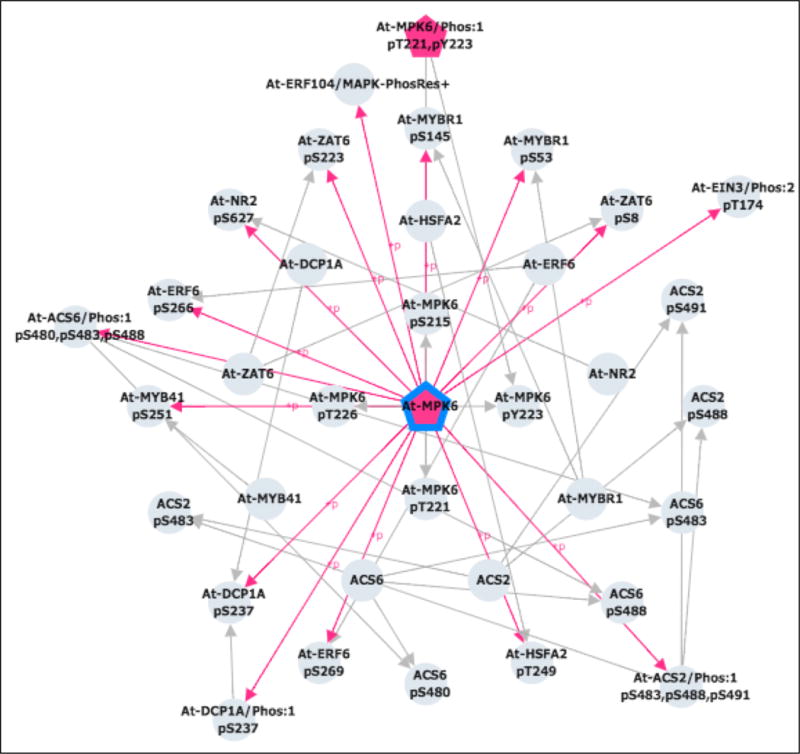
Cytoscape network view for Arabidopsis MPK6. Kinases are pink, pentagonal nodes; proteins, sites, and proteoforms are grey circles. Grey edges connect sites to their corresponding proteins and proteoforms. Pink edges connect kinases to the sites they phosphorylate. MPK6 itself is outlined in blue.
2.3 PMID-centric searching in iPTMnet
iPTMnet also allows users to search for a PMID of interest and view a summary of all PTM information in iPTMnet associated with that PMID.
From the iPTMnet home page, select “PMID” from the pull-down menu to the left of the “Search for Proteins in iPTMnet Database” panel. Enter a PMID of your choice, for example 15696159, and click Submit (Figure 7A).
-
Inspect the results page. The page shows the PMID, title, and abstract of the article (Figure 7B), followed by several tables of PTM information (Figure 7C–F). The selection of tables that is displayed will depend on the PTM information in the article. In this case, there are four tables:
Enzyme-Substrate Table (Figure 7C): This table summarizes the PTM enzyme, substrate, and site information in iPTMnet for which the article is cited as evidence. We can see that this article described phosphorylation of ABL1 and 14-3-3 proteins (YWHAB and YWHAZ). In two cases (YWHAB pS186 and YWHAZ pS184), the kinase, MAPK8, is also provided.
Proteoform Table (Figure 7D): This table displays the proteoforms curated by PRO based on the article. Two of the substrate-site pairs shown in the first table have been curated by PRO: ABL1 pT735 (PR:000044506) and 14-3-3 protein zeta/delta (YWHAZ) pS184 (PR:000044508).
Proteoform PPIs (Figure 7E): This table shows the phosphorylation-dependent PPIs that have been curated by PRO based on the article. For example, the tyrosine-phosphorylated form of ABL1 (PR:0000544506) interacts with YWHAZ.
PTM-dependent PPI (Figure 7F): This table displays phosphorylation-dependent PPIs automatically extracted from the article by the text-mining tool, eFIP. In this case, eFIP detected an interaction between phosphorylated ABL1 and the 14-3-3 family member, YWHAQ.
Figure 7.
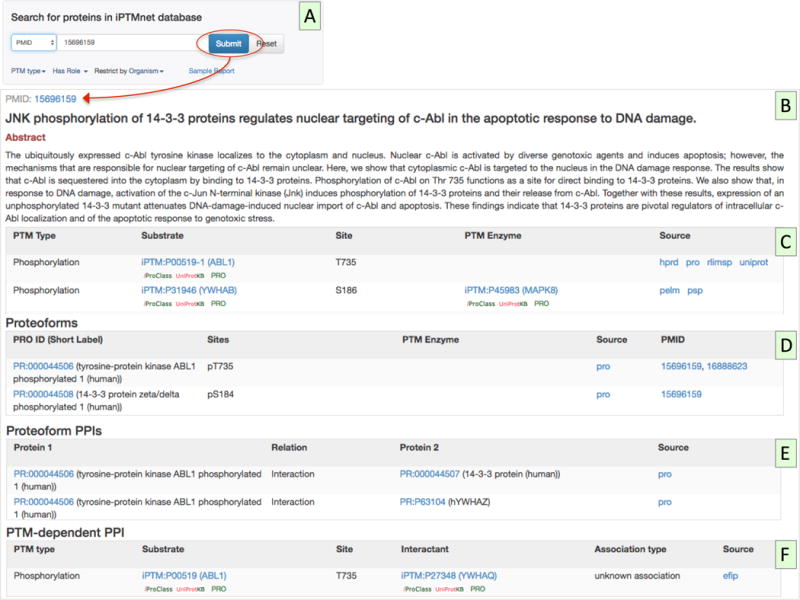
PMID-centric view in iPTMnet. Searching for PMID: 15696159 (A) opens the PMID: 15696159 entry page, which displays the title and abstract of the article (B) as well as several tables of iPTMnet information associated with the article: a PTM enzyme-substrate table (C), a proteoform table (D), a proteoform-PPI table showing curated phosphorylation-dependent PPIs from PRO (E), and a PTM-dependent PPI table showing phosphorylation-dependent PPIs automatically extracted by eFIP (F).
2.4 Construction and analysis of more complex PTM networks. Example: tyrosine phosphorylation of beta-catenin (CTNNB1) during mitosis
Users can construct networks based on multiple iPTMnet entry pages in order to address more complex scientific questions as shown in the following example involving beta-catenin (CTNNB1). CTNNB1 functions as an adhesion molecule as part of the adherens junction at the cell membrane and as a transcriptional co-regulator in the nucleus. The distribution of CTNNB1 between the membrane-associated and nuclear pools as well as CTNNB1 stability are regulated by a complex interplay of multiple PTMs. Tyrosine phosphorylation of CTNNB1, which occurs on several residues is generally associated with CTNNB1 dissociation from the membrane, increased stability, and increased transcriptional activity [12]. It has been reported that CTNNB1 tyrosine phosphorylation decreases during mitosis [13]. It is plausible that this decrease is due to regulation of one or more of the CTNNB1 tyrosine kinases by the mitotic kinase CDK1. We can use iPTMnet to identify tyrosine kinases that phosphorylate CTNNB1 that are in turn phosphorylated by CDK1.
Search for the CTNNB1 entry page in iPTMnet as in step 1 of section 2.2.1. Enter “CTNNB1” in the search box and select human as the organism. You will see one search result; click on its iPTMnet ID (iPTM:P35222/CTNB1_HUMAN) to go to the entry page.
Go to the “P35222 (CTNNB1) as Substrate” table. Because we are interested in CTNNB1 tyrosine phosphorylation, use the pull-down menu in the Site column to select “All Tyrosine” and the pull-down menu in the PTM Type column to select “Phosphorylation.” This will filter the table to show only tyrosine phosphorylation events (Figure 8).
Next, we will build a custom network view that only displays the kinase-site relations for the tyrosine phosphorylation sites. For each site that has a known kinase, there is a check box to the left of the site column (Figure 8, red arrow). Click on all of the check boxes in the filtered Substrate table. As you click on each one, the substrate ID, site, and kinase ID will appear in the grey Cytoscape View panel on the left. Click on the submit button at the bottom of the Cytoscape View panel (Figure 8, green rectangle). The network will be displayed in a new tab/window. You can manually position the nodes by clicking and dragging to make a concentric layout with CTNNB1 in the center, its tyrosine phosphorylation sites in the inner ring, and the kinases in the outer ring (Figure 9). The network shows seven CTNNB1 tyrosine phosphorylation sites (Y64, Y86, Y142, Y331, Y333, Y489, Y654) that are phosphorylated by ten kinases (EGFR, FLT3, FYN, FGFR2, FGFR3, PTK6, CSK, SRC, NTRK1, and ABL1; the “h” preceding each kinase name in the Cytoscape network indicates that they are from human).
The next step is to determine which of these tyrosine kinases is a substrate of the mitotic kinase CDK1. Return to the tab/window displaying the CTNNB1 entry page. Do not clear the Cytoscape View panel. Click on the iPTMnet logo in the upper left corner of the page to go to the home page. Search for CDK1 in human as you did for CTNNB1 in step 1 of this section. Click on the search result (iPTM:P06493/CDK1_HUMAN) to go to the human CDK1 entry page.
Go to the “P06493 (CDK1) as PTM Enzyme” table. Enter the first CTNNB1 tyrosine kinase from step 3 (EGFR) into the search box in the upper right corner of the table (Figure 10A). The table will display only one row, which indicates that EGFR S1026 is phosphorylated by CDK1. Check the box to the left of the site column to add this relation to the custom Cytoscape view. The Cytoscape panel should still be displaying the CTNNB1 kinase-substrate relations added in step 3. Next, search for the second kinase, FLT3, in the table. iPTMnet does not have any information about CDK1 phosphorylation of FLT3, so the search returns, “No matching records found” (Figure 10B). Continue to search for the remaining nine kinases. Of these kinases, only one (ABL1) is a CDK1 substrate; add this relation to the Cytoscape View. Finally, click on the submit button in the Cytoscape View panel to see the network.
You can manually position the nodes to create the arrangement shown in Figure 11. The gray outline shows the CDK1 relations that were added to the network. From this analysis, we can conclude that CDK1 may regulate EGFR through phosphorylation on S1026 and ABL through phosphorylation on S569, which, in turn, could affect CTNNB1 phosphorylation on Y86, Y142, Y489, and Y654. To test the hypothesis that CDK1 is negatively regulating CTNNB1 phosphorylation via EGFR and/or ABL, the next step would be to check the literature references for the CDK1-EGFR and CDK1-ABL kinase-substrate relations to see what effect CDK1 phosphorylation has on EGFR and ABL activity.
Figure 8.
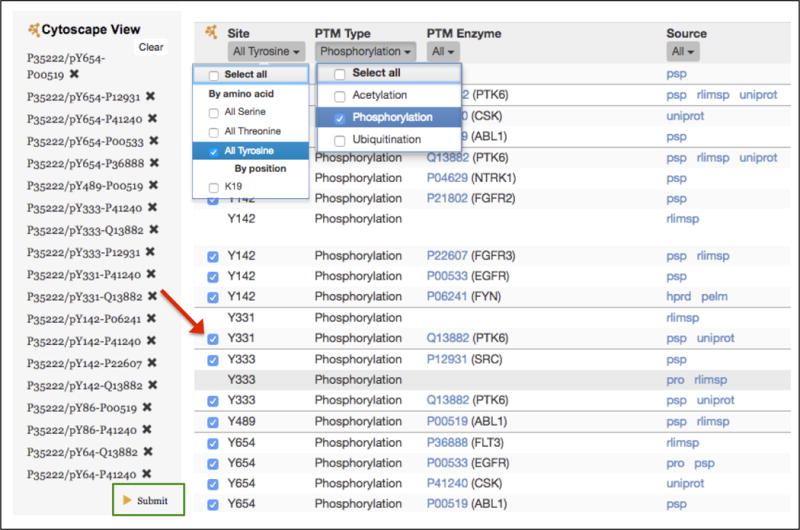
Portion of the human CTNNB1 entry page illustrating how to construct a custom Cytoscape network view of tyrosine phosphorylation of CTNNB1. The right side of the figure shows the settings for filtering the CTNNB1 as substrate table to show only tyrosine phosphorylation sites. Clicking the checkboxes next to the tyrosine sites (red arrow) adds these relations to the custom Cytoscape View panel (left). Clicking on the Submit button (outlined in green) will display the network.
Figure 9.

Cytoscape view of tyrosine phosphorylation of CTNNB1. Kinases are pink, pentagonal nodes; CTNNB1 and its phosphorylation sites are grey circles. Grey edges connect sites to CTNNB1. Pink edges connect kinases to the sites they phosphorylate.
Figure 10.
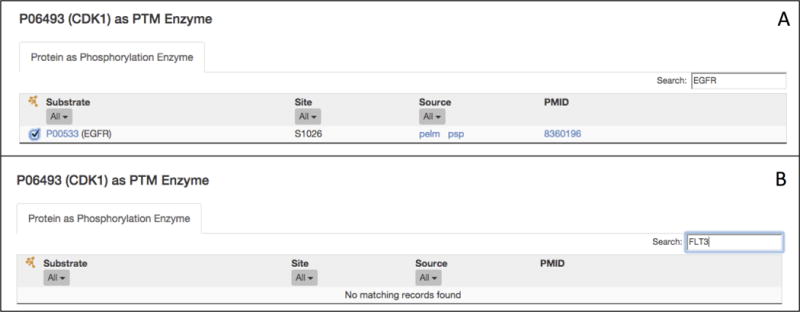
Views of the human CDK1 as PTM Enzyme table, illustrating how to search for particular substrates of interest. Searching the table for EGFR (A) returns one result, indicating that CDK1 phosphorylates EGFR on one site (S1026). Searching for FLT3 (B) returns no results, indicating that iPTMnet does not have any information about FLT3 phosphorylation by CDK1.
Figure 11.
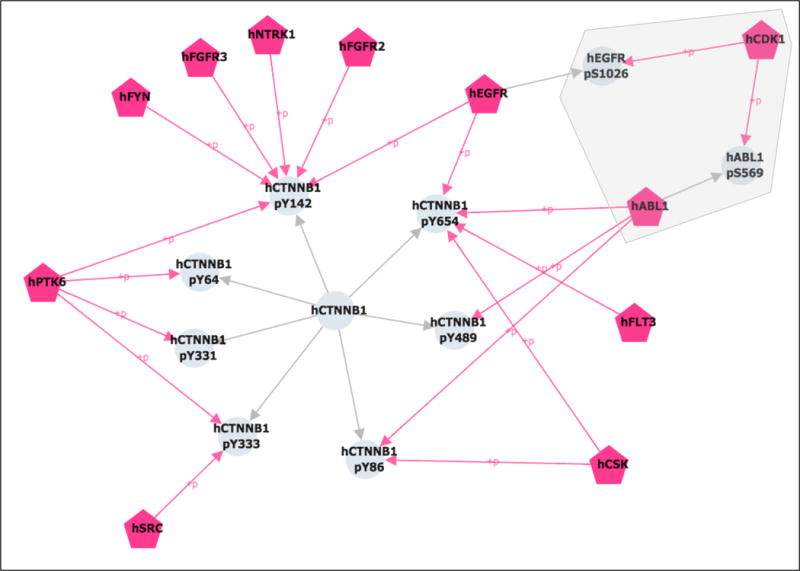
Cytoscape network view showing potential regulation of CTNNB1 tyrosine phosphorylation by CDK1. The CTNNB1 tyrosine phosphorylation network is shown as in Figure 9. In addition, phosphorylation of CTNNB1 tyrosine kinases by CDK1 is shown (grey outline). Kinases are pink, pentagonal nodes; other proteins and their phosphorylation sites are grey circles. Grey edges connect sites to their corresponding proteins. Pink edges connect kinases to the sites they phosphorylate.
2.5 Analysis of PTM-crosstalk in iPTMnet. Example: TP53 and EP300
PTM crosstalk is the influence of one PTM on other PTMs of the same substrate protein. Crosstalk can involve direct competition between two PTMs for a single site, or it can occur when PTM at one site enhances or inhibits binding of PTM enzyme, thereby influencing PTM at a second site. iPTMnet can be used to explore both of these types of crosstalk. To facilitate identification of cases where two PTMs compete for the same site, sites that undergo multiple types of PTM are highlighted in a special dark yellow color in the iPTMnet sequence view. To identify potential crosstalk among multiple sites in a protein, we can take advantage of the integration of PTM-dependent PPI and PTM-enzyme-substrate information in iPTMnet. Specifically, we can find cases where a PTM enzyme is involved in a PTM-dependent PPI with a protein via one modification site and also modifies a second site on the same protein. Although the existence of these multiple relations does not definitively show that PTM crosstalk is occurring, it pinpoints interesting candidates for further study. In this section, we will illustrate how to use iPTMnet to explore PTM crosstalk using the tumor suppressor protein TP53 and the acetyltransferase EP300 as examples.
2.5.1 PTM Crosstalk I: Exploring Sites with Multiple Possible Modifications
Using a similar procedure to steps 1–2 of section 2.2.1, go to the iPTMnet entry page for human TP53. Enter “TP53” in the search box and select human from the Restrict by Organism menu.
Look at the Interactive Sequence View Panel. It may take a few extra seconds to load. You will see a “zoomed-out” view of the human TP53 protein sequence. Only the modified residues are shown, highlighted in different colors. The color of the highlighting indicates the type of modification: pink is phosphorylation, light blue is methylation, dark blue is acetylation, and dark yellow is multiple modifications. You can scroll through the sequence using the horizontal scroll bar.
Click on the magnifying glass in the upper right corner of the panel. Now you will see a “zoomed-in” view of the sequence that displays all residues. The modified residues are still highlighted as before and you can scroll through the sequence using the horizontal scroll bar (Figure 12A). Clicking on the magnifying glass again will return you to the “zoomed-out” view.
Moving the mouse over a highlighted residue in either the “zoomed-out” or “zoomed-in” view will open a box with information about the modification, including modification type, PTM enzyme (if known), evidence source, and literature references. To examine this information for a multiply modified site that may serve a point of PTM crosstalk, mouse over the dark yellow highlighted serine residue at position 149 (Figure 12A). The box reveals that this site is both phosphorylated by casein kinase II (CSNK2A1) and glycosylated. Click on the PMIDs to view the evidence for these modifications and learn more about how they may interact.
Figure 12.
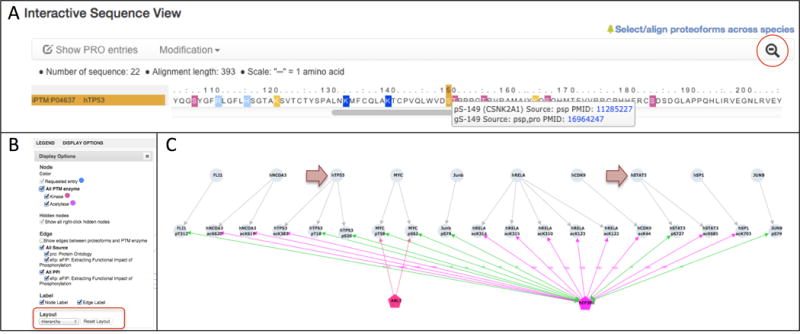
PTM crosstalk involving human TP53 and EP300. (A) Interactive sequence view panel on the human TP53 entry page. Modified sites are highlighted (pink: phosphorylation; light blue: methylation, dark blue: acetylation, dark yellow: multiple modifications). Mousing-over a modified site (e.g. S149) pops up a window with more information about the modification. Clicking on the magnifying glass (red circle) toggles between a zoomed-out and zoomed-in view of the sequence. The zoomed-in view is shown. (B) Display Options panel in the Cytoscape network view window showing network style parameters that can be set by the user. The menu for changing the network layout is indicated in the red rectangle. (C) Cytoscape network view showing PTM-dependent PPIs (green edges) and PTM enzyme-site (purple edges) relations for human EP300. The arrows indicate proteins that are involved in phosphorylation-dependent PPIs with EP300 and are also acetylated by EP300. PTM enzymes are pentagonal nodes (pink: kinases, purple: acetylases). Other proteins and sites are grey circles. Grey edges connect sites to their corresponding proteins; pink edges indicate phosphoryaltion; purple edges indicate acetylation; and green edges indicate phosphorylation-dependent PPIs.
2.5.2 PTM Crosstalk II: Exploring Crosstalk Among Multiple Residues
Using a similar procedure to steps 1–2 of section 2.2.1, go to the iPTMnet entry page for human acetyl transferase EP300. Enter “EP300” in the search box and select human from the Restrict by Organism menu. Click on the search result (iPTM:Q09472/EP300_HUMAN) to go to the entry page.
Inspect the Q09472 (EP300) as PTM Enzyme table to view substrates/sites that are acetylated by EP300. One of the substrates listed is TP53, which is acetylated by EP300 on K382. Another, STAT3, is acetylated on K685.
Next, inspect the PTM-Dependent PPI table (the last table on the entry page). You will see that EP300 (the interactant) participates in several PTM-dependent PPIs, including one with TP53 phosphorylated on T18 or S20. Thus, EP300 participates in a PTM-dependent PPI with TP53 and also acetylates TP53, raising the possibility that there is crosstalk between these two modifications. To learn more about the nature of this potential crosstalk, click on the PMID for the TP53-EP300 interaction (PMID:11258706) and review the abstract. The abstract states that phosphorylation of EP300 on T18 and S20 enhances EP300 binding, suggesting that phosphorylation of TP53 on T18 and S20 may lead to increased acetylation at K382 by EP300. Similarly, EP300 participates in PTM-dependent PPI with STAT3 phosphorylated on S727. Since STAT3 is also acetylated by EP300, there is also possible crosstalk between these modifications.
This analysis can also be performed using the Cytoscape network view. To create the view, first click on “Clear” in the Cytoscape View panel to remove any previous selections. Next, go to the Q09472 (EP300) as PTM Enzyme table and click the checkboxes next to each EP300 substrate/site pair. These relations should appear in the Cytoscape View panel. Then, go to the PTM-dependent PPI table and click on all of the checkboxes to add these relations to the network view. Click on “Submit” in the Cytoscape View panel, which will display the network in a new tab. To more easily identify cases where proteins participate in multiple types of relations with EP300 (i.e., PTM-enzyme-site and PTM-dependent PPI), open the Display Options menu and select “Hierarchical” from the Layout menu (Figure 12B). Inspect the network (Figure 12C). You should see that TP53 has three modification sites that are involved in relations with EP300: two phosphorylation sites (T18 and S20) that participate PTM-dependent PPIs (green edges) and one site (K382) that is acetylated. STAT3 has two sites involved in relations with EP300: one phosphorylation site (S727) that participates in a PTM-dependent PPI and one acetylation site (K685). The other proteins in the network are involved in either PTM-dependent PPI or acetylation relations with EP300, but not both.
2.6 Exploration of Cross-Species Conservation of PTMs in iPTMnet. Example: BCL2 in Human, Mouse, and Rat
The iPTMnet Interactive Sequence Alignment view provides a convenient interface for comparing PTM proteoforms within and across species. The view uses the PRO hierarchy to identify related sequences to align. Experimentally observed PTM sites in each sequence are highlighted in color. If the modifiable residue is conserved in other sequences in the alignment, it is highlighted in grey. Users can select which sequences and/or PTMs to show in the alignment. We will use the iPTMnet MSA view to compare phosphorylation of the anti-apoptotic and cell cycle inhibitory protein BCL2 in human, mouse, and rat.
Go to the iPTMnet entry page for human BCL2 (P10415).
In the upper right corner of the Interactive Sequence View panel, click on “Select/align proteoforms across species. The alignment will open in a new tab (Figure 13A). Nine sequences are shown by default. The first four sequences are BCL2 orthologs from different species (human/hBCL2, rat/rBCL2, chicken/chick-BCL2, and mouse/mBLC2). Human BCL2 has eight phosphorylation sites (highlighted in pink) and one ubiquitination site (highlighted in dark blue). One human phosphorylation site, Y9, is conserved in mouse, rat, and chicken (as indicated by the grey highlighting) but has not been experimentally shown to be phosphorylated in these organisms. Another site, S70, has been shown to be phosphorylated in human, mouse, and rat, but is not conserved in chicken. The remaining sequences are proteoforms of BCL2 (four human and one mouse) with experimentally observed combinations of phosphorylation sites. For example, hBCL2/iso:1/Phos:3 (PR:000027463) is phosphorylated on three of the six possible sites (T69, S70, and S87). hBCL2/iso:1/Phos:4 (PR:000027465) is phosphorylated on T69 and S87, but not S70.
At the left of the alignment, there is a hierarchical tree view that lists the sequences shown in the alignment (Figure 13A). To more easily compare human, mouse, and rat BCL2 uncheck all of the sequences in the tree except hBCL2, mBCL2, and rBCL2 and click on “Align.” Click on the magnifying glass in the upper right corner of the alignment to see the “zoomed-in” view (Figure 13B). Six of the human phosphorylation sites (Y9, S24, S69, S70, S87, and Y235) and the ubiquitination site (K22) are conserved in all three organisms. In addition, S70 and S87 have been shown to be phosphorylated in all three organisms. However, the remaining two sites, T56 and T74, are not conserved in rat or mouse.
Mouse-over human T56 and T74 to see the kinase information and references for these sites. T56 is phosphorylated by MAPK1, MAPK3, MAPK14, and CDK1; T74 is phosphorylated by MAPK1 and MAPK3. Click on the PMIDs to learn more about the regulation and functional consequences of these modifications. According to PMID:10669763, phosphorylation of T56, T74, and S87 by MAPK family members protects BCL2 from degradation, thereby preserving its anti-apoptotic activity. S87, which is phosphorylated in human, mouse, and rat appears to be the most important site for preventing degradation. Thus, it is possible that this regulatory mechanism is conserved in mouse and rat and mediated by phosphorylation S87 only [14]. However, according to PMID:10766756, phosphorylation of T56 by CDK1 is required for the cell cycle inhibitory function of BCL2 [15]. Lack of conservation of this site in mouse and rat raises interesting questions about the cell cycle role of BCL2 in these organisms.
Figure 13.
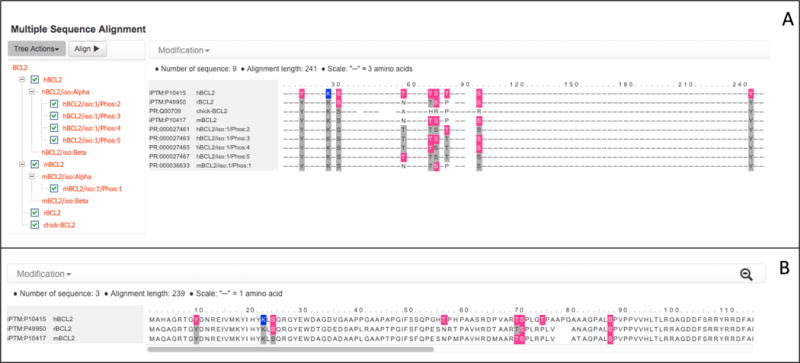
(A) Multiple Sequence Alignment view for BCL2. Phosphorylated sites are indicated in pink; conserved phosphorylation sites are indicated in grey. The zoomed-out sequence is shown. On the left, the tree view for selecting sequences to include in the alignment is shown. (B) Zoomed-in multiple sequence alignment view for three selected BCL2 sequences: human (hBCL2), rat (rBCL2), and mouse (mBCL2).
Acknowledgments
This work was funded by grants from the National Institutes of Health (U01GM120953 and P20GM103446).
Footnotes
- HPRD: post-translational modifications and enzyme-substrate relationships for human proteins [16];
- PhosphoSitePlus: expert curated PTM information including phosphorylation, ubiquitination, acetylation and methylation mainly for human, rat and mouse proteins [5];
- Phospho.ELM: expert curated database for phosphorylation sites in animal proteins [6];
- PhosPhAt: protein phosphorylation sites identified by mass spectrometry in Arabidopsis thaliana [17];
- P3DB: protein phosphorylation data from multiple plants derived from large-scale experiments and the literature [18];
- PhosphoGrid: experimentally verified in vivo protein phosphorylation sites in Saccharomyces cerevisiae [19];
- UniProtKB: comprehensive protein database in which the reviewed section contains expert annotated information from the literature, including PTMs [4];
PRO provides a structured hierarchical representation of protein entities and protein complexes [9]. It consists of three sub-ontologies: ProEvo, for evolutionary relationships among proteins, ProForm, for relationships among proteoforms (see Note 3), including PTM forms of a protein, and ProComp, for protein complexes. Two features of PRO are particularly relevant to iPTMnet. First, orthologous proteins can be easily identified using PRO. In the PRO hierarchy, species-specific orthologs of a protein are connected by an is_a relation (parent-child relationship) to a species-independent term. Second, PRO terms can be defined for individual PTM proteoforms, including forms with multiple PTMs, and these terms can be associated with proteoform-specific functional information. For example, the mouse apoptosis regulatory protein BAD has three phosphorylated proteoforms in PRO involving different combinations of three sites: S112, S136, and S155. PR:000026136 is phosphorylated on Ser-136; PR:000026167 is phosphorylated on S112 and S136; and PR:000026133 is phosphorylated on S112, S136, and S155. The S112/S136 doubly phosphorylated form (PR:000026167) exhibits a phosphorylation-dependent decreased interaction with 14-3-3 proteins; this information is included in the term’s annotation. The relationship among PTM proteoforms of a protein can be easily seen in the PRO hierarchical structure.
Proteoform refers to any of the protein products of a single gene, including those that arise by genetic mutation, alternative splicing, and post-translational modification [20].
The data and screenshots presented in this article were collected from iPTMnet v3.1 in May 2016.
The Substrate column of the PTM enzyme page displays the UniProtKB identifier followed by the gene name in parentheses. If no gene name is given in the UniProtKB record, then only the UniProtKB identifier will be displayed. For example, no gene name is displayed for the MPK6 substrate Q9SJF3 (Figure 5A) because the UniProtKB record does not provide this information. On the UniProtKB entry page, the gene is referred to by its Arabidopsis ordered locus identifier, At5g67300.
If the PTM enzyme is listed as MPK6 (with no proteoform information), it does not imply that the MPK6 is unphosphorylated, just that its phosphorylation status was not assayed and/or reported. It is possible (and even likely given what we know about MAPK signaling pathways and MAPK activity), that MPK6 is phosphorylated on its activating sites in all cases.
References
- 1.Minguez P, Letunic I, Parca L, Bork P. PTMcode: a database of known and predicted functional associations between post-translational modifications in proteins. Nucleic Acids Res. 2013;41:D306–311. doi: 10.1093/nar/gks1230. Database issue. [DOI] [PMC free article] [PubMed] [Google Scholar]
- 2.Patterson H, Nibbs R, McInnes I, Siebert S. Protein kinase inhibitors in the treatment of inflammatory and autoimmune diseases. Clin Exp Immunol. 2014;176(1):1–10. doi: 10.1111/cei.12248. [DOI] [PMC free article] [PubMed] [Google Scholar]
- 3.Zhou N, Xu W, Zhang Y. Histone deacetylase inhibitors merged with protein tyrosine kinase inhibitors. Drug Discov Ther. 2015;9(3):147–155. doi: 10.5582/ddt.2015.01001. [DOI] [PubMed] [Google Scholar]
- 4.UniProt C. UniProt: a hub for protein information. Nucleic Acids Res. 2015;43:D204–212. doi: 10.1093/nar/gku989. Database issue. [DOI] [PMC free article] [PubMed] [Google Scholar]
- 5.Hornbeck PV, Zhang B, Murray B, Kornhauser JM, Latham V, Skrzypek E. PhosphoSitePlus, 2014: mutations, PTMs and recalibrations. Nucleic Acids Res. 2015;43:D512–520. doi: 10.1093/nar/gku1267. Database issue. [DOI] [PMC free article] [PubMed] [Google Scholar]
- 6.Dinkel H, Chica C, Via A, Gould CM, Jensen LJ, Gibson TJ, Diella F. Phospho.ELM: a database of phosphorylation sites–update 2011. Nucleic Acids Res. 2011;39:D261–267. doi: 10.1093/nar/gkq1104. Database issue. [DOI] [PMC free article] [PubMed] [Google Scholar]
- 7.Torii M, Arighi CN, Gang L, Qinghua W, Wu CH, Vijay-Shanker K. RLIMS-P 2.0: A Generalizable Rule-Based Information Extraction System for Literature Mining of Protein Phosphorylation Information. IEEE/ACM Trans Comput Biol Bioinform. 2015;12(1):17–29. doi: 10.1109/TCBB.2014.2372765. [DOI] [PMC free article] [PubMed] [Google Scholar]
- 8.Tudor CO, Ross KE, Li G, Vijay-Shanker K, Wu CH, Arighi CN. Construction of phosphorylation interaction networks by text mining of full-length articles using the eFIP system. Database (Oxford) 2015;2015 doi: 10.1093/database/bav020. [DOI] [PMC free article] [PubMed] [Google Scholar]
- 9.Natale DA, Arighi CN, Blake JA, Bult CJ, Christie KR, Cowart J, D’Eustachio P, Diehl AD, Drabkin HJ, Helfer O, Huang H, Masci AM, Ren J, Roberts NV, Ross K, Ruttenberg A, Shamovsky V, Smith B, Yerramalla MS, Zhang J, AlJanahi A, Celen I, Gan C, Lv M, Schuster-Lezell E, Wu CH. Protein Ontology: a controlled structured network of protein entities. Nucleic Acids Res. 2014;42:D415–421. doi: 10.1093/nar/gkt1173. Database issue. [DOI] [PMC free article] [PubMed] [Google Scholar]
- 10.Colcombet J, Hirt H. Arabidopsis MAPKs: a complex signalling network involved in multiple biological processes. Biochem J. 2008;413(2):217–226. doi: 10.1042/BJ20080625. [DOI] [PubMed] [Google Scholar]
- 11.Nuhse TS, Peck SC, Hirt H, Boller T. Microbial elicitors induce activation and dual phosphorylation of the Arabidopsis thaliana MAPK 6. J Biol Chem. 2000;275(11):7521–7526. doi: 10.1074/jbc.275.11.7521. [DOI] [PubMed] [Google Scholar]
- 12.Valenta T, Hausmann G, Basler K. The many faces and functions of beta-catenin. EMBO J. 2012;31(12):2714–2736. doi: 10.1038/emboj.2012.150. [DOI] [PMC free article] [PubMed] [Google Scholar]
- 13.Bauer A, Lickert H, Kemler R, Stappert J. Modification of the E-cadherin-catenin complex in mitotic Madin-Darby canine kidney epithelial cells. J Biol Chem. 1998;273(43):28314–28321. doi: 10.1074/jbc.273.43.28314. [DOI] [PubMed] [Google Scholar]
- 14.Breitschopf K, Haendeler J, Malchow P, Zeiher AM, Dimmeler S. Posttranslational modification of Bcl-2 facilitates its proteasome-dependent degradation: molecular characterization of the involved signaling pathway. Mol Cell Biol. 2000;20(5):1886–1896. doi: 10.1128/mcb.20.5.1886-1896.2000. [DOI] [PMC free article] [PubMed] [Google Scholar]
- 15.Furukawa Y, Iwase S, Kikuchi J, Terui Y, Nakamura M, Yamada H, Kano Y, Matsuda M. Phosphorylation of Bcl-2 protein by CDC2 kinase during G2/M phases and its role in cell cycle regulation. J Biol Chem. 2000;275(28):21661–21667. doi: 10.1074/jbc.M906893199. [DOI] [PubMed] [Google Scholar]
- 16.Keshava Prasad TS, Goel R, Kandasamy K, Keerthikumar S, Kumar S, Mathivanan S, Telikicherla D, Raju R, Shafreen B, Venugopal A, Balakrishnan L, Marimuthu A, Banerjee S, Somanathan DS, Sebastian A, Rani S, Ray S, Harrys Kishore CJ, Kanth S, Ahmed M, Kashyap MK, Mohmood R, Ramachandra YL, Krishna V, Rahiman BA, Mohan S, Ranganathan P, Ramabadran S, Chaerkady R, Pandey A. Human Protein Reference Database–2009 update. Nucleic Acids Res. 2009;37:D767–772. doi: 10.1093/nar/gkn892. Database issue. [DOI] [PMC free article] [PubMed] [Google Scholar]
- 17.Zulawski M, Braginets R, Schulze WX. PhosPhAt goes kinases–searchable protein kinase target information in the plant phosphorylation site database PhosPhAt. Nucleic Acids Res. 2013;41:D1176–1184. doi: 10.1093/nar/gks1081. Database issue. [DOI] [PMC free article] [PubMed] [Google Scholar]
- 18.Yao Q, Ge H, Wu S, Zhang N, Chen W, Xu C, Gao J, Thelen JJ, Xu D. P(3)DB 3.0: From plant phosphorylation sites to protein networks. Nucleic Acids Res. 2014;42:D1206–1213. doi: 10.1093/nar/gkt1135. Database issue. [DOI] [PMC free article] [PubMed] [Google Scholar]
- 19.Sadowski I, Breitkreutz BJ, Stark C, Su TC, Dahabieh M, Raithatha S, Bernhard W, Oughtred R, Dolinski K, Barreto K, Tyers M. The PhosphoGRID Saccharomyces cerevisiae protein phosphorylation site database: version 2.0 update. Database (Oxford) 2013;2013:bat026. doi: 10.1093/database/bat026. [DOI] [PMC free article] [PubMed] [Google Scholar]
- 20.Smith LM, Kelleher NL, Consortium for Top Down P Proteoform: a single term describing protein complexity. Nat Methods. 2013;10(3):186–187. doi: 10.1038/nmeth.2369. [DOI] [PMC free article] [PubMed] [Google Scholar]
- 21.Wei CH, Kao HY. Cross-species gene normalization by species inference. BMC Bioinformatics. 2011;12(Suppl 8):S5. doi: 10.1186/1471-2105-12-S8-S5. [DOI] [PMC free article] [PubMed] [Google Scholar]


