Abstract
Correct staging is the most crucial for the treatment outcome in cancer management. Molecular imaging with 18F-fluoroestradiol (FES) positron emission tomography-computed tomography (PET-CT) targets estrogen receptor (ER) and may have a higher incremental value in diagnosis by aiding specificity. We enrolled 12 female breast cancer patients prospectively and did 18F-FES PET-CT and 18F-fluorodeoxyglucose (FDG) PET-CT within 1 week interval time. Lesion detection sensitivity was compared for a total number of lesions and for nonhepatic lesions only by McNemar test. 18F-FES PET-CT was taken as reference in case of indeterminate lesions. The incremental value reported by identifying 18F-FES exclusive lesions and by characterization of 18F-FDG indeterminate lesions. Spearman rank test was used to correlate ER expression and maximum standardized uptake value (SUVmax). Two ER-negative patients with no 18F-FES uptake were excluded. Ten ER-positive patients with 154 disease lesions were finally analyzed. 18F-FDG picked-up 142 lesions (sensitivity 92.21%), whereas 18F-FES picked-up 116 lesions (sensitivity 75.32%) and this difference was statistically significant. For nonhepatic lesions (n = 136) detectability, 18F-FDG picked-up 124 (sensitivity 91.18%), whereas 18F-FES picked-up 116 (sensitivity 85.29%) lesions and this difference was not statistically significant. Beside 12 exclusive lesions, 18F-FES characterized 41 (27.5%) 18F-FDG indeterminate lesions. Overall 18F-FES impacted 20% patient management. The positive trend was also seen with 18F-FES SUVmax with ER expression and negative with 18F-FDG SUVmax. We conclude, 18F-FDG has overall better sensitivity than 18F-FES PET-CT, however for nonhepatic metastasis difference was not significant. 18F-FES PET-CT better-characterized lesions and impacted 20% patient management. Therefore, 18F-FES PET-CT should be used with 18F-FDG PET-CT in strongly ER expressing patients for better specificity.
Keywords: 18F-fluorodeoxyglucose positron emission tomography-computed tomography, 18F-fluoroestradiol positron emission tomography-computed tomography, diagnostic strength, estrogen receptor-positive breast cancer, incremental value
Introduction
Population-based cancer registry has documented that breast cancer has become a leading cancer in India in many cities and has been projected as the number one cancer in future.[1] Correct staging and early diagnosis are what matters the most in patient management. Cancer imaging has grown from morphological imaging to molecular imaging in recent decades. 18F-fluorodeoxyglucose (FDG) positron emission tomography-computed tomography (PET-CT) has already proved it in many clinical scenarios.[2,3,4,5,6] In breast cancer, 18F-FDG PET-CT commonly is being asked for in locally advanced cancer for metastatic workup, for response evaluation and in suspected recurrence. 18F-FDG PET-CT exploits the high glucose turnover in cancer cells compared to normal cells.[7,8] It is a well-known fact that granulocytes and activated lymphocytes also exhibit significantly increased glucose uptake and in many occasions, it creates a diagnostic dilemma in 18F-FDG PET-CT interpretation.[9,10] Molecular targeted imaging radiopharmaceuticals will not only improve the diagnostic specificity but will also facilitate a better understanding of the treatment outcomes.[11]
Estrogen receptor-positive (ER+) breast cancer is the most common type diagnosed today.[12] According to the American Cancer Society, about two out of every three cases are hormone receptor-positive. The understanding of the ER expression has an impact on both treatment planning and prognosis.[13] In present practice, ER expression is measured on the pathological sample by immunohistochemistry (IHC). However, there may be heterogeneity in the receptor expression at primary and metastatic sites in approximately 20% of patients.[14,15] In these cases, a single biopsy may not be representative of the ER expression of the whole disease burden. 16-α-(18F)-Fluoro-17-′-Estradiol (18F-FES) is a radiolabeled ligand of the ER and has been investigated since 1988.[16] 18F-FES PET-CT has shown good correlation with ER expression.[17,18,19,20] 18F-FES PET-CT will not only instrumental in revealing ER expression heterogeneity but will also add specificity to the diagnosis. The aim of this prospective study is to compare the diagnostic strength of 18F-FES PET-CT in comparison to the existing standard 18F-FDG PET-CT and also to look for the impact of 18F-FES PET-CT in Indian female patient management. Recently, 18F-FES PET-CT has been presented as a diagnostic tool in breast cancer patients with a clinical dilemma;[21] however, we have not seen any study comparing the diagnostic strength of these two tracers. This paper details the utilization of 18F-FES for PET-CT studies at the clinical level for the first time in India.
Materials and Methods
Patients
Twelve female patients were prospectively included in the study between December 2014 and September 2015, and the protocol was approved by the Hospital Medical Ethical Committee. All patients provided written informed consent. Patients with pathologically proved breast cancer referred for staging, restaging, or treatment response evaluation were included in the study. The study does not include patients on tamoxifen or fulvestrant; however, patients on aromatase inhibitors were included in the study. Patients with Eastern Cooperative Oncology Group performance status ≤2 and off chemotherapy for at least 3 weeks were included. All eligible patients underwent 18F-FDG PET-CT and 18F-FES PET-CT in the Nuclear Medicine Department of Rajiv Gandhi Cancer Institute and Research Centre within 1 week interval time. Of the 12 patients, two patients had negative ER expression and the remaining ten patients were ER+.
Scan protocols
Standard 18F-FDG PET-CT protocol was used.[22] All patients were instructed for fasting for at least 4 h, preceded by a light meal and to maintain good hydration. After injecting 4–5 MBq/kg body weight of 18F-FDG intravenously, patients were rested for 1 h in a silent, dimly lit isolation room, and administered 1 L of plain water orally. The scan was performed on a dedicated full ring hybrid PET-CT system (Biograph TruePoint40 Siemens Healthcare with LSO crystal) with 2 min per bed position in three-dimensional mode starting from base of the skull to mid-thigh. A low dose CT scan (40 mAs and 120 kVp) was performed first for attenuation correction and anatomical localization in all patients.
18F-FES was procured from the Division of Cyclotron and Radiopharmaceutical Sciences, Institute of Nuclear Medicine and Allied Sciences, Delhi, India, in a ready to use vial. The synthesis of 18F-FES was performed with cyclic estradiol sulfate 3-O-methoxy-methyl-16′, 17′-epiestriol-O-cyclic sulfone as a precursor. Nucleophilic substitution using a disposable cassette system for GE TRACERlab™ MX-FDG was performed and the purification is carried out by solid phase extraction cartridges. 18F-FES was produced in 18.2 ± 3.0% no-carrier-added (specific activity 100–200 GBq/μmol). The chemical and radiochemical purity were >95% and >99%, respectively. Same preparation instructions and imaging protocol as for 18F-FDG PET-CT were used for 18F-FES PET-CT as well. Approximately, 200 MBq of 18F-FES was injected intravenously and then all patients have to wait for 1 h before scanning.
Image interpretation
Tumor 18F-FDG and 18F-FES uptake were analyzed by the nuclear medicine physician both visually and semi-quantitatively. For semi-quantitative analysis, maximum standardized uptake value (SUVmax) corrected by body weight (SUVmax) was calculated. In organs with extensive and uncountable lesions, an arbitratory maximum number of 10 lesions were taken for calculation. A lesion showing significant (more than adjacent background) uptake on visual analysis by two independent nuclear medicine physicians was taken as positive. SUVmax was calculated for both 18F-FDG and 18F-FES for biopsy-proven lesions sites. 18F-FES-positive lesion was taken as a true positive for disease and as a reference in case of indeterminate lesion on 18F-FDG PET-CT.
Statistical analysis
A number of lesions suspected for disease by 18F-FDG and 18F-FES were calculated out of a total number of lesions seen by either of them together and their sensitivities were calculated and compared with. Because liver lesions were not appreciable on 18F-FES scan due to high physiological uptake in liver, sensitivities were also calculated for lesions excluding liver lesions and compared with. For entire comparison, McNemar test was used. Incremental value of 18F- FES scan was also calculated by notifying the lesions exclusively seen on 18F-FES scan and by characterization of 18F-FDG-positive, indeterminate lesions. Spearman rank test was used to assess the correlation between ER expression and SUVmax on 18F-FDG- or 18F-FES-positive lesions. P value and P trend were also calculated between the level of ER expression and 18F-FDG or 18F-FES SUVmax using Kruskal–Wallis test and Jonckheere–Terpstra test, respectively.
Results
Patient's data are summarized in Table 1. No 18F-FES concentration was seen in the disease sites of ER-negative patients and was excluded from the final analysis. Ten ER+ patients with total 161 lesions were included in the final analysis with average age 56.6 years (range: 34–77 years, median: 55 years). Five patients were referred for staging while other five were for restaging. ER expression range was 15–100%.
Table 1.
Patient's demography and both 18F-fluorodeoxyglucose and 18F-fluoroestradiol positron emission tomography scan results
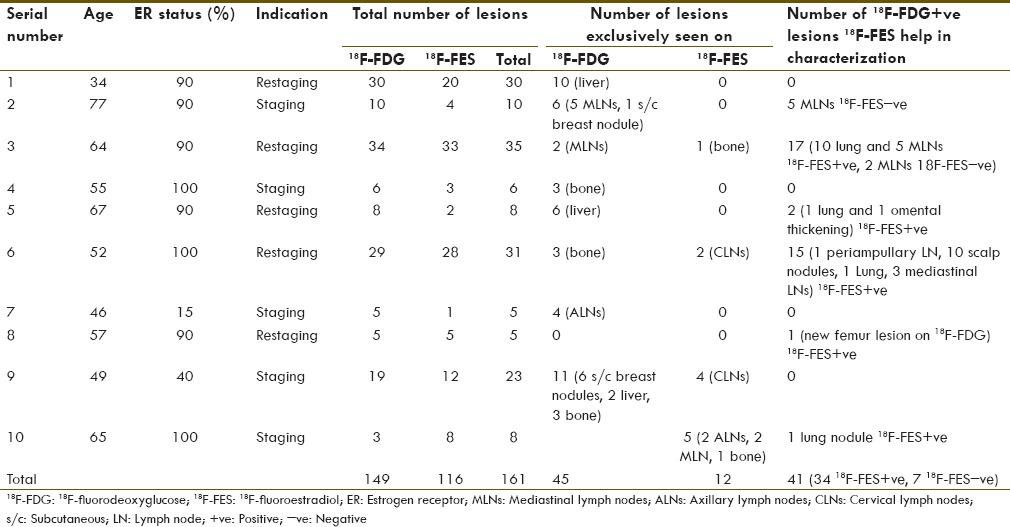
Of the 161 lesions, 7 18F-FDG-positive mediastinal lymph nodes (MLNs) were 18F-FES-negative and showed no change following treatment despite overall response in subsequent 18F-FDG PET, hence taken as false positive on 18F-FDG (4.7%). Of a total of 154 lesions considered as disease sites, 18F-FDG picked up 142 lesions (sensitivity 92.21%), whereas 18F-FES picked up 116 lesions (sensitivity 75.32%) and this difference in sensitivity was statistically significant [Table 2].
Table 2.
Comparing sensitivity of 18F-fluorodeoxyglucose and 18F-fluoroestradiol for suspected disease lesions

A known limitation of 18F-FES is very high physiological tracer uptake in liver (liver background SUVmax range: 12.5–18.7) due to its metabolism. Hence, most liver lesions appeared relatively cold on 18F-FES PET-CT scan, despite modest tracer uptake on SUVmax calculation (liver lesions SUVmax range: 3.3–7.0). In view of this physiological limitation of the 18F-FES scan, we decided to calculate the sensitivity of both the tracers for nonhepatic metastatic lesions. Out of a total of 136 nonhepatic metastatic lesions, 18F-FDG picked up 124 (sensitivity 91.18%) whereas 18F-FES picked up 116 (sensitivity 85.29%) lesions with no statistically significant difference between the two tracers [Table 3].
Table 3.
Comparing sensitivity of 18F-fluorodeoxyglucose and 18F-fluoroestradiol for only suspected nonhepatic disease lesions

It was also noticed that 18F-FES exclusively picked up 12 lesions not seen on 18F-FDG at the following sites: Axillary, cervical, and MLNs and bone [Table 1]. Forty-one 18F-FDG-positive lesions (27.5%) were either uncommon sites for involvement (n = 13) or common sites of inflammatory changes (n = 28: 13 lung lesions and 15 MLNs). Thirty-four of these lesions were 18F-FES-positive, hence helped in increasing the level of confidence for disease involvement. Overall, 18F-FES had an incremental value in 53 out of total 161 lesions (32.91%) either by being seen exclusively on the 18F-FES scan or by being able to characterize 18F-FDG-positive lesions (7 were 18F-FES-negative and 34 were 18F-FES-positive). 18F-FES PET-CT upstaged disease in one patient from nonmetastatic to the metastatic stage and in another patient due to fair 18F-FES uptake in all existing and single new metastatic sites, hormone treatment was continued. Hence, 18F-FES had an impact on patient management in two out of ten patients (20%).
We also analyzed the correlation between ER expression and SUVmax of 18F-FDG and 18F-FES lesions. In each patient, we had only one site of documented ER expression by IHC on biopsy sites. The possible correlation between the degree of ER expression and the corresponding SUVmax on 18F-FDG and 18F-FES was assessed on these ten lesions only [Table 4].
Table 4.
Estrogen receptor expression of the lesion and their 18F-fluorodeoxyglucose and 18F-fluoroestradiol maximum standardized uptake value
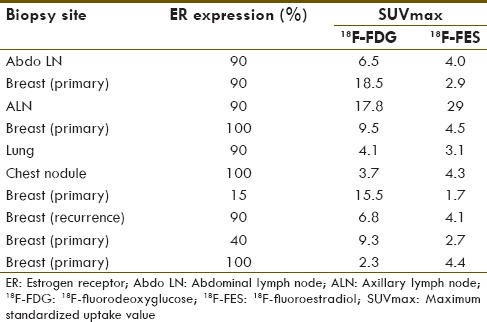
Spearman rank test was used to correlate ER expression and median SUVmax on 18F-FDG and 18F-FES [Table 5]. A positive correlation was found between ER expression and 18F-FES median SUVmax, while no correlation was seen with 18F-FDG median SUVmax.
Table 5.
Correlation of estrogen receptor expression with 18F-fluorodeoxyglucose and 18F-fluoroestradiol maximum standardized uptake value (number of subjects n=10)

P value and P trend were also calculated between the level of ER expression and 18F-FDG or 18F-FES SUVmax using Kruskal–Wallis test and Jonckheere–Terpstra test, respectively [Table 6 and Figure 1]. P value was not significant with the level of ER expression and 18F-FDG or 18F-FES SUVmax; however, a positive trend was seen with 18F-FES SUVmax and ER expression (P trend 0.011). Looking at the trend chart, negative trend of ER expression with 18F-FDG uptake was also appreciated (P trend 0.118).
Table 6.
Correlation with level of estrogen receptor expression and 18F-fluorodeoxyglucose and 18F-fluoroestradiol maximum standardized uptake value (P value and P trend)

Figure 1.
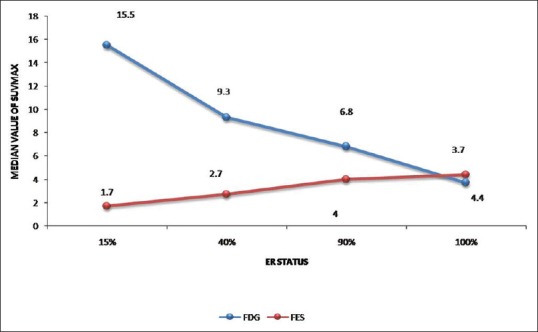
Trend chart of the level of estrogen receptor expression with 18F-fluorodeoxyglucose and 18F-fluoroestradiol median maximum standardized uptake value. A positive trend with fluoroestradiol and negative with fluorodeoxyglucose can be seen with estrogen receptor status
Discussion
This is the first study to evaluate the diagnostic strength and incremental value of 18F-FES PET-CT and compare it with 18F-FDG PET-CT. There is enough preclinical literature available to show good agreement with ER expression and 18F-FES uptake;[16,17,18,19,20] however, the use of FES imaging has not been explored much, especially in the clinical setting. Peterson et al. have compared 18F-FES uptake with ER expression assayed in vitro by IHC with both quantitative and semi-quantitative measures and showed good agreement between 18F-FES PET and ER expression.[18] Similarly, in our analysis, two ER-negative patients on IHC showed no significant 18F-FES uptake whereas the remaining ten ER+ patients showed 18F-FES positivity in a fair number of sites (75.32%).
On comparison of diagnostic sensitivities, 18F-FDG PET-CT showed more number of lesions then 18F-FES PET-CT for a total number of disease sites; however, 41 18F-FDG-positive lesions were doubtful and 28 of these suspicious lesions were in the thorax (13 lung lesions and 15 MLNs). False positivity in inflammatory conditions is a known limitation of 18F-FDG PET-CT scan; hence, characterization of lung lesions and MLNs on 18F-FDG alone is not easy. 18F-FES scan helped in the characterization of these lesions to a great extent. 18F-FES PET-CT was positive in eight while negative in seven in these MLNs. In all 13 lung lesions, 18F-FES scan was positive [Figure 2] which is remarkable finding from a clinical management point.
Figure 2.
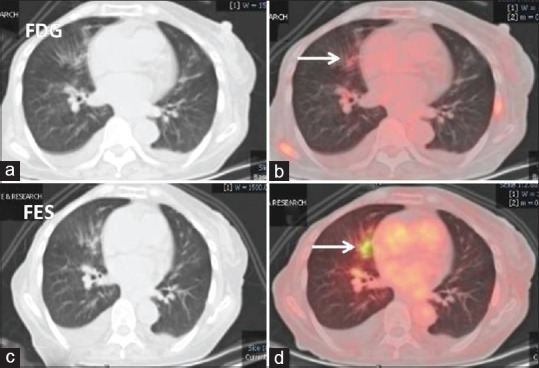
Lung window computed tomography and fused 18F-fluorodeoxyglucose (a and b) and 18F-fluoroestradiol (c and d) positron emission tomography-computed tomography axial images: 18F-fluorodeoxyglucose avid prominent bronchial markings with peribronchial infiltrates in the right middle lobe which shows good 18F-fluoroestradiol uptake (white arrows). Findings favor lymphangitis carcinomatosis
It has been reported that breast carcinoma metastasis is the most common carcinoma encountered by the dermatologist and presents in various forms.[23] Scalp nodules in patient number 6 (ER 100%) were one of the clinical findings and thought to be either multiple furunculosis or metastatic. The scalp nodules were 18F-FDG-positive but this did not solve the problem. Good tracer uptake on 18F-FES PET-CT helped in the characterization of the nature of the scalp nodules as metastatic [Figure 3]. In the same patient, the mass in the periampullary region causing common bile duct obstruction was also seen on 18F-FDG PET-CT, which definitely required characterization as either metastatic or second primary. Being an uncommon site of metastasis and obstructive in nature, endoscopy was advised, which was refused by the patient. 18F-FES PET-CT scan was most helpful in solving this issue. 18F-FES uptake in periampullary mass has simulated breast origin in this setting [Figure 4].
Figure 3.
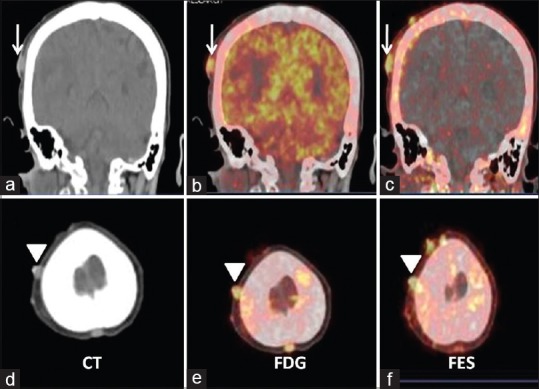
Coronal and axial computed tomography (a and d), fused 18F-fluorodeoxyglucose (b and e), and fused 18F-fluoroestradiol (c and f) positron emission tomography-computed tomography images. Images show multiple scalp nodules with good 18F-fluorodeoxyglucose and 18F-fluoroestradiol uptake. Findings suggest estrogen receptor expressing scalp metastases
Figure 4.
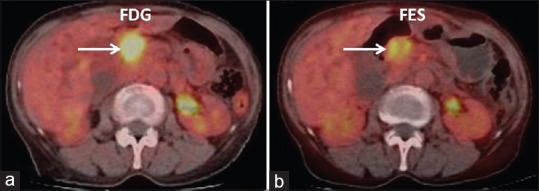
Fused axial 18F-fluorodeoxyglucose (a) and 18F-fluoroestradiol (b) positron emission tomography-computed tomography images showing periampullary lesion (arrow) with intrahepatic biliary dilatation. Findings suggest estrogen receptor expressing periampullary lesion likely breast metastasis in this case
Beside characterization of FDG-positive indeterminate lesions, 18F-FES PET-CT also showed 12 exclusive lesions. Patient number 10 referred for staging (ER 100%), 18F-FES PET-CT showed 5 extra lesions not seen on 18F-FDG (2 axillary LNs, 2 MLNs and one solitary bone lesion in the sacrum), thus upstaged the disease to Stage IV [Figure 5] hence impacted management. In another known case of bone-only metastasis that was on anastrozole, 18F-FDG PET-CT showed a new lesion in the right femur bone. 18F-FES PET-CT scan showed good tracer uptake in the all known and new metastatic sites; hence, hormone treatment (aromasin) was considered.
Figure 5.
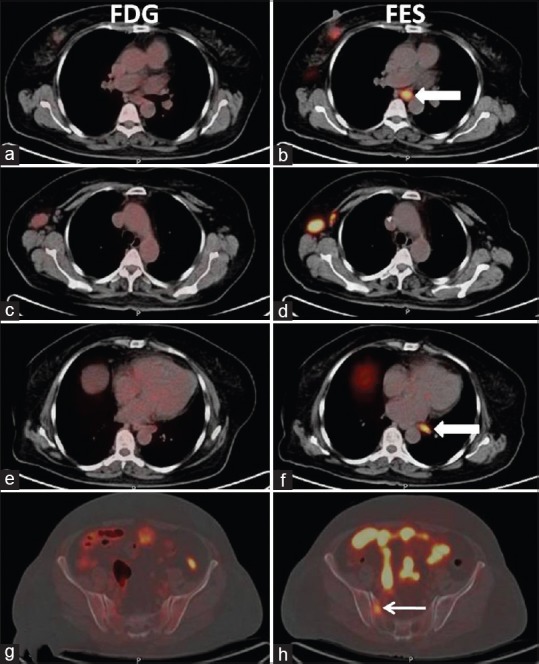
Axial fused 18F-fluorodeoxyglucose (a, c, e, and g) and fused 18F-fluoroestradiol (b, d, f, and h) positron emission tomography-computed tomography images. Images show strongly 18F-fluoroestradiol-positive disease sites. Two mediastinal lymph nodes (white block arrow, image b and f) and sacral lesion (white arrow, image h) were not appreciable on corresponding 18F-fluorodeoxyglucose images
The only shortcoming for 18F-FES PET-CT scan is in diagnosing liver lesions. Due to metabolism of 18F-FES in the liver, it showed very high physiological uptake. Indeed, a fasting status is much needed to downregulate the liver enzymatic activity to reduced background uptake. In our case, liver background tracer uptake was very high (SUVmax range: 12.5–18.7); hence, big lesions (>1 cm) appeared relatively cold and small lesions (<1 cm) were not appreciable. Despite these, SUVmax in large lesions was fair (SUVmax range: 3.3–7.0). Indeed, the issue of low sensitivity for liver metastasis for 18F-FES PET-CT is similar to brain lesions sensitivity for 18F-FDG PET-CT. In both situations physiological uptake limits the diagnostic strength. In view of this, we calculated the sensitivity of both tracers for nonhepatic metastatic sites, and there was no significant difference found (P = 0.216).
ER expression was available for one site in each patient; hence, ER expression correlation was done for ten sites only. In view of the very small number of the lesions, the median value of SUVmax was used for analysis. A positive correlation was found with 18F-FES SUVmax and ER expression (P = 0.009) while no correlation was seen with 18F-FDG SUVmax (P = 0.148). For assessing the change in ER expression and SUVmax of lesions on 18F-FDG and 18F-FES, a trend analysis was also done. A negative trend was noticed with increasing ER expression and SUVmax of 18F-FDG, however P trend was not significant (P trend 0.118). For 18F-FES SUVmax, a positive trend was noticed (P trend 0.011). Similar results were also showed by Dehdashti et al.[20] They found good overall agreement (88%) between in vitro ER assays and 18F-FES PET, however was unable to demonstrate any significant relationship between tumor 18F-FDG uptake and ER status or between tumor 18F-FDG and tumor 18F-FES uptake.
The main limitation of this study is the small number of the patients and the nonavailability of histopathology at most sites. 18F-FES PET-CT uptake was considered to be reference in controversial position with 18F-FDG PET-CT. To do biopsy from all metastatic sites is neither possible nor ethically acceptable. 18F-FDG-positive and 18F-FES-negative MLNs have been taken as false positive however there might be a situation of nonexpression of ER receptor in these LNs (intra-patient heterogeneity). On follow-up 18F-FDG PET-CT studies, these MLNs remain unchanged though other sites responded. Other 18F-FDG-positive and 18F-FES-negative lesions sites were taken as true positive either because common site of disease involvement or by agreement of two evaluators.
Conclusion
We are highlighting the role of 18F-FES PET-CT in comparison to 18F-FDG PET-CT. 18F-FDG has overall better sensitivity than 18F-FES PET-CT; however for nonhepatic metastatic disease sites, no statistically significant difference was found. 18F-FES PET-CT showed incremental value in characterizing 27.5% of 18F-FDG-positive lesions and also showed 7.4% exclusive lesions. With this, it has impacted 20% patient's management. We conclude that 18F-FES PET-CT can be used along with 18F-FDG PET-CT in strongly ER expressing patients for better specificity, evaluation of disease extent, and impact on treatment.
Financial support and sponsorship
Nil.
Conflicts of interest
There are no conflicts of interest.
References
- 1.D'Souza ND, Murthy NS, Aras RY. Projection of cancer incident cases for India-till 2026. Asian Pac J Cancer Prev. 2013;14:4379–86. [PubMed] [Google Scholar]
- 2.Rosen EL, Eubank WB, Mankoff DA. 18F-FDG PET, PET/CT, and breast cancer imaging. Radiographics. 2007;27(Suppl 1):S215–29. doi: 10.1148/rg.27si075517. [DOI] [PubMed] [Google Scholar]
- 3.Groheux D, Espié M, Giacchetti S, Hindié E. Performance of 18F-FDG PET/CT in the clinical management of breast cancer. Radiology. 2013;266:388–405. doi: 10.1148/radiol.12110853. [DOI] [PubMed] [Google Scholar]
- 4.Manohar K, Mittal BR, Senthil R, Kashyap R, Bhattacharya A, Singh G. Clinical utility of F-18 18F-FDG PET/CT in recurrent breast carcinoma. Nucl Med Commun. 2012;33:591–6. doi: 10.1097/MNM.0b013e3283516716. [DOI] [PubMed] [Google Scholar]
- 5.Eubank WB. Diagnosis of recurrent and metastatic disease using f-18 fluorodeoxyglucose-positron emission tomography in breast cancer. Radiol Clin North Am. 2007;45:659–67, vi. doi: 10.1016/j.rcl.2007.05.005. [DOI] [PubMed] [Google Scholar]
- 6.Isasi CR, Moadel RM, Blaufox MD. A meta-analysis of 18F-FDG-PET for the evaluation of breast cancer recurrence and metastases. Breast Cancer Res Treat. 2005;90:105–12. doi: 10.1007/s10549-004-3291-7. [DOI] [PubMed] [Google Scholar]
- 7.Warburg O, Posener K, Negelein E. The metabolism of cancer cells. Biochem Z. 1924;152:129–69. [Google Scholar]
- 8.Maschauer S, Prante O, Hoffmann M, Deichen JT, Kuwert T. Characterization of 18F-18F-FDG uptake in human endothelial cells in vitro. J Nucl Med. 2004;45:455–60. [PubMed] [Google Scholar]
- 9.Ishimori T, Saga T, Mamede M, Kobayashi H, Higashi T, Nakamoto Y. Increased 18F-18F-FDG uptake in a model of inflammation: Concanavalin A-mediated lymphocyte activation. J Nucl Med. 2002;43:658–63. [PubMed] [Google Scholar]
- 10.Glaudemans AW, de Vries EF, Galli F, Dierckx RA, Slart RH, Signore A. The use of (18)F-FDG-PET/CT for diagnosis and treatment monitoring of inflammatory and infectious diseases. Clin Dev Immunol. 2013;2013:623036. doi: 10.1155/2013/623036. [DOI] [PMC free article] [PubMed] [Google Scholar]
- 11.Timea T, Kornelia K, Laszlo T, Lengyel Z, Györke T, Habil MD, et al. PET-CT imaging in breast cancer patients: New tracers, future directions. J Mol Imaging Dyn. 2013;2:2–6. [Google Scholar]
- 12.Blamey RW, Hornmark-Stenstam B, Ball G, Blichert-Toft M, Cataliotti L, Fourquet A, et al. ONCOPOOL – A European database for 16,944 cases of breast cancer. Eur J Cancer. 2010;46:56–71. doi: 10.1016/j.ejca.2009.09.009. [DOI] [PubMed] [Google Scholar]
- 13.Allred DC, Harvey JM, Berardo M, Clark GM. Prognostic and predictive factors in breast cancer by immunohistochemical analysis. Mod Pathol. 1998;11:155–68. [PubMed] [Google Scholar]
- 14.Allred DC, Bustamante MA, Daniel CO, Gaskill HV, Cruz AB., Jr Immunocytochemical analysis of estrogen receptors in human breast carcinomas. Evaluation of 130 cases and review of the literature regarding concordance with biochemical assay and clinical relevance. Arch Surg. 1990;125:107–13. doi: 10.1001/archsurg.1990.01410130113018. [DOI] [PubMed] [Google Scholar]
- 15.Aurilio G, Disalvatore D, Pruneri G, Bagnardi V, Viale G, Curigliano G, et al. A meta-analysis of oestrogen receptor, progesterone receptor and human epidermal growth factor receptor 2 discordance between primary breast cancer and metastases. Eur J Cancer. 2014;50:277–89. doi: 10.1016/j.ejca.2013.10.004. [DOI] [PubMed] [Google Scholar]
- 16.Mintun MA, Welch MJ, Siegel BA, Mathias CJ, Brodack JW, McGuire AH, et al. Breast cancer: PET imaging of estrogen receptors. Radiology. 1988;169:45–8. doi: 10.1148/radiology.169.1.3262228. [DOI] [PubMed] [Google Scholar]
- 17.McGuire AH, Dehdashti F, Siegel BA, Lyss AP, Brodack JW, Mathias CJ, et al. Positron tomographic assessment of 16 alpha-[18F] fluoro-17 beta-estradiol uptake in metastatic breast carcinoma. J Nucl Med. 1991;32:1526–31. [PubMed] [Google Scholar]
- 18.Peterson LM, Mankoff DA, Lawton T, Yagle K, Schubert EK, Stekhova S, et al. Quantitative imaging of estrogen receptor expression in breast cancer with PET and 18F-fluoroestradiol. J Nucl Med. 2008;49:367–74. doi: 10.2967/jnumed.107.047506. [DOI] [PubMed] [Google Scholar]
- 19.Mortimer JE, Dehdashti F, Siegel BA, Katzenellenbogen JA, Fracasso P, Welch MJ. Positron emission tomography with 2-[18F]Fluoro-2-deoxy-D-glucose and 16alpha-[18F] fluoro-17beta-estradiol in breast cancer: Correlation with estrogen receptor status and response to systemic therapy. Clin Cancer Res. 1996;2:933–9. [PubMed] [Google Scholar]
- 20.Dehdashti F, Mortimer JE, Siegel BA, Griffeth LK, Bonasera TJ, Fusselman MJ, et al. Positron tomographic assessment of estrogen receptors in breast cancer: Comparison with 18F-FDG-PET and in vitro receptor assays. J Nucl Med. 1995;36:1766–74. [PubMed] [Google Scholar]
- 21.van Kruchten M, Glaudemans AW, de Vries EF, Beets-Tan RG, Schröder CP, Dierckx RA, et al. PET imaging of estrogen receptors as a diagnostic tool for breast cancer patients presenting with a clinical dilemma. J Nucl Med. 2012;53:182–90. doi: 10.2967/jnumed.111.092734. [DOI] [PubMed] [Google Scholar]
- 22.Boellaard R, Delgado-Bolton R, Oyen WJ, Giammarile F, Tatsch K, Eschner W, et al. 18F-FDG PET/CT: EANM procedure guidelines for tumour imaging: Version 2.0. Eur J Nucl Med Mol Imaging. 2015;42:328–54. doi: 10.1007/s00259-014-2961-x. [DOI] [PMC free article] [PubMed] [Google Scholar]
- 23.Prabhu S, Pai SB, Handattu S, Kudur MH, Vasanth V. Cutaneous metastases from carcinoma breast: The common and the rare. Indian J Dermatol Venereol Leprol. 2009;75:499–502. doi: 10.4103/0378-6323.55395. [DOI] [PubMed] [Google Scholar]


