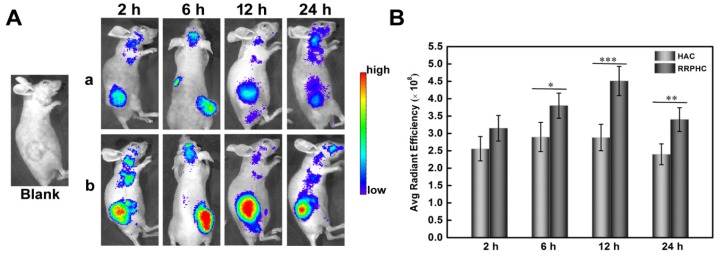
Figure 10.
(A) In vivo fluorescence imaging of the HCT 116 tumor-bearing nude mice at 2, 6, 12, and 24 h after intravenous injection of HAC/pDNA (HAC) and RRPHC/pDNA (RRPHC). The pDNA was labeled with TOTO-3. (B) Region-of-interest analysis of fluorescent signals from the tumors. *p < 0.05, **p < 0.01 and ***p < 0.001.

