

Abstract
An optical frequency comb generated with an electro-optic phase modulator and a chirped radiofrequency waveform is used to perform pump-probe spectroscopy on the D1 and D2 transitions of atomic potassium at 770.1 nm and 766.7 nm, respectively. With a comb tooth spacing of 200 kHz and an optical bandwidth of 2 GHz the hyperfine transitions can be simultaneously observed. Interferograms are recorded in as little as 5 μs (a timescale corresponding to the inverse of the comb tooth spacing). Importantly, the sub-Doppler features can be measured as long as the laser carrier frequency lies within the Doppler profile, thus removing the need for slow scanning or a priori knowledge of the frequencies of the sub-Doppler features. Sub-Doppler optical frequency comb spectroscopy has the potential to dramatically reduce acquisition times and allow for rapid and accurate assignment of complex molecular and atomic spectra which are presently intractable.
PACS Numbers: 42.62.Fi (Laser spectroscopy); 07.60.Rd (Fine and hyperfine structure); 32.10.Fn (Visible and ultraviolet spectrometers); 42.60.Fc (Modulation, tuning, and mode locking)
Sub-Doppler spectroscopy has been shown to be a powerful tool for optical frequency metrology [1–3], observing fundamental quantum light-matter interactions [4], assigning complex and blended spectra [5, 6], and laser frequency stabilization [7–9]. While reducing the widths of spectral features from their broad Doppler profiles down to or below their natural linewidths is immensely powerful, the ultra-narrow widths of the resulting features often result in long acquisition times where broad spectral regions must be slowly scanned with small frequency steps. The process becomes even more challenging when the nominal transition frequencies are not known a priori, as in the case of blended or multicomponent spectra.
A multiplexed approach for the acquisition of sub-Doppler spectra could lead to many-orders-of-magnitude reduction in acquisition time as well as allowing for applications to presently intractable problems such as sub-Doppler spectroscopy of the dense spectra of hydrocarbons or other large non-rigid molecules. While mode-locked optical frequency combs present a powerful platform for multiplexed Doppler-broadened spectroscopy [10, 11], their wide comb spacing (generally between 100 MHz and 1 GHz) is far too large to interrogate sub-Doppler features without a slow dither of the repetition rate [12]. More recently an external phase modulator has been used to reduce the comb mode spacing of a mode-locked laser comb [13]. Here we present an alternate approach in which a narrowly spaced optical frequency comb is generated through the use of an electro-optic phase modulator (EOM) [14–16] driven by a frequency chirped waveform from an arbitrary waveform generator (AWG). This frequency comb is used in a self-heterodyne configuration [17, 18] to simultaneously record saturation and optical pumping hyperfine transitions of 39K with interferograms as short as 5 μs.
A schematic of the sub-Doppler direct frequency comb spectrometer can be found in Fig. 1. The laser source was an external-cavity diode laser with a linewidth less than 100 kHz (at 1 ms) and a tuning range of 745 nm to 785 nm. The laser power was 6 mW following injection into the polarization-maintaining fiber and subsequent optical isolators. The laser frequency was actively stabilized through the use of a high precision wavelength meter which provided a maximum resolution of 0.5 MHz and a data acquisition rate up to of 400 Hz. A software-based proportional-integral-derivative servo was used to lock the laser frequency to a given set point by feeding back to the laser current and piezoelectric transducer with a bandwidth of 100 Hz.
FIG. 1.
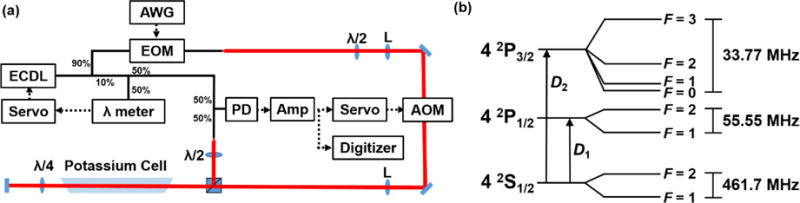
(a) Schematic of the sub-Doppler direct frequency comb spectrometer. Fiber-coupled optical paths are shown in solid black, free-space optical paths in red, and electronic signals with dashed black arrows. The abbreviated elements are an external-cavity diode laser (ECDL), an arbitrary waveform generator (AWG), an electro-optic phase modulator (EOM), lenses (L), an acousto-optic modulator (AOM), a photodiode (PD), and radiofrequency amplifiers (Amp). The ECDL frequency is locked to a high-resolution wavelength meter by feeding back to the laser’s current and piezoelectric transducer. The down-converted carrier frequency is phase-locked to an external radiofrequency reference, thus allowing for coherent self-heterodyne signal averaging. The AWG and all other microwave electronics were referenced to a 10 MHz signal from a commercial rubidium atomic clock. Details regarding the servo of the AOM frequency are given in Ref. [22]. (b) Energy level diagram for 39K showing the D1 and D2 electronic transitions at 770.1 nm and 766.7 nm, respectively [29, 31].
The optical frequency comb was generated through the use of a waveguide-based electro-optic phase modulator which was driven by an AWG with a sample rate of 10 GSamples/s. The electro-optic modulator had a response at greater than 20 GHz and Vπ = 2.6 V at 1 GHz. A train of linearly chirped waveforms was generated by the AWG which covered frequencies between 0.2 MHz and 1,000 MHz in 5 μs. Each waveform is given as a function of time by: , where A is a constant amplitude, f0 and f1 are the initial and final frequencies of the chirp, respectively, Δt is the chirp duration, and ϕ is a constant phase term. This led to a nearly power-leveled optical frequency comb with a spacing of 200 kHz which spanned 2 GHz in bandwidth. We note that the generation of such a narrowly spaced comb using a corresponding mode-locked laser would require a laser cavity on the order of 0.7 km in length. Further, the use of chirped waveforms gives rise to interferograms with nearly constant amplitude in the time domain, removing the need for extremely wide dynamic range when using mode-locked laser combs (due to the large center burst) as well as reduced quantum shot noise [19]. Importantly, chirped waveforms such as these (or alternatively pseudo-random bit sequences [17, 18]) can be generated without an expensive AWG using low-cost direct digital synthesis [20] or segmented approaches [21].
A free-space acousto-optic modulator (AOM) was used to shift the carrier frequency of the resulting self-heterodyne signal away from DC by utilizing the first-order output at 384.22 MHz. In order to facilitate coherent time-domain averaging of the self-heterodyne signal, this carrier frequency was phase-locked to an external frequency reference by actuating the voltage-controlled oscillator which provided the AOM radiofrequency drive signal [22]. This lock was performed through the use of a phase frequency detector whose output was then fed into a commercial loop filter (proportional-integral corner at 1 kHz). This approach has been previously shown to enable more than two hours of coherent, real-time averaging, thus allowing for far more efficient data management [22].
The free-space laser beam was then double-passed through a 46 cm Brewster-angled (for the incoming linearly-polarized beam) sealed glass cell containing atomic potassium metal at natural isotopic abundance (99.5 % purity). At a temperature of 296 K, this gives rise to a vapor pressure of 1.5 μPa [23]. Approximately 0.09 mW to 0.15 mW of total optical power (i.e., the sum of all of the comb teeth and the carrier) was injected into the cell, corresponding to a laser intensity of 14 mW/cm2 to 27 mW/cm2. Polarization optics were then employed to separate the return beam and inject it into a polarization-maintaining fiber. Once in fiber this beam was combined with a fiber-coupled portion of the initial single-frequency laser output which served as a local oscillator.
The resulting self-heterodyne signal (see Fig. 2) was then observed via a fiber-coupled photodetector with a power bandwidth (3 dB) of 1 GHz, a conversion gain of 360 V/W, and a noise-equivalent power of 31 pW/Hz1/2 (at 760 nm). This signal was amplified and split between a digitizer board for data acquisition and the phase-locking electronics. The 12-bit digitizer board coherently averaged 40 000 interferograms recorded in 100 μs segments at 3 GSamples/s (i.e., 200 ms of data acquisition). We note that this timescale was employed to clearly resolve the positive- and negative-order sidebands which are separated by 20 kHz in the aliased frequency-domain spectrum. Due to the high data volumes, the throughput rate was 0.06 %, although this likely could be improved by more sophisticated data processing protocols. Spectral normalization was performed through the use of spectra which were recorded at a frequency detuned from the region of interest by 3 GHz.
FIG. 2.
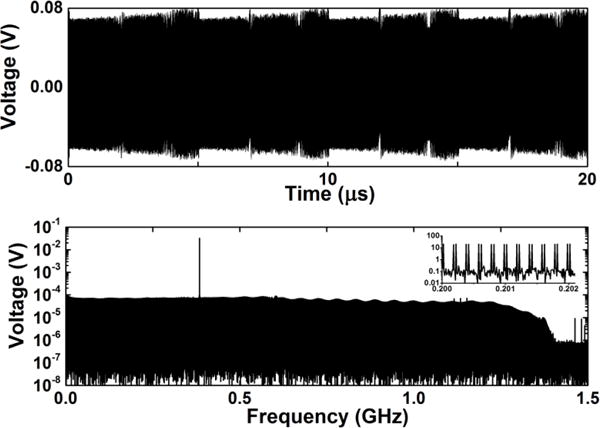
(Upper panel) A portion of the 100-μs-long time domain self-heterodyne optical signal after 2,000 coherent averages. The interferogram repeats every 5 μs. (Lower panel) The corresponding frequency domain spectrum after a Fourier transform of the entire averaged optical heterodyne signal. The series of repeated time domain waveforms gives rise to an optical frequency comb. Ten thousand individual comb teeth are present with a spacing of 0.2 MHz (i.e., the inverse of the waveform duration). The lower optical frequency teeth are wrapped about DC. The carrier (i.e., acousto-optic modulator frequency) can be seen at 0.38422 GHz.
Representative self-heterodyne absorption spectra of 39K can be found in Fig. 3. As the majority of the optical power is found at the optical carrier frequency (ν0), this tone acts as a pump in our pump-probe saturation spectroscopy measurements. Six distinct sets of sub-Doppler features are superimposed upon the Doppler profile. As expected, there is a large hole burning (HB) feature at the optical frequency, ν0, of the strong carrier tone. In addition, there are two sets of peaks present at ν0 ± 462 MHz which arise from hyperfine pumping (HP) [24, 25] of the 4 2S1/2 ground state hyperfine levels through the upper state. Importantly, measurements of the frequencies of these HP peaks at ν0 ± 462 MHz relative to ν0 provides for a multiplexed measurement of the lower-state hyperfine splitting without the need for an absolute frequency reference. In addition, the 4 2P1/2 hyperfine levels can be observed as a splitting of these features. Therefore, sub-Doppler spectroscopy with an optical frequency comb is capable of measuring both lower- and upper-state hyperfine splittings simultaneously with an uncertainty fundamentally limited by that of the radiofrequency comb generation signal and therefore traceable to the International System of Units (SI).
FIG. 3.

Sub-Doppler spectra of the 39K D1 and D2 lines. Two thousand 100 μs long time domain optical self-heterodyne signals were coherently averaged, followed by subsequent averaging of 40 and 22 normalized spectra, respectively. Counter-propagating features are labelled with their assignments, while co-propagating features are labelled as hole burning (HB) and hyperfine pumping (HP). For reference, the calculated Doppler-broadened envelope is shown with the dashed line. Electromagnetically induced transparency (EIT) can be seen in the central HP features of the D1 line (see also Fig. 4). Third-order and linear baselines were subtracted from the D1 and D2 spectra, respectively.
In addition to the above features we can also observe electromagnetically induced transparency (EIT) resonances [26–28] in the central HP peaks (see Fig. 4). These ultranarrow resonances have full-widths at half maximum of a few MHz making it possible to measure the ground state splitting with a precision at the tens-of-kHz level. We note that to first order the EIT resonances are independent of laser linewidth due to the common-mode nature of this self-heterodyne measurement [28]. The addition of magnetic-interference-shielding nickel-iron-cobalt foil was observed to reduce the width of these features by a further factor of approximately two through a reduction in Zeeman splitting due to stray magnetic fields. High-precision fits of the HP and EIT resonances repeated over several days in combination with a conservative estimate of potential systematic sources of uncertainty (e.g., dynamic Stark effect and Zeeman effect) yields values for the lower- and upper-state hyperfine splittings for the D1 transition of Δ″ = 461.83(41) MHz and Δ′ = 55.04(41) MHz, respectively with the corresponding combined standard uncertainties.
FIG. 4.

A portion of the absorption and phase spectra for the 39K D1 line. The absorption spectrum is a subset of the spectrum shown in Fig. 3. Two thousand 100 μs long time domain self-heterodyne optical signals were coherently averaged, followed by subsequent averaging of 40 spectra. In addition to the hyperfine pumping (HP) peaks there is clear evidence of electromagnetically induced transparency (EIT). A small number of points near 389 285 850 MHz were removed from the shown figure as these points occur near to DC in the optical heterodyne signal. A third-order linear baseline was subtracted from the absorption spectrum. We note that the self-heterodyne approach inherently leads to common-phase noise rejection.
The sub-Doppler features so far described do not require counter-propagating beams as they are simply a result of strong optical pumping. Absolute transition frequencies of the hyperfine transitions [29] can be determined using the remaining three sets of saturation features which occur because of the counter-propagating beams (and are labelled with their corresponding assignments in Fig. 3). In this case, for a given optical carrier frequency, ν0, there exists a velocity class with a Doppler-shifted optical frequency of ν0 = νm + Δνd where νm is the resting frequency of a given hyperfine transition and Δνd = − νm(k·vb)/(2π) is the Doppler shift, in which k is the laser wave vector and vb is the velocity class vector. The saturation of this velocity class is then observed by the counter-propagating optical frequency comb with wave vector k of opposite sign at νobs = νm − νd = 2νm − ν0. As a result, in Fig. 3 we can observe sub-Doppler features resulting from transitions originating in each of the two hyperfine levels of the ground state as well as the cross-over resonances. We note that high-accuracy absolute frequencies could readily be measured by recording the beat frequency between the external-cavity diode laser and an absolute optical frequency reference. In addition, for high-resolution applications in chemical dynamics where the upper and lower state splittings are the desired quantities, absolute transition frequencies may not be required.
The comb-based approach we have demonstrated herein offers significant advantages over traditional single-frequency approaches. First, it is inherently multiplexed and allows for each of the hyperfine transitions to be recorded and quantified simultaneously. In addition, neither detailed a priori knowledge of the hyperfine levels nor high-resolution scanning of the pump laser frequency are required. Critically, the saturation features are observable as long as the carrier frequency is within the Doppler envelope of the absorption features. This is particularly important for systems with blended transitions where the component frequencies are not presently well known (e.g., congested spectra such as CH4, the NO3 radical, or floppy molecules such as CH5+). AWGs with sampling rates as high as 92 GSamples/s are commercially available, which when paired with commercial high-bandwidth phase modulators could further broaden the optical bandwidth to >60 GHz. Further bandwidth enhancements could be achieved by imprinting the present electro-optic-phase-modulator-based frequency comb upon a mode-locked laser frequency comb [13]. Extension of the present approach to the mid-infrared region could be achieved using difference frequency generation [30] approaches and should allow for rapid, multiplexed sub-Doppler spectra on a variety of important molecular species.
Supplementary Material
Acknowledgments
Funding was provided by the National Institute of Standards and Technology (NIST) Greenhouse Gas Measurement and Climate Research Program. We also thank K. C. Cossel, J. R. Lawall, N. Newbury, J. N. Tan, and J. Unguris of NIST for loaned equipment.
References
- 1.Hänsch TW, Shahin IS, Schawlow AL. Phys Rev Lett. 1971;27:707. [Google Scholar]
- 2.Hänsch TW, Lee SA, Wallenstein R, Wieman C. Phys Rev Lett. 1975;34:307. [Google Scholar]
- 3.Hänsch TW. ChemPhysChem. 2006;7:1170. doi: 10.1002/cphc.200600195. [DOI] [PubMed] [Google Scholar]
- 4.Hall JL, Bordé CJ, Uehara K. Phys Rev Lett. 1976;37:1339. [Google Scholar]
- 5.Levenson MD, Schawlow AL. Phys Rev A. 1972;6:10. [Google Scholar]
- 6.Hall JL, Bordé C. Phys Rev Lett. 1973;30:1101. [Google Scholar]
- 7.Bennett WR. Phys Rev. 1962;126:580. [Google Scholar]
- 8.Lamb WE. Phys Rev. 1964;134:A1429. [Google Scholar]
- 9.Hall JL. Rev Mod Phys. 2006;78:1279. [Google Scholar]
- 10.Coddington I, Newbury N, Swann W. Optica. 2016;3:414. doi: 10.1364/optica.3.000414. [DOI] [PMC free article] [PubMed] [Google Scholar]
- 11.Masłowski P, Cossel KC, Foltynowicz A, Ye J. In: Cavity Enhanced Spectroscopy and Sensing. Gagliardi G, Loock H-P, editors. Springer; Verlag Berlin Heidelberg: 2014. [Google Scholar]
- 12.Heinecke DC, Bartels A, Fortier TM, Braje DA, Hollberg L, Diddams SA. Phys Rev A. 2009;80:053806. [Google Scholar]
- 13.Hébert NB, Michaud-Belleau V, Magnan-Saucier S, Deschênes J-D, Genest J. Opt Lett. 2016;41:2282. doi: 10.1364/OL.41.002282. [DOI] [PubMed] [Google Scholar]
- 14.Kourogi M, Nakagawa K, Ohtsu M. IEEE J Quantum Electron. 1993;29:2693. [Google Scholar]
- 15.Kourogi M, Enami T, Ohtsu M. IEEE Photonics Technol Lett. 1994;6:214. [Google Scholar]
- 16.Torres-Company V, Weiner AM. Laser Photon Rev. 2014;8:368. [Google Scholar]
- 17.Hébert NB, Michaud-Belleau V, Anstie JD, Deschênes JD, Luiten AN, Genest J. Opt Express. 2015;23:27806. doi: 10.1364/OE.23.027806. [DOI] [PubMed] [Google Scholar]
- 18.Bao Y, Yi X, Li Z, Chen Q, Li J, Fan X, Zhang X. Light Sci Appl. 2015;4:e300. [Google Scholar]
- 19.Deschênes J-D, Genest J. Opt Express. 2015;23:9295. doi: 10.1364/OE.23.009295. [DOI] [PubMed] [Google Scholar]
- 20.Finneran IA, Holland DB, Carroll PB, Blake GA. Rev Sci Instrum. 2013;84:083104. doi: 10.1063/1.4818137. [DOI] [PubMed] [Google Scholar]
- 21.Neill JL, Harris BJ, Steber AL, Douglass KO, Plusquellic DF, Pate BH. Opt Express. 2013;21:19743. doi: 10.1364/OE.21.019743. [DOI] [PubMed] [Google Scholar]
- 22.Fleisher AJ, Long DA, Reed ZD, Hodges JT, Plusquellic DF. Opt Express. 2016;24:10424. doi: 10.1364/OE.24.010424. [DOI] [PMC free article] [PubMed] [Google Scholar]
- 23.Shirinzadeh B, Wang CC. Appl Opt. 1983;22:3265. doi: 10.1364/ao.22.003265. [DOI] [PubMed] [Google Scholar]
- 24.Bender PL, Beaty EC, Chi AR. Phys Rev Lett. 1958;1:311. [Google Scholar]
- 25.Smith DA, Hughes IG. Am J Phys. 2004;72:631. [Google Scholar]
- 26.Boller KJ, Imamoğlu A, Harris SE. Phys Rev Lett. 1991;66:2593. doi: 10.1103/PhysRevLett.66.2593. [DOI] [PubMed] [Google Scholar]
- 27.Xiao M, Li YQ, Jin SZ, Gea-Banacloche J. Phys Rev Lett. 1995;74:666. doi: 10.1103/PhysRevLett.74.666. [DOI] [PubMed] [Google Scholar]
- 28.Fleischhauer M, Imamoglu A, Marangos JP. Rev Mod Phys. 2005;77:633. [Google Scholar]
- 29.Falke S, Tiemann E, Lisdat C, Schnatz H, Grosche G. Phys Rev A. 2006;74:032503. [Google Scholar]
- 30.Yan M, Luo P-L, Iwakuni K, Millot G, Hänsch TW, Picque N. arXiv:1608.08013. 2016 doi: 10.1038/lsa.2017.76. [DOI] [PMC free article] [PubMed] [Google Scholar]
- 31.Robichaud D, Hodges JT, Maslowski P, Yeung L, Okumura M, Miller CE, Brown LR. J Mol Spectrosc. 2008;251:27. [Google Scholar]
Associated Data
This section collects any data citations, data availability statements, or supplementary materials included in this article.