Abstract
Small-angle x-ray scatter imaging has a high intrinsic contrast in cancer research and other applications, and provides information on molecular composition and micro-structure of the tissue. In general, the implementations of small-angle coherent scatter imaging can be divided into two main categories: direct tomography and angular dispersive computerized tomography. Based on the recent development of energy-discriminative photon-counting detector array, here we propose a computerized tomography setup based on energy-dispersive measurement with a photon-counting detector array. To show merits of the energy-dispersive approach, we have performed numerical tests with a phantom containing various tissue types, in comparison with the existing imaging approaches. The results show that with an energy resolution of ~6 keV, the energy dispersive tomography system with a broadband tabletop x-ray would outperform the angular dispersive system, which makes the x-ray small-angle scatter tomography promising for high-specificity tissue imaging.
Keywords: photon counting detectors, coherent scattering, x-ray CT, dark-field
1. Introduction
Screening mammography, as the most common breast cancer screening method, displays low contrast in soft tissues, because the x-ray attenuation is mainly related to the electron density, which provides no specificity to molecular composition of the tissue. Secondary screening methods have other major issues; for example, histopathology requires tissue removal from a patient (Elshemey et al 2013), fixing, staining, and other labor intensive steps (Dahlstrom et al 1996). Small-angle x-ray scatter imaging produces scatter profiles closely correlated to the presence of malignancies in breast tissues (Fernández et al 2002, 2005, Cunha et al 2006, Oliveira et al 2008), without use of a contrast agent. The scatter peaks, arising mainly from the fibrous collagens (types I and III) that form the extracellular matrix (ECM) (Sidhu et al 2008), provide information on the fibril stacking period and collagen fiber alignment. The structural information in ECM can differentiate invasive carcinoma from benign lesions or healthy tissue. Notably, the scatter profiles can even differentiate between normal tissues with and without a cancer history, which are not detectable by conventional morphological markers (Sidhu et al 2009).
However, the aforementioned small angle-scatter signatures of tissues are measured with synchrotron sources. A high resolution imaging system with a tabletop x-ray source that can be used in the clinic would accelerate the adoption of x-ray scattering as a viable modality in practice (Sidhu et al 2011). X-ray phase imaging based on Talbot interferometry with a table-top source, for example, can calculate the transmission, phase contrast, and dark field imaging from the intereferogram (Pfeiffer et al 2006). The signal in the dark field imaging arises from small-angle scattering. Based on the phase imaging system, a recent study demonstrated a tensor based tomography method measuring the direction-dependent scattering, revealing the material structural information (Malecki et al 2014). In fact, before the development of the phase contrast imaging system, two types of coherent scattering tomography systems were designed to provide a 2D material map (Harding 1987, 2009, Schlomka et al 2003, Castoldi et al 2010, Cui et al 2010), which are referred to as direct tomography and coherent scatter computerized tomography (CSCT) respectively (figure 1). Synchrotron-based coherent scatter tomography was also demonstrated for thick tissue imaging (Kleuker et al 1998); however, due to the limitations in the detector, the tabletop implementations require filtered narrowband x-ray sources, which reduce the imaging performance.
Figure 1.
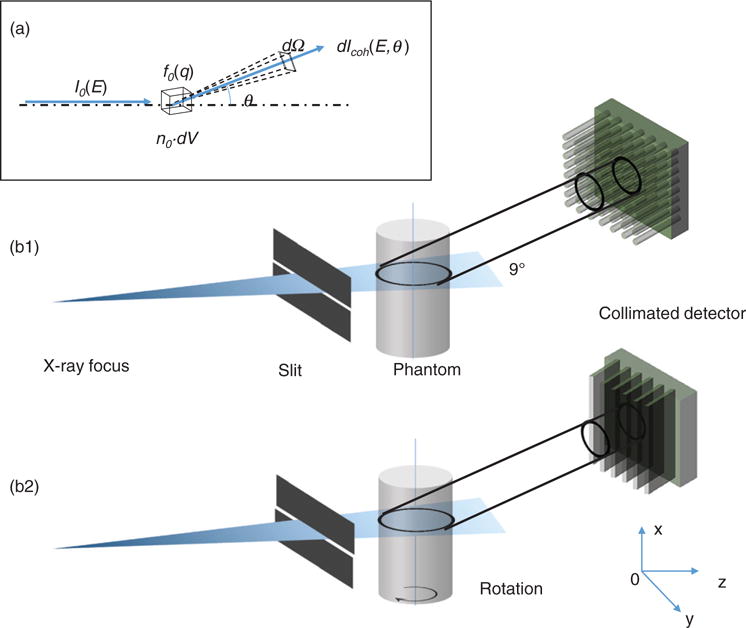
(a) Geometry of coherent scattering. (b) The schematics of coherent scatter imaging setups: direct tomography with polycapillary collimators (b1), and coherent scatter computerized tomography (CSCT) with collimation only in the horizontal direction (b2).
The energy-dispersive scatter computerized tomography concept was proposed and demonstrated only with a single pixel sensor (Delfs and Schlomka 2006). In this paper, we propose a CSCT approach using energy-discriminative photon-counting detector array. We report the simulation results and performance comparisons against competing imaging methods. It is found that the performance of an energy dispersive system using a broadband tabletop x-ray tube could achieve image resolution comparable to or better than that of the angular dispersive coherent scatter imaging system. The improved source efficiency could make the x-ray small-angle scatter tomography a powerful tool for high-specificity tissue imaging.
2. Theory
2.1. Coherent scattering
To simplify the discussion, we assume the x-ray tube focus is far from the sample, and the illumination thus can be treated as being in a parallel beam geometry. The scatter photon count, dIcoh(E), from a scatter voxel dV at scattering angle θ is:
| (1) |
where I0(E) is the incident x-ray photon number per cm2, n0 is the number of scatters per cm3, and dσcoh/dΩ is the differential cross-section of coherent scattering, which has a unit of cm−2 per steradian. Total scatter cross-section is composed of coherent and incoherent scatter cross-section, i.e. . In the small angle regime, the coherent scattering is the dominant component so that we can ignore the incoherent scattering component. The differential cross-section of coherent scattering can be expressed as:
| (2) |
where re is the is the classical electron radius, θ is the scatter angle, f0(q,r) is the coherent scatter form factor at location r = (x, y, z), and q is the momentum transfer. According to the Bragg’s Law:
| (3) |
where h is the Planck constant, and c is the speed of light. The product of the scatter density and the form factor, f(q,r) = n0(r)f0(q,r), is what we call the object function and want to reconstruct. The geometry is shown in figure 1(a). The profile of the object function indicates the type of the material and the amplitude indicates the density. Combining equations (1)–(3), the detected scatter irradiance on the detector located at rd = (xd, yd, zd) is
| (4) |
where Ω is the collection solid angle covered by the detector.
2.2. Direct tomography
Equation (4) shows that given the energy of the x-ray photon, each detector pixel collects the scatter photons from every object voxel at a particular scatter angle. A simple means to distinguish the scatter photons from different voxels is the use of a collimator. Figure 1(b1) shows the system setup, where each detector pixel only receives collimated photons from a small object volume. The system is termed as direct tomography.
Specifically, a 2D detector array with capillary collimators is angled by θ. The collection cone of each detector pixel has an intersection area with the illumination plane. Let Ω be the collection solid angle of the detector. The direction cosine of the normal direction of the detector pixel is p = (a, b, c), where a2 + b2 + c2 = 1. Since the incident beam is parallel, the scattered ray vector is rsc = (x′ − x, y′ − y, z′ − z). The angular cosine between the scatter ray and the normal direction of detector is . The collimator, limiting the acceptance angle, can be modeled as a rectangle function of γ.
| (5) |
where β is the angular range of polycapillary tubes, which is around 1 mrad (Cui et al 2010). Combining equations (4) and (5), the collected scatter photon counts at energy E is:
| (6) |
where K(r, rd) is the blur kernel, which can be expressed as:
| (7) |
where r′ is the convolution variable in the detector coordinates, and Δ is the pixel size of the detector. Equation (7) shows that given a detector to voxel distance, the larger the angular range β, the broader the blur kernel.
Next, considering the energy response of the system, S(E,E′), which is the convolution of the spectral response of the detector and the spectrum of the source, we have
| (8) |
where E′ is the convolution variable in the energy domain. For an ideal energy integrating detector array and monochromatic source centered at E0, the energy convolution kernel can be treated as a Dirac-delta function. Then, the measurement can be simplified as
| (9) |
Equation (9) shows that we can measure the form factor f at various momentum transfer q by either changing the source energy E0 or scatter angle θ (Harding 1990, Cui et al 2010).
2.3. Angular dispersive coherent scatter computerized tomography (AD-CSCT)
The use of polycapillary collimators would directly localize sources of scatter signals, unfortunately, at the expense of the collection efficiency. Also, due to the small scatter angle θ, the resolution along the beam illumination direction is lower than that along the perpendicular direction.
By rotating the sample in the illumination plane (see figure 1(b2)) and performing reconstruction similar to transmission computerized tomography, an improved resolution can be achieved along the illumination direction. This method is termed as coherent scatter computerized tomography (CSCT) (Harding 1987, Batchelar and Cunningham 2002, Batchelar et al 2006). More importantly, CSCT has a larger collection solid angle with a collection efficiency much higher than that of the direct tomography setup. The detectors in CSCT setup only needs the collimation in horizontal direction and collects scatter photons from all voxels along the illumination direction. The setup using a 2D energy integrating detector array was described in (Schlomka et al 2003).
The cross section view of the detection geometry is shown in figure 2(a1). In this setup, the energy integrating detector rows are placed at a distance, w, away from the illumination plane and only receive the scatter photons. At each projection angle, the measurement is a 2D dataset (yd along the detector row and w along the vertical direction). Similar to transmission CT, a sequence of 2D projections are measured while the object is being rotated.
Figure 2.
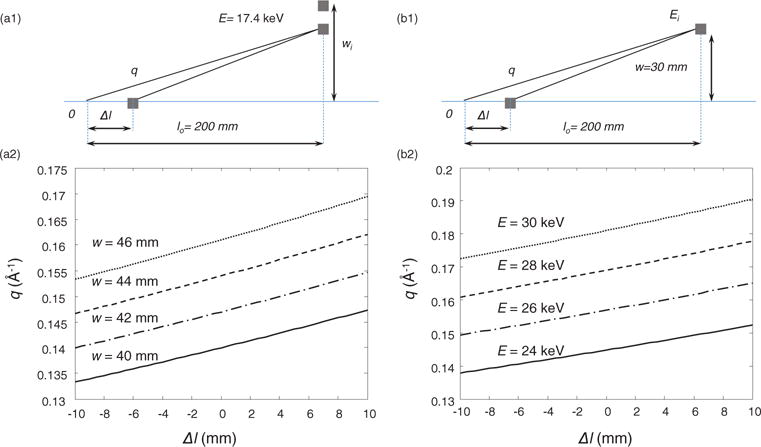
(a) Angular dispersive measurement geometry: side view of AD-CSCT geometry (a1); each row of the detection at different w is a line integration along a section of a hyperbolic curve in q−Δl space (a2). (b) Energy dispersive measurement geometry: side view of ED-CSCT geometry (b1); the detection for each energy channel is also a line integration along a specific hyperbolic curve in q−l space (b2).
Assuming the object dimension, Δl, is much smaller than the distance from the object to the detector, l0, (e.g. Δl/l0 < 0.05), and the scatter angle is in the small angle regime (i.e. , and ), we can simplify the forward model. The scatter angle change, Δθ, due to the small displacement of the scatter point from the object center, Δl, can be approximated as . Since the detector is tilted so that it is perpendicular to the scatter ray from the center of the object, and . Because the detector pixel size, Δ, is much smaller than the distance l, we can assume the irradiance is uniform at each pixel. Since no collimation in the horizontal direction, t(γ) = 1. As a result, the spatial convolution kernel in equation(7) can be simplified to
| (10) |
Since Δl/l0 and θ0 are small, we can drop the second term in equation (10), which is only ~0.2% of the first term. Plugging the first term of equation (10) to equation (6), we have
| (11) |
Similar to equations (9) and (11) assumes monochromatic source has an ideal energy profile centered at E0. The projection transform described in equation (11) can be treated as a line integration on the q−Δl plane along the family of curves:
| (12) |
with w as the parameter, shown in figure 2(a2). The 3D tomography reconstruction can be carried out similar to the case of attenuation CT. The back projection is from the measurement domain of (w, yd, ϕ) to the object domain of (x, y, q), where ϕ is the rotation angle.
2.4. Energy dispersive coherent scatter computerized tomography (ED-CSCT)
Energy dispersive coherent scatter computerized tomography (ED-CSCT) employs a broadband source without the need for filtration, and thus can improve the x-ray source efficiency by orders of magnitude. The momentum transfer resolution relies on the energy resolution of the system. In AD-CSCT, the normalized energy resolution is the ratio between the peak-width and the peak of the characteristic line of the source, which is on the order of 10%. Until recently, the normalized energy resolution of array detectors, σE/E, was worse than 10% (Harding 1987). In addition, the energy-discriminative detector usually has a larger pixel size than energy integrating detector, resulting in an inferior resolution (Delfs and Schlomka 2006). The recently advancement of CdTe/CZT photon counting detector array has improved the energy resolution to less than 6 keV for hard x-ray, with the detector pixel size as small as 55 × 55 μm2 (Medipix3 array detector 2014). The application of such detectors in ED-CSCT could improve the system resolution, while providing a faster acquisition time than AD-CSCT system.
In AD-CSCT energy-integrating detector array measures the single energy scattering at different scatter angle at corresponding vertical offset, w, while each detector row in ED-CSCT measures the broadband scatter photons in corresponding energy channels. As a result, the measurement dataset is in the domain of (E, yd, ϕ), rather than (w, yd, ϕ). The system geometry is similar to that of the AD-CSCT, and the projection onto a particular energy channel centered at Ei is also carried out on the q−Δl plane along the curve described by equation (12), but with energy E as the parameter this time, as shown in figure 2(b).
Here we assume the spectrum of the detector has a Gaussian function centered at E, with energy deviation of σE. Then the energy convolution kernel can be expressed as
| (13) |
For the energy channel centered at Ei, the measurement is
| (14) |
3. Simulation setups
In order to compare the resolution and collection efficiency among the aforementioned setups, we have constructed a forward model for the coherent scatter tomography systems based on ray tracing. For direct tomography, we perform simulation with the filtered narrowband x-ray tubes of two anode materials: (1) copper (Cu) anode with 0.02 mm nickel filtration and a peak voltage of 25 KV, and (2) silver (Ag) anode with 0.03 mm silver filtration and a peak voltage of 50 KV. The broadband x-ray simulation for ED-CSCT uses a tungsten (W) anode with 0.05 mm tungsten filtration and a peak voltage of 80 kV. All spectra were generated by XSPEC software, as shown in figure 3. From figure 3, we can see that the Bremsstrahlung component dominates the tungsten spectrum, while the characteristic lines dominate the spectra of copper and silver anode. The pixel size in the simulation is 55 × 55 μm2. In addition to the Gaussian spectral response, we take the charge sharing effect into account, which was reported for Medipix2 detectors (Caroli et al 1992, Chmeissani et al 2004). We assume that 10% of the incident photons on the central pixel are leaked into the low energy channels of adjacent pixels. The detected energy of the photo-electrons has a uniform distribution in the low energy channels. The latest version, Medipix3, has minimized this charge sharing effect (Gimenez et al 2011).
Figure 3.
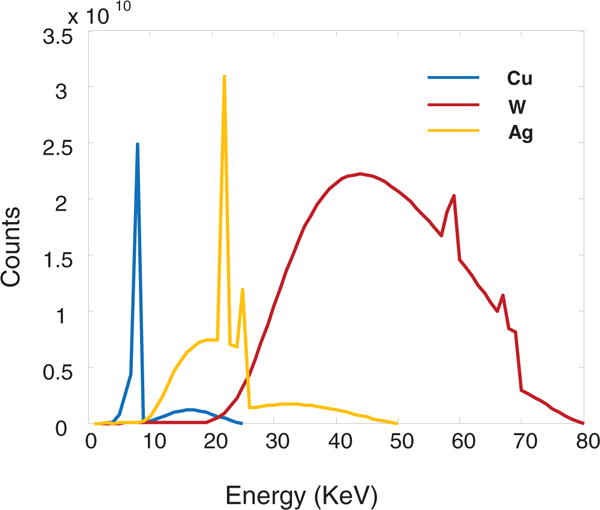
X-ray source spectra with copper (Cu), tungsten (W), and silver (Ag) anode targets after filtration simulated by XSPECT.
The circular 2D phantom contains 5 regions with the following materials: normal tissue, adipose, water, fibroglandular tissue and carcinoma, as shown in figure 4(a). The simulation phantom consists of 65 pixels in both spatial dimensions with a pixel length of 55 μm. The beam width is 1 mm. The coherent scatter signatures of various tissue types are adopted from previous reported results (Kidane et al 1999), and plotted in figure 4(b).
Figure 4.
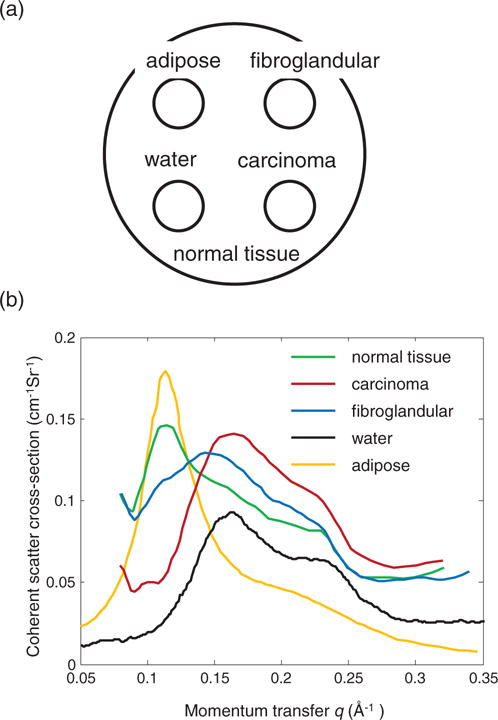
(a) Simulation phantom. (b) The structural form factor spectrum for various tissue types.
Direct tomography simulation uses the copper anode source. The horizontal detector to object distance l0 is 200 mm. The center of the detector array has a vertical offset, w, of 30 mm away from the illumination plane. The collimator is comprised of polycapillary tubes. The tube has a radius of 40 μm and a length of 40 mm. The angular range, β, is 1.0 mrad.
AD-CSCT simulations use x-ray sources of both the silver target and copper target. In order to compare the resolution with the direct tomography, the horizontal distance between the center of detector array and the object is also set to 200 mm. To cover the momentum transfer range from 0.06 Å−1 to 0.25 Å−1, the 2D energy integrating detectors has a vertical dimension about 10 cm, covering the scatter angles from 10° to 37° for the copper anode source. For silver anode source, the vertical dimension of the detector is about 4.5 cm, covering the scatter angles from 4° to 14°. The projection over 180° rotation was covered by 120 steps with step size of 1.5°.
ED-CSCT setup uses broadband tungsten x-ray tube. The linear energy-discriminative detector has a vertical offset, w0, of 16 mm. With this offset, the energy range of the x-ray source corresponds to a momentum transfer range from 0.06 Å−1 to 0.25 Å−1, where the strongest scattering is typically observed. The energy-discriminative detector covers the range from 10 to 80 keV with 2 keV step size. The energy response profile was assumed to be the Gaussian function, with the standard deviation of each channel, σE, changing from 2 keV to 14 keV.
A Poisson noise with peak signal to noise ratio (PSNR) of 20 dB was added to the simulated measurement. Since the direct tomography is a point-to-point mapping, the reconstruction is unnecessary. In the CSCT setups, the forward model projects the 3D object function f(x, y, q) to the scatter measurement of g(xd,w,ϕ) and g(xd,E,ϕ) for AD-CSCT and ED-CSCT, respectively. Given the noise model and the projection data, we perform the reconstruction of the 3D object function using maximum likelihood estimation.
4. Results and discussions
4.1. Direct tomography versus AD-CSCT
Given the angular range of the collimator and the system geometry, we have simulated the point spread function in the object space. Figure 5(a) shows a part of the collection cone of a single pixel, which is limited by the collimator, intersects with the illumination plane. The intersection is the point spread function of the detector K(r), shown in figure 5(b).
Figure 5.
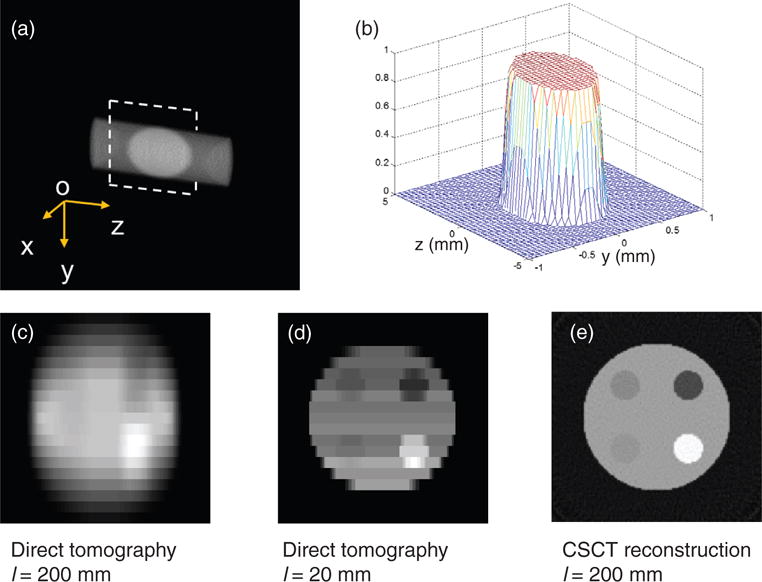
(a) Direct tomography imaging volume collimated by a polycapillary tube with full acceptance angle of 2 mrad. The point spread function is the intersection of the detection beam and the illumination fan plane. (b) The point spread function of the direct tomography with a capillary collimator that is 200 mm away from the sample. (c) The direct tomography image of the phantom. (d) The direct tomography image if the detector is 20 mm away. (e) The AD-CSCT reconstruction of the phantom.
Along the incident beam direction (Z axis), the object resolution depends on the angle between the normal direction of the detector and the scatter photons. Because of the small scatter angle, the spatial resolution along the Z direction is significantly worse than that along the horizontal direction (Y axis). For the simulation geometry, the resolutions along Y and Z axis are 0.55 mm and 3.74 mm, respectively.
The simulated image generated by direct tomography using the copper anode x-ray source is shown in figure 5(c). We can clearly see the difference in resolution along the two coordinates. The image quality is comparable with the experimental results reported previously (Cui et al 2010). Reducing the angular range of the polycapillary tube will reduce the collection efficiency. Alternatively, one can reduce the detector-to-object distance to improve the resolution. One recent industrial direct tomography system demonstrated a resolution close to 0.3 mm by a controlled-drift detector array with a pixel size of 0.18 × 0.18 mm2 (Castoldi et al 2010). The distance from the detector to sample is about 20 mm. We also simulated the geometry where the distance from the detector to the object is 20 mm, as shown in figure 5(d). The full width at half maximum of the point spread function is estimated to be close to 0.25 mm along the Y direction. The small detector-to-object distance also increases the collection efficiency, yet the intensity variance due to the decreasing detector-to-object distance becomes more pronounced. In figure 5(d), we can observe that the signal counts from the top rows are lower than that of the bottom rows, because the detectors in the top rows are farther away from the object than that in the bottom rows.
Instead of using polycapillary collimators, AD-CSCT only has 1D lamellae collimation in the horizontal direction. The resolution along the illumination direction depends on the tomographic reconstruction, which can approach the resolution in the horizontal direction. Figure 5(e) shows the AD-CSCT reconstruction of the phantom at the same momentum transfer value as figures 5(c) and (d). The reconstruction in figure 5(e) has a much better resolution in the Y direction. However, it is worth mentioning that the AD-CSCT measurement requires taking a series of images for the reconstruction, and the direct tomography is a snap-shot acquisition, and the resolution could be improved by rotating the object as well.
The most important advantage of AD-CSCT is its collection efficiency. In direct tomography, the collection angular range of polycapillary tube was 1 mrad, corresponding to a solid angle of 3.1 μSr. For AD-CSCT, each pixel collects scatter photons along the illumination line. Considering the angular range in the vertical direction about 20°, as in the case of the simulation setup, the collection solid angle is 0.55 mSr, which is close to 200 times larger than the collection solid angle of direct tomography.
4.2. ED-CSCT
The simulated measurements from 4 energy channels are shown in figure 6(a). The data representation in each energy channel is similar to the sinogram of transmission CT. However, because the line integration in the q−Δl plane is along the hyperbola curve, the measurement in each energy channel does not directly represent the projection from a single momentum transfer value, q. The momentum transfer range in each energy channel is about 0.01 Å, and therefore the reconstruction in each q section, as shown in figure 6(b), still shows correlation with the corresponding measurement. The advantage of the coherent scatter imaging is that at different momentum transfer value, different tissue types display different contrast. Take the contrast between carcinoma tissue (bottom right circle) and the normal tissue (phantom body) as an example. At small momentum transfer value, q = 0.096 Å, the normal tissue appears to be brighter than the carcinoma tissue, thanks to its relatively large structural form factor. At q = 0.129 Å two tissues have similar brightness, while at q = 0.161 Å carcinoma tissue becomes brighter, which is in agreement with their form factor profiles.
Figure 6.
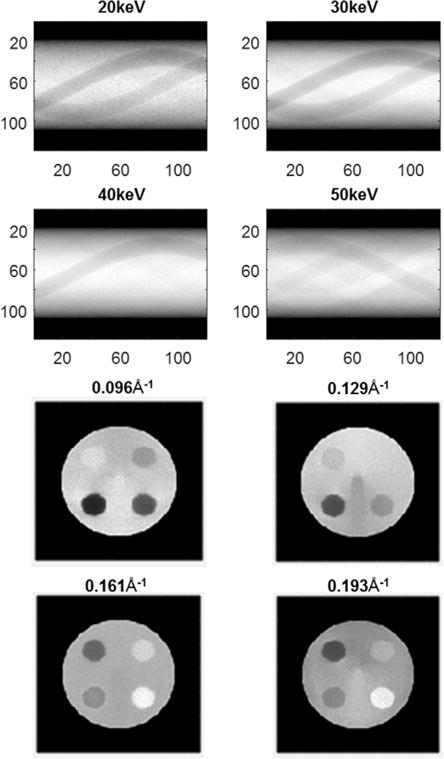
(a) The simulated energy dispersive CSCT sinogram in 30–60 keV channels. (b) CSCT reconstruction at 0.096, 0.129, 0.161, and 0.193 Å−1.
Figure 7 shows the reconstructed scattering cross-section from the energy-discriminative detector with σE = 6 keV. To characterize the reconstruction, the reconstructed structural form factors at 9 momentum transfer values uniformly-spaced between 0.09 Å−1 and 0.21 Å−1 were selected in the normal tissue and carcinoma tissue to compare with the ground truth. We performed reconstruction for 10 different instances of Poisson noise (20 dB PSNR), the normalized mean square error (NMSE) of the reconstructed scattering cross-section are 0.011 for normal tissue and 0.016 for carcinoma. The error bars indicate the standard deviation of the reconstruction.
Figure 7.
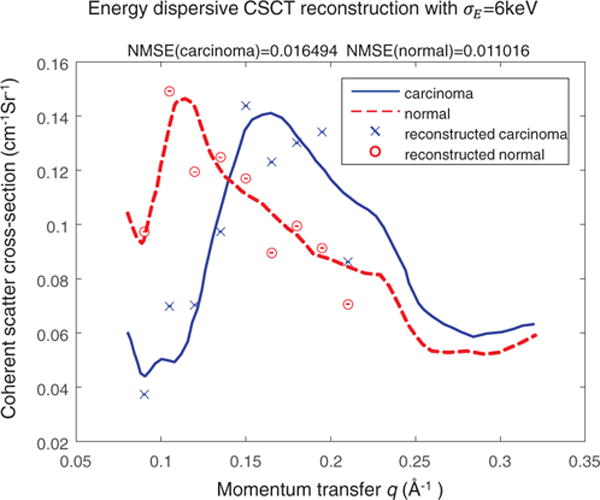
Reconstructed scattering cross-section using energy-discriminative detector with a channel energy deviation of σE = 6 keV. The red and blue lines are the true scattering profile for normal tissue and carcinoma, respectively. The circle and cross represent the reconstructed profile of normal and carcinoma tissue at 9 momentum transfer values.
As mentioned in section 3, the momentum transfer resolution in AD-CSCT relies on the sharp characteristic lines of the x-ray sources. The energy deviation to central energy ratio, σE/E, of the copper and silver target is about 10%. For many energy-discriminative detector σE/E is about 20%. Since the line integration is performed on the q−Δl plane, the energy measurement uncertainty in CSCT affects the reconstruction in both spatial and momentum transfer domain. The poor energy resolution of the detector array, therefore, not only reduces the momentum transfer resolution, but also the spatial resolution in ED-CSCT setup. With recent improvements in energy resolution in detectors, here, we compare the reconstruction results of ED-CSCT with energy deviation, σE, from 2 keV to 14 keV. AD-CSCT reconstructions from copper and silver target serve as the benchmarks for the ED-CSCT reconstructions.
Figure 8 plots the reconstruction NMSE at different energy deviation for both the normal tissue and carcinoma. For both tissue types, poor energy resolution results in larger reconstruction error. The reconstruction NMSE of AD-CSCT with silver target is 8.0 × 10⁻⁴ for normal tissue, and 3.5 × 10⁻² for carcinoma. The reconstruction NMSEs with copper target are 6.1 × 10⁻³ and 2.9 × 10⁻² for normal tissue and carcinoma, respectively.
Figure 8.
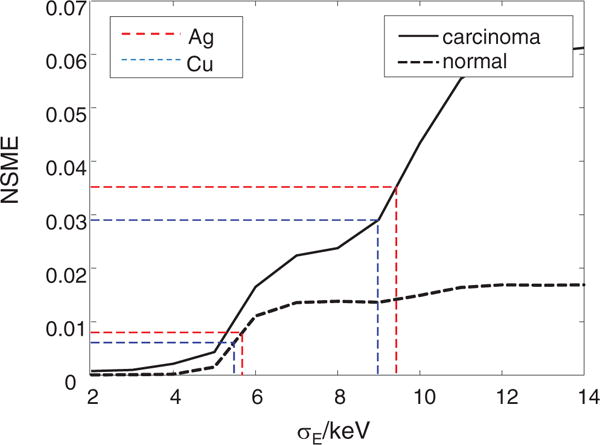
Normalized mean square error (NMSE) of reconstructed structural form factor of different energy deviation, σE. The horizontal red and blue dotted lines show the error of reconstruction using energy integration detector with a narrow-band x-ray source (Cu and Ag anodes) for normal tissue and carcinoma, respectively.
In AD-CSCT setups, images with copper target show better reconstruction than silver target. This is attributable to the narrower bandwidth of the filtered copper target spectrum compared with that of the silver target. Carcinoma tissue has a greater reconstruction error than normal tissue. We speculate this difference is mainly caused by the error in higher momentum transfer value, which is close to the measurement range of the momentum transfer. The comparison between the two setups shows that for carcinoma tissue, ED-CSCT outperforms AD-CSCT with a copper target if the energy deviation, σE, is below 9.0 keV. For normal tissue, the energy σE needs to be below 5.5 keV. These energy deviation values are close to the normalized energy deviation of 10%.
It is worth mentioning that the measurement PSNR of 20 dB implies that the scattered photon counts for each pixel is on the order of 104. The interaction coefficients of most soft tissues, , are close to 5 cm2 g−1 at 10 keV (Johns and Cunningham 1974). The collection solid angle of 0.55 mSr for AD-CSCT setup. The estimated absorbed dose is therefore ranging from 10 to 100 mGy, which is consistent to the previously reported values (Harding 1987). Direct tomography will have an absorbed dose over 1 Gy, due to its smaller collection solid angle. For a common continuous tabletop x-ray source with 1 kW power, each projection in ED-CSCT is expected to have an imaging time of ~1.5 min. For a sample of several centimeters in diameter, the total imaging time is estimated to be from 1 to 3 h. The energy filtering reduces the source efficiency of the AD-CSCT setup, and the imaging time is expected to be an order of magnitude greater.
5. Conclusions
We have described the direct tomography and AD-CSCT setup for small angle scatter tomography, and further proposed ED-CSCT setup using an energy-discriminative detector array. We performed simulations and compared the resolutions between direct tomography and CSCT. CSCT has an order of magnitude higher collection efficiency and better spatial resolution, while direct tomography does not require imaging reconstruction and sample rotation.
With the development in energy-discriminative photon-counting detectors, the energy dispersive measurement with a broadband tabletop x-ray tube could achieve a comparative resolution as the angular dispersive coherent scatter measurement. We have demonstrated the operating principle of ED-CSCT. The simulation showed that as the normalized energy resolution is smaller than 10%, ~6 keV, the reconstruction of the ED-CSCT can outperforms the AD-CSCT. It is worth mentioning that using a 2D energy-discriminative detector array is equivalent to a combined angular and energy dispersive measurement, since both w and E are scanning parameters in equation (12), which could lead to even better performance.
Due to the small sample size (<2 cm), our simulated measurements are less affected by the effects of Compton scattering, multiple scattering, and beam hardening. Based on a CT scan, the attenuation of the illumination beam and scattering photons can be effectively compensated for. Imaging of an extended tissue of 7 cm in diameter was already demonstrated (Kleuker 1998). For thicker sample, Monte Carlo simulations could be performed to quantify the attenuation and incoherent scatter effect. Here the system cost was not included in the discussion; with the widespread application of energy-discriminative detector in CT system, we expect the cost of high-performance energy-discriminative detector would be reduced in the near future. The ED-CSCT system significantly improves the source efficiency, which could lead to the reduction in the imaging time, making the x-ray small angle scatter tomography a powerful system for high-specificity tissue imaging and cancer screening applications.
Acknowledgments
The authors would like to thank the support from National Institute of Health (R01 EB016977).
References
- Batchelar DL, Cunningham IA. Material-specific analysis using coherent-scatter imaging. Med Phys. 2002;29:1651–60. doi: 10.1118/1.1493216. [DOI] [PubMed] [Google Scholar]
- Batchelar DL, Davidson MTM, Dabrowski W, Cunningham IA. Bone-composition imaging using coherent-scatter computed tomography: assessing bone health beyond bone mineral density. Med Phys. 2006;33:904. doi: 10.1118/1.2179151. [DOI] [PubMed] [Google Scholar]
- Caroli E, DiCocco G, Donati A, Landini G, Stephen JB. Characterization of small CdTe detectors to be used for linear and matrix arrays. IEEE Trans Nucl Sci. 1992;39:598–604. [Google Scholar]
- Castoldi A, Ozkan C, Guazzoni C, Bjeoumikhov A, Hartmann R. Experimental qualification of a novel x-ray diffraction imaging setup based on polycapillary x-ray optics. IEEE Trans Nucl Sci. 2010;57:2564–70. [Google Scholar]
- Chmeissani M, Maiorino M, Blanchot G, Pellegrini G, Garcia J, Lozano M, Martinez R, Puigdengoles C, Ullan M. Charge sharing measurements of pixilated CdTe using Medipix-II chip. Proc of the 21st IEEE Instrumentation and Measurement Technology Conf. 2004;1:787–91. [Google Scholar]
- Cui C, Jorgensen SM, Eaker DR, Ritman EL. Direct three-dimensional coherently scattered x-ray microtomography. Med Phys. 2010;37:6317–22. doi: 10.1118/1.3517194. [DOI] [PMC free article] [PubMed] [Google Scholar]
- Cunha DM, Oliveira OR, Pérez CA, Poletti ME. X-ray scattering profiles of some normal and malignant human breast tissues. X-ray Spectrom. 2006;35:370–4. [Google Scholar]
- Dahlstrom JE, Jain S, Sutton T, Sutton S. Diagnostic accuracy of stereotactic core biopsy in a mammographic breast cancer screening programme. Histopathology. 1996;28:421–7. doi: 10.1046/j.1365-2559.1996.332376.x. [DOI] [PubMed] [Google Scholar]
- Delfs J, Schlomka J-P. Energy-dispersive coherent scatter computed tomography. Appl Phys Lett. 2006;88:243506. [Google Scholar]
- Elshemey WM, Mohamed FS, Khater IM. X-ray scattering for the characterization of lyophilized breast tissue samples. Radiat Phys Chem. 2013;90:67–72. [Google Scholar]
- Fernández M, et al. Human breast cancer in vitro: matching histo-pathology with small-angle x-ray scattering and diffraction enhanced x-ray imaging. Phys Med Biol. 2005;50:2991–3006. doi: 10.1088/0031-9155/50/13/002. [DOI] [PubMed] [Google Scholar]
- Fernández M, Keyriläinen J, Serimaa R, Torkkeli M, Karjalainen-Lindsberg ML, Tenhunen M, Thomlinson W, Urban V, Suortti P. Small-angle x-ray scattering studies of human breast tissue samples. Phys Med Biol. 2002;47:577–92. doi: 10.1088/0031-9155/47/4/303. [DOI] [PubMed] [Google Scholar]
- Gimenez EN, Ballabriga R, Campbell M, Horswell I, Llopart X, Marchal J, Sawhney KJS, Tartoni N, Turecek D. Characterization of Medipix3 with synchrotron radiation. IEEE Trans Nucl Sci. 2011;58:323–32. [Google Scholar]
- Harding GL. X-ray diffraction computed tomography. Med Phys. 1987;14:515. doi: 10.1118/1.596063. [DOI] [PubMed] [Google Scholar]
- Harding G. Energy-dispersive x-ray diffraction tomography. Phys Med Biol. 1990;35:33–41. [Google Scholar]
- Harding GL. X-ray diffraction imaging—a multi-generational perspective. Appl Radiat Isot. 2009;67:287–95. doi: 10.1016/j.apradiso.2008.08.006. [DOI] [PubMed] [Google Scholar]
- Johns HE, Cunningham JR. The Physics of Radiology. 4th. Springfield, IL: Thomas; 1974. [Google Scholar]
- Kidane G, Speller RD, Royle GJ, Hanby AM. X-ray scatter signatures for normal and neoplastic breast tissues. Phys Med Biol. 1999;44:1791–802. doi: 10.1088/0031-9155/44/7/316. [DOI] [PubMed] [Google Scholar]
- Kleuker U, Suortti P, Weyrich W, Spanne P. Feasibility study of x-ray diffraction computed tomography for medical imaging. Phys Med Biol. 1998;43:2911–23. doi: 10.1088/0031-9155/43/10/017. [DOI] [PubMed] [Google Scholar]
- Malecki A, et al. X-ray tensor tomography. Europhys Lett. 2014;105:38002. [Google Scholar]
- Medipix3 array detector [WWW Document] 2014 URL ( https://medipix.web.cern.ch/medipix/pages/medipix3.php)
- Oliveira OR, Conceição ALC, Cunha DM, Poletti ME, Pelá CA. Identification of neoplasias of breast tissues using a powder diffractometer. J Radiat Res. 2008;49:527–32. doi: 10.1269/jrr.08027. [DOI] [PubMed] [Google Scholar]
- Pfeiffer F, Weitkamp T, Bunk O, David C. Phase retrieval and differential phase-contrast imaging with low-brilliance x-ray sources. Nat Phys. 2006;2:258–61. [Google Scholar]
- Schlomka JP, Harding A, Van Stevendaal U, Grass M, Harding GL. Coherent scatter computed tomography: a novel medical imaging technique. SPIE Medical Imaging. 2003;5030:256–65. doi: 10.1118/1.1598731. [DOI] [PubMed] [Google Scholar]
- Sidhu S, Falzon G, Hart SA, Fox JG, Lewis RA, Siu KKW. Classification of breast tissue using a laboratory system for small-angle x-ray scattering (SAXS) Phys Med Biol. 2011;56:6779–91. doi: 10.1088/0031-9155/56/21/002. [DOI] [PubMed] [Google Scholar]
- Sidhu S, Siu KKW, Falzon G, Nazaretian S, Harte SA, Fox JG, Susil BJ, Lewis RA. X-ray scattering for classifying tissue types associated with breast disease. Med Phys. 2008;35:4660–70. doi: 10.1118/1.2977667. [DOI] [PubMed] [Google Scholar]
- Sidhu S, Siu KKW, Falzon G, Hart SA, Foxe JG, Lewis RA. Mapping structural changes in breast tissue disease using x-ray scattering. Med Phys. 2009;36:3211–7. doi: 10.1118/1.3147144. [DOI] [PubMed] [Google Scholar]


