

Abstract
Postmortem brain studies support dysregulated expression of the histone deacetylase enzymes, HDAC1 and HDAC2, as a central feature in diseases including schizophrenia, bipolar disorder, and depression. Our objective was to investigate HDAC expression in a large postmortem sample set representing healthy and disease brains. We used >700 well-characterized samples from patients diagnosed with schizophrenia (n = 175), major depressive disorder (n = 135), and bipolar disorder (n = 61) to measure HDAC1 and HDAC2 transcript levels by quantitative real-time PCR in dorsolateral prefrontal cortex (DLPFC) and caudate compared to control samples. HDAC expression was calculated relative to the geometric mean of β-2-microglobulin, β-glucuronidase, and β-actin. In adult-age DLPFC, HDAC2 was decreased by 34% in schizophrenia samples compared to controls (p < 10–4). HDAC2 was significantly upregulated in major depressive disorder samples by 17% versus controls (p = 0.002). Neither smoking history nor therapeutic drugs impacted HDAC2 levels and no HDAC1 patient-control differences were observed. In caudate, HDAC levels were unchanged between patient and control groups. In control DLPFC, age fetal week 14 to 97 years (n = 326), both HDAC1 and HDAC2 levels sharply declined around birth and stabilized thereafter. Using by far the largest postmortem sample set on this topic, our major finding (decreased HDAC2 transcript) showed notable specificity in disease (schizophrenia but not major depressive disorder), HDAC subtype (HDAC2 but not HDAC1) and brain region (DLPFC but not caudate). These differences shape understanding of regional components of neural circuitry in the diseased brain and set a benchmark to quantify HDAC density and distribution using in vivo neuroimaging tools.
Keywords: Epigenetics, chromatin, schizophrenia, mood disorders unipolar, mood disorders bipolar, neuropsychiatry
Chromatin modifying enzymes, particularly histone deacetylase (HDAC) family members, maintain a central presence in research on mechanisms underlying neuropsychiatric disease on the basis of postmortem brain tissue analysis, animal models, and large-scale genome wide sequencing from patient samples.1 Surprisingly, even for major psychiatric diseases including schizophrenia, bipolar disorder, and depression, only a handful of small-scale experiments demonstrate altered HDAC expression in the human brain.
Foundational studies provided early evidence, albeit from small cohorts, that dysregulated expression and activity of HDAC enzymes may represent a fundamental difference between the diseased versus healthy brain. For the class I subtype HDAC1, this evidence comprised one report on transcript microarray data from postmortem DLPFC (n = 16–27/group)2 and another on individual transcript quantities (n = 7/group) in GABA-ergic neurons from schizophrenia, bipolar disorder and control sample cohorts.3 Postmortem evidence further demonstrated that HDAC2 protein levels may be altered in the nucleus accumbens from depressed patients4 and in the hippocampus of Alzheimer’s disease patients,5 where cognitive deficits exemplify a comorbidity of many psychiatric diseases. However, no study has investigated if altered HDAC expression in the brain is consistently dysregulated within a disease population.
Last year, genome-wide analysis demonstrated that the activity of chromatin modifying enzymes and specifically, the enrichment of histone acetylation and methylation at genomic sites in neural cells (annotated from multiple cell types) are relevant molecular components (among many others) that may enable molecular classification of psychiatric diseases and heritability.1,6 Preclinical research in genetically engineered rodent models demonstrated that overexpression of HDAC1 and altered expression or inhibition of HDAC2 are sufficient to drive behavioral phenotypes and gene expression changes related to anxiety,7 depression,4,8−10 and learning and memory.5,11 Further, rodent research has also shown in a large and growing literature base that small molecule HDAC inhibitors have significant therapeutic potential in correcting diverse CNS-disease related deficits.4,5,8,11 Taken together, this background indicates that changes in HDAC expression may be expected as a disease-related hallmark and that clarifying HDAC expression is of particular pharmacological relevance.
Importantly, independent investigations have shown that changes in HDAC expression may be the result of exposure to antipsychotic12 and antidepressant medications.13 Additionally, chromatin immunoprecipitation experiments showed that histone acetylation profiles at the promoter regions of schizophrenia-associated genes may be distinct in young and old adults with schizophrenia,14 and may provide an epigenetic basis for age-dependent expression patterns of schizophrenia-susceptibility genes.15 Therefore, in order to bridge a key knowledge gap in the validation of dysregulated HDAC expression in psychiatric disease, we utilized a large well characterized postmortem tissue collection representing >700 samples ranging from prenatal to 97 years of age to measure transcript expression by quantitative PCR and investigate effects of factors relevant in postmortem tissue research (age at death, tissue pH, RNA quality) and psychiatric disease (comorbidity of smoking, and therapeutic drug status).
Results and Discussion
HDAC2 Levels Are Downregulated in DLPFC from Schizophrenia Samples and Upregulated in Major Depressive Disorder Samples
Transcript levels of HDAC1 and HDAC2 were first measured by quantitative PCR in cDNA prepared from postmortem human DLPFC from brain donors without history of psychiatric illness (controls), and from patients diagnosed with SCZ, BP, or MDD; donor demographics and DLPFC sample details are shown in Table 1. For each transcript, relative expression was normalized to the geometric mean of three housekeeping genes: B2M, GUSB, and ACTB. These normalizing genes were utilized on the basis of prior work in postmortem brain demonstrating favorable low variance;16 relative quantification normalized to the geometric mean of three genes is a conservative and recommended method to reduce bias introduced by a single normalizing gene.17
Table 1. Demographic and DLPFC Sample Details.
| adult (≥18 years) |
|||||
|---|---|---|---|---|---|
| pre-adult | control | schizophrenia | bipolar disorder | major depressive disorder | |
| n/group | 124 | 210 | 175 | 61 | 135 |
| sex, female/male | 52:72 | 61:149 | 65:110 | 25:36 | 57:78 |
| age (years), mean ± SD | 5.4 ± 7.1 | 44.2 ± 15.5 | 50.2 ± 14.9 | 44.8 ± 14.2 | 45.7 ± 13.6 |
| race, African American/Caucasian | 68:54 | 111:87 | 73:95 | 6:51 | 14:116 |
| PMI (hours), mean ± SD | 16.4 ± 15.4 | 30.7 ± 14.5 | 38.5 ± 24.1 | 32.9 ± 18.4 | 37.9 ± 25.5 |
| pH (DLPFC), mean ± SD | 6.4 ± 0.3 | 6.6 ± 0.3 | 6.4 ± 0.3 | 6.4 ± 0.3 | 6.4 ± 0.3 |
| RIN (DLPFC), mean ± SD | 8.5 ± 1.1 | 8.3 ± 0.7 | 7.8 ± 1.0 | 8.0 ± 0.9 | 8.0 ± 0.9 |
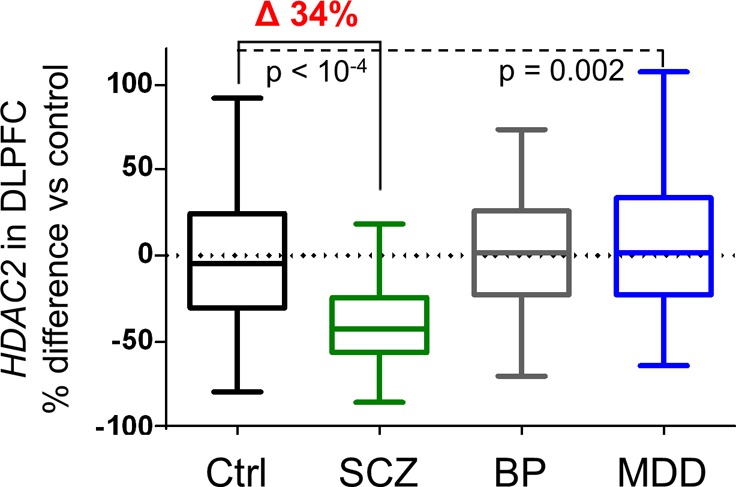
Comparison of HDAC transcript levels from adult-age samples (≥18 years old) across psychiatric disease diagnosis groups revealed a significant difference of HDAC2 in the DLPFC with diagnosis as the primary factor (R2 = 0.21, p = 10–15). Posthoc testing revealed a statistically significant, 34% ANCOVA-corrected decrease in HDAC2 from SCZ samples compared to controls; F (3, 566) = 61.05, Tukey HSD p < 10–4 (Figure 1A). Covariates known to impact postmortem transcript levels were clarified as significant (p < 0.05) and applied in a multifactorial linear model of HDAC2 expression as a function of disease diagnosis. The covariates applied and additional percent variance described by each were: RNA integrity, RIN (6.7%); race (6.9%); pH (5.1%); smoking status (2.2%); age at death (4.4%); and sex (1.4%). Correction for transcript measurements collected in two data sets was also applied (6.9% variance), as well as a conservative correction for postmortem interval, which revealed marginal significance (p = 0.10) within samples from the BP group alone. Overall, the model provided a collective measurement of 33.21% variance, a level consistent with prior postmortem transcript investigation.16 By similar comparison, a significant increase of 17% for HDAC2 expression was detected in MDD samples compared to controls, Tukey HSD p = 0.002. No significant changes were detected for BP samples compared to controls (p = 0.8).
Figure 1.

HDAC2, but not HDAC1 is profoundly decreased in the DLPFC from patients with schizophrenia. (A) Box plots illustrate HDAC2 transcript levels were significantly decreased by 34% in DLPFC samples from patients with SCZ compared to Ctrls (p < 10–4). A significant, 17% increase was also detected in MDD samples compared to Ctrls (p = 0.002) with no significant difference observed in BP samples. (B) HDAC1 transcript levels were not significantly different in any diagnosis group compared to Ctrl samples. Significant differences in MDD (15–17% differences) were observed when compared to SCZ (p < 0.01) or BP sample groups (p = 0.01). (C and D) HDAC expression scatter plots including bars for mean ± SD illustrate relative HDAC expression results from a subset of Ctrl (n = 69), SCZ (n = 54), and BP (n = 44) samples. Analysis of DLPFC results from this subset recapitulated the HDAC2-selective decreases observed in the total cohort (C and D, left panels). Caudate was also assayed from these same donors with no significant differences (p < 0.05) detected for HDAC2 or HDAC1 transcript levels in SCZ or BP groups compared to controls (C and D, right panels).
HDAC1 transcript measurements across diagnosis groups and control samples were also compared similarly by ANCOVA, with no significant differences detected; F(3, 561) = 3.94 (Figure 1B).
Given that the schizophrenia cohort demonstrated the most profound differences in HDAC levels compared to controls, we wanted to investigate the extent of these changes in another brain region. The caudate nucleus was identified in elegant functional neuroimaging studies to provide a remarkable 74% classification accuracy to distinguish schizophrenia patients from controls on the basis of increased specialization to the right versus left hemisphere.18 Prior reports have provided insight that decreases in caudate volume and activity may contribute to schizophrenia symptoms including deficits in language processing,19speech recognition20 and delusions of reference.21 Therefore, we justified interrogating caudate samples for levels of HDAC1 and HDAC2, and on the basis of sample availability, measured transcript levels in a subset of samples from control (n = 69), SCZ (n = 54), and BP (n = 44) groups.
ANCOVA comparison in caudate revealed no significant diagnosis group differences for HDAC2, F(2,152) = 1.62 or HDAC1, F(2,152) = 3.42; (Figure 1C and D, “Caudate”). Analysis of DLPFC data collected from this sample subset (a fraction of data presented in Figure 1) recapitulated changes found from the full sample compliment with the SCZ group demonstrating a significant decrease in HDAC2, but not HDAC1 (Figure 1C and D, “DLPFC”). No significant correlations were found between levels of HDAC1 or HDAC2 in the caudate to DLPFC, or for correlations of HDAC1 to HDAC2 within either the caudate or DLPFC.
HDAC expression, particularly of HDAC1 and HDAC2, has long been implicated in the mechanisms underlying schizophrenia, bipolar disorder, and depression2−4,12 and, on the basis of preclinical research with small molecule HDAC inhibitors, represents a set of targets with demonstrated therapeutic relevance. This is the first study to measure the gene expression of an epigenetic enzyme in a large (>700 total samples) and well-characterized cohort of human postmortem brain samples, including disease groups comprising SCZ, BP and MDD. We found strong evidence that the levels of HDAC2 transcript in the DLPFC of SCZ samples were decreased compared to controls. This effect was statistically significant (p < 10–4) and robust, with a 34% HDAC2 deficit that remained significant after correction for a number of covariates relevant in postmortem brain and psychiatric disease research. We also found a significant upregulation of HDAC2 transcript in the DLPFC of MDD samples (17% increase).
In contrast, we showed no differences in either HDAC1 or HDAC2 in caudate between control and SCZ samples. As the relevance of the caudate in the neuropathology and phenomenology of schizophrenia is well recognized, we interpret that our findings indicate that the changes in HDAC2 in the DLPFC of schizophrenia patients do not summarize brain-wide changes in epigenetic enzyme expression.
The relationship between mRNA and protein is complex and cognate levels are often poorly correlated.22,23 Nevertheless, given the large HDAC2 change we observed in the SCZ group, we used Western blotting to measure relative DLPFC protein expression of HDAC1 and HDAC2 in a subset of SCZ and control samples (n = 10/group). Specific samples (similar in age and sex) were selected as representative of the median DLPFC HDAC2 transcript levels for their diagnosis group. Quantitation of HDAC density was expressed on the basis of immunoreactivity from recombinant HDAC standards and normalized to GAPDH. No differences were observed between control and SCZ samples for HDAC1 or HDAC2 protein levels in this subset (Supporting Information Figure 1).
Our examination of HDAC2 protein levels in a small sample subset by Western blot did not recapitulate group-level transcriptional changes observed in DLPFC from SCZ vs controls. Prior studies highlight the well-known issue of transcript/protein disparity.22,23 Although extensive work has been done to understand critical factors in postmortem transcript measurements,16 less is known about postmortem effects on epigenetic proteins (e.g., HDACs), associated posttranslational modifications (e.g., nitrosylation in the case of HDAC2), or the status of interaction with other essential proteins in complex. Nevertheless, tools are emerging to obtain highly sensitive and quantitative HDAC expression data at the protein level using LC-MS/MS24 as well as in the living brain, using positron emission tomography with the radiotracer [11C]Martinostat25−28 or its analogue, [18F]MGS-3.29
Disease-Relevant Covariates Have Limited Impact on HDAC Expression in DLPFC
Smoking Status
A history of smoking was documented for ∼25% of the control group (Table 2: 150 nonsmokers to 51 smokers), was modestly elevated in MDD and BP groups and had a prevalence of 71% in the SCZ group (48 nonsmokers to 116 smokers), consistent with nicotine use as a comorbidity of psychiatric disease. ANCOVA testing revealed no significant effect of smoking on HDAC2 or HDAC1 transcript levels in the DLPFC for any diagnosis group; (e.g., HDAC2, F(5, 575) = 31.28). Exemplified in Table 2, the magnitude of differences in DLPFC HDAC2 levels was equivalent in subgroups of nonsmokers and smokers from each diagnosis and control group (e.g., SCZ nonsmokers and smokers revealed decreases in HDAC2 by 38.2% and 37.6%, respectively compared to matched controls). In the subset of control samples where nicotine and cotinine were both measured (n = 42, DLPFC; n = 13, caudate) we confirmed that while nicotine and cotinine levels were significantly correlated [F(1, 40) = 36.91, p < 3.7 × 10⁻⁷], nicotine/cotinine levels were not correlated with levels of HDAC1 or HDAC2 in DLPFC [F(1,40) = 0.01–0.12; p = 0.73–0.93] or caudate [F(1, 12) = 1.02–1.62; p = 0.23–0.33].
Table 2. Impact of Smoking History on HDAC2 Transcript Levels in DLPFC.
| control | schizophrenia | bipolar disorder | major depressive disorder | |
|---|---|---|---|---|
| nonsmokers: n HDAC2 level | n = 150, 0.782 | n = 48, 0.488 | n = 24, 0.829 | n = 53, 0.849 |
| % change vs Ctrl | –38.2% | 6.0% | 8.6% | |
| Smokers: n HDAC2 level | n = 51, 0.769 | n = 116, 0.475 | n = 30, 0.816 | n = 59, 0.836 |
| % change vs Ctrl | –37.6% | 6.1% | 8.7% |
Therapeutic Drug Status
Recent reports have highlighted that antidepressant or antipsychotic medications may impact the expression of HDAC enzymes.12,13 We applied categorical factors of antidepressant (AD) and antipsychotic (AP) therapeutic drug status at the time of death on the basis of toxicity reports, defining four designations; AD or AP negative and AD or AP positive (Table 3). ANCOVA revealed no relationship between AD therapeutic status and HDAC2 levels in DLPFC; F(1, 514) = 0.003, p = 0.96). Adjusted means revealed no appreciable difference in HDAC2 levels in diagnosis groups divided on the basis of AD therapeutic status (Table 3, top). ANCOVA further revealed no significant relationship between AP therapeutic status and HDAC2 levels in DLPFC; F(1, 514) = 1.64, p = 0.20. Adjusted means revealed nonsignificant, ∼6–11% differences in HDAC2 levels in diagnosis groups divided on the basis of AP therapeutic status (Table 3, bottom).
Table 3. Impact of Therapeutics on HDAC2 Transcript Levels in DLPFC.
| control | schizophrenia | bipolar disorder | major depressive disorder | |
|---|---|---|---|---|
| antidepressant | ||||
| AD negative: n HDAC2 level | n = 210, 0.744 | n = 129, 0.484 | n = 27, 0.823 | n = 38, 0.815 |
| AD positive: n HDAC2 level | n = 43, 0.482 | n = 30, 0.821 | n = 42, 0.813 | |
| % change neg vs pos | <1% | <1% | <1% | |
| antipsychotic | ||||
| AP negative: n HDAC2 level | n = 210, 0.782 | n = 63, 0.453 | n = 40, 0.807 | n = 74, 0.811 |
| AP positive: n HDAC2 level | n = 110, 0.502 | n = 17, 0.857 | n = 6, 0.860 | |
| % change neg vs pos | 6.2%, not significant | 6.04%, not significant | 10.8%, not significant | |
To examine if HDAC transcript levels in postmortem DLPFC were impacted by specific medications, we extracted evidence from brain donation records and toxicology reports of the presence (AD/AP positive) or absence (AD/AP negative) of three common antidepressants (sertraline, citalopram/escitalopram, and fluoxetine) and four common antipsychotics (risperidone, olanzapine, haloperidol and clozapine). Samples lacking therapeutic treatment evidence were not included in analyses. Each treatment subgroup was relatively small in size (n = 2–37; Supporting Information Figure 2), with the largest subgroup sizes identified for antidepressants in MDD (Supporting Information Figure 2A and C) and for antipsychotics in SCZ (Supporting Information Figure 2B and D). ANCOVA comparison of each of the common AD drugs across diagnostic groups and controls revealed no apparent impact on transcript levels of HDAC1 or HDAC2 in DLPFC. Within-diagnosis group comparison only revealed marginal significance when comparing MDD samples with (n = 7) and without (n = 73) evidence of escitalopram/citalopram; F(1, 67) = 3.86, p = 0.054. ANCOVA adjusted mean values for HDAC1 or HDAC2 in DLPFC indicate MDD samples with evidence of escitalopram/citalopram treatment had ∼20% higher transcript levels compared to MDD samples without. Subgroups divided on the basis of common AP drug toxicology evidence (Supporting Information Figure 2B and D) revealed no difference in HDAC1 or HDAC2 levels in DLPFC for common antipsychotic drugs, (p = 0.57–0.97). In each diagnosis group, only a fraction of samples had positive evidence for lithium (n = 2–4) or valproate (n = 7–11) treatment (Supporting Information Figure 2E); given small group sizes, correlation with HDAC levels was not tested. Despite the caveat of small subgroup sizes (valproate treatment; Supporting Information Figure 2E), we used t tests to compare within-SCZ or -BP diagnosis group levels of HDAC1 or HDAC2 between samples with positive and negative evidence of treatment with valproate, an HDAC inhibitor. No significant differences in HDAC levels were found based on valproate treatment; p = 0.64–0.97.
Overall, we did not detect the effects of factors relevant in psychiatric disease research including smoking status and antidepressant and antipsychotic treatment with HDAC2 in the DLPFC. A limitation of postmortem tissue research is that antemortem medication status, as indicated by toxicology, only represents medications that were consumed within the last hours/day prior to death and therefore may underestimate the effect of therapeutics on gene expression. This may provide some explanation for results previously shown by others in mice12,13 and in a small cohort (n = 10) of human postmortem samples12 that therapeutics impact HDAC expression. Nevertheless, we have a high degree of confidence in our measurement of HDAC transcript levels as we were able to take advantage of large-scale sample groups (n = 61–210/group in DLPFC) and rich sample detail to apply statistical correction on the basis of covariates that have previously been demonstrated as influential in postmortem transcript studies, including RNA integrity (RIN), brain pH and age at death.16
Expression of HDAC1 and 2 in the DLPFC Are Powerfully Correlated with Age during Development
Relative expression of HDAC1 and HDAC2 transcripts were additionally measured in DLPFC from subjects with no known psychiatric disease diagnosis spanning fetal week 14 to 97 years of age. HDAC expression means ± standard deviation (SD) were calculated in 10 age groups including fetal (14–20 weeks), infant (0–1 year); child (1–10 years) and decade-limited age groups thereafter (Figure 2). Pearson’s correlation revealed a highly significant association between age and transcript expression for both HDAC1: F(1,316) = 11.46, r = −0.187, p = 8 × 10⁻⁴ and HDAC2: F(1, 305) = 62.17, r = −0.411, p < 10–13. The most evident change in HDAC1 (Figure 2A) and HDAC2 (Figure2B) expression was during the perinatal period, with a large decrease between the fetal and infant age groups for both transcripts. Dramatic changes in the expression of genes at birth, including HDAC1 and HDAC2 have been previously observed in DLPFC by independent transcript quantification methods.30 Further, these findings are consistent with the critical nature of HDAC expression in development and histone acetylation in aging.11,14,31 Among adult samples (≥18 years of age), we did not find a significant correlation of HDAC expression with age for either HDAC1 or HDAC2; Pearson’s correlation revealed no significant linear correlation between adult age and expression of HDAC1: F(1, 207) = 1.098; r = −0.076; p = 0.30 or expression of HDAC2: F(1, 208) = 1.29; r = −0.079, p = 0.26.
Figure 2.
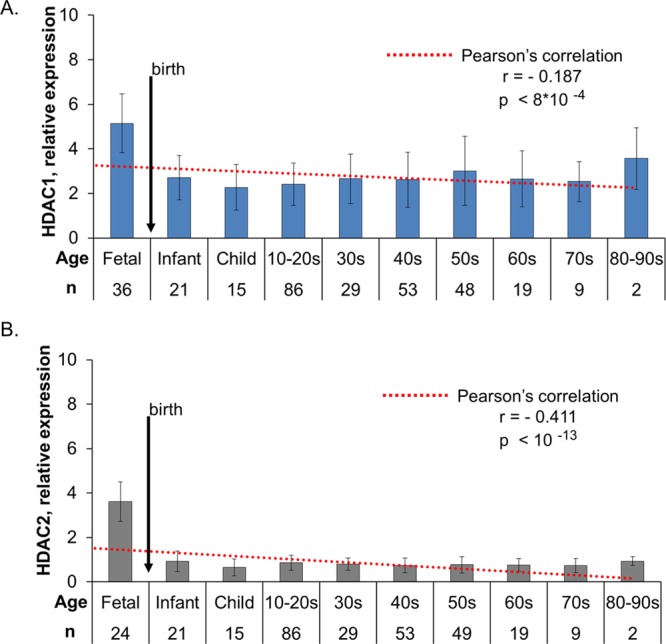
HDAC1 and HDAC2 are highly regulated during development. Relative transcript expression for HDAC1 (A) and HDAC2 (B) was measured in postmortem DLPFC samples from individuals with no history of psychiatric illness. Histograms (mean ± SD) present HDAC expression among 10 age ranges from fetal to late adulthood (80–90 years old) relative to the average expression of three housekeeping genes. Expression across prenatal to adult ages was robustly correlated with age for both HDAC1 (A, r = −0.187, p < 8 × 10⁻⁴) and HDAC2 (B, r = −0.411, p < 10–13). Expression was stable throughout adulthood with no significant correlation between HDAC1 or HDAC2 and age found in samples ≥18 years old.
Studies clarifying molecular components—and confounding effects—of brain disease are essential in making meaningful, pragmatic gains in understanding and advanced treatment development.32 Investigation of large-scale sample sets provides a powerful advantage to identify conserved biochemical signatures that may help discriminate psychiatric disease patient groups on the basis of gene expression33 and protein modification.1,6 Prior findings and our current work provide an important comparator for emerging personalized-medicine approaches identifying disease deficits via induced pluripotent stem cells (e.g., ref (34)) or by in vivo neuroimaging (e.g., ref (18)) with a goal to develop an integrated and accurate understanding of the healthy and diseased brain, including epigenetic regulatory components.35
Early reports identified that transcriptional differences in HDAC1 were present in small postmortem SCZ cohorts compared to controls.2,3 Narayan and colleagues used microarray methods to identify differential gene expression in the schizophrenic DLPFC, implicating HDAC1 via pathway analysis.36 However, there are significant limitations in the sensitivity of microarray transcriptomics as used in prior studies compared to qRT-PCR, as we have applied herein. Further, the scale of the numerous prior studies featured substantially fewer individual samples per patient group (∼n = 20) and investigated a variety of regions comprising frontal cortex compared to our current large-scaled, DLPFC-focused study. This may be the reason that HDAC isoforms including HDAC2 did not emerge with distinct SCZ-related expression (see ref (37) and references therein). Future examination of HDAC transcript levels should take advantage of methods with even greater sensitivity (e.g., RNA-Seq).
Importantly, we note here that HDAC mRNA and protein expression is not expected to be uniform throughout the brain: as Broide and colleagues demonstrated by in situ hybridization in the rodent brain; as existing reports show for HDAC transcript and protein expression in human postmortem brain tissue; and as our recent in vivo positron emission tomography imaging with the radiotracer [11C]Martinostat demonstrates for healthy subjects.2−4,12,28 Despite the high sequence homology between HDAC1 and HDAC2, our observation that only HDAC2 is decreased in SCZ DLPFC indicates that expression—at least at the transcript level—is regulated independently. The role of localized expression and activity of HDAC subtypes has already been linked to neuro-glial development38,39 and behavioral changes in rodents.4,7,9,10,12 Additionally, HDAC1 and HDAC2 are known to function in larger protein complexes with distinct activities. For example, in rodent models the CoREST complex, which contains HDAC1 and 2, contributes to hippocampal neuron excitability,40 while the distinct NuRD-HDAC1/2 complex enhances synaptic connectivity in the cerebellum.41 Regional HDAC expression differences are therefore likely to contribute to refined and region-specific control over transcription and neural signaling. Thus, a major next step in defining the epigenetic underpinnings of brain disease is to understand the expression of HDAC complexes throughout the healthy and diseased brain, in vivo and clarify their specific regulatory impact on gene expression and brain function.
Methods
Human Post-mortem Brain Tissue Collection
Post-mortem brains were collected at the Human Brain Collection Core (HBCC), National Institute of Mental Health (NIMH), with informed consent from the legal next of kin according to the National Institutes of Health Institutional Review Board and ethical guidelines under protocol (90-M-0142), and at the Brain and Tissue Bank for Developmental Disorders of the National Institute of Child Health and Human Development (under contracts N01-HD-4-3368 and N01-HD-4-3383). Clinical characterization, neuropathological screening, toxicological analyses and dissection of the DLPFC and caudate were performed as previously described.16,33 (Additional methods are available in the Supporting Information.)
Quantitative Real-Time PCR
Total RNA was extracted from DLPFC and caudate as previously described.33 Expression levels of HDAC1 and HDAC2 were measured in the postmortem DLPFC samples and a subset of caudate samples using quantitative real-time PCR on the ABI Prism 7900 sequence detection system with 384-well format (Applied Biosystems, Carlsbad, Calif.) using Taqman assays Hs00606262_g1 for HDAC1 and Hs00231032_m1 for HDAC2. (Additional methods are available in the Supporting Information.)
Statistical Analyses
Comparisons between groups were made by analyses of covariance (ANCOVAs) for each normalized transcript expression level, with diagnosis and antemortem medication as independent variables. (Additional methods are available in the Supporting Information.)
Acknowledgments
The authors are grateful to the HBCC staff, especially Robin Kramer, Melanie Bose, and Joyce Adams, for their work in facilitating records review of samples used in this study. We also thank Drs. J. E. Kleinman and T. M. Hyde for their past involvement in the sample collection. We thank Dr. Francine Benes for helpful discussion of past and present data.
Supporting Information Available
The Supporting Information is available free of charge on the ACS Publications website at DOI: 10.1021/acschemneuro.6b00372.
Additional methodological details (tissue sample information, quantitative real-time PCR, antemortem medication, Western blotting, and statistical analysis), figure showing Western blotting experiments against HDAC1 and HDAC2 in the DLPFC of a subset of SCZ and samples and controls, and figure showing common therapeutics detected in postmortem samples (PDF)
Author Contributions
F.A.S., T.M.G., N.D.V., R.B.I., J.M.H., and B.K.L. planned experiments. F.A.S., T.M.G., N.F., B.D.T., and B.K.L. executed experiments and performed analysis. All authors contributed to writing and editing the manuscript.
Research was supported by the National Institute of Mental Health through programmatic funding to the Human Brain Collection Core (B.K.L.) and Molecular Imaging Branch (Project ZIAMH002795 to R.B.I.), by the Harvard/MGH Nuclear Medicine Training Program from the Department of Energy under Grant DE-SC0008430 (to T.M.G.), and by the National Institute of Drug Abuse of the National Institutes of Health under Grant Number R01DA030321 and the Brain and Behavior Research Foundation Independent Investigator Award (J.M.H.).
The authors declare no competing financial interest.
Supplementary Material
References
- (2015) Psychiatric genome-wide association study analyses implicate neuronal, immune and histone pathways. Nat. Neurosci. 18, 199–209. 10.1038/nn.3922. [DOI] [PMC free article] [PubMed] [Google Scholar]
- Sharma R. P.; Grayson D. R.; Gavin D. P. (2008) Histone deactylase 1 expression is increased in the prefrontal cortex of schizophrenia subjects: analysis of the National Brain Databank microarray collection. Schizophrenia research 98, 111–117. 10.1016/j.schres.2007.09.020. [DOI] [PMC free article] [PubMed] [Google Scholar]
- Benes F. M.; Lim B.; Matzilevich D.; Walsh J. P.; Subburaju S.; Minns M. (2007) Regulation of the GABA cell phenotype in hippocampus of schizophrenics and bipolars. Proc. Natl. Acad. Sci. U. S. A. 104, 10164–10169. 10.1073/pnas.0703806104. [DOI] [PMC free article] [PubMed] [Google Scholar]
- Covington H. E. 3rd; Maze I.; LaPlant Q. C.; Vialou V. F.; Ohnishi Y. N.; Berton O.; Fass D. M.; Renthal W.; Rush A. J. 3rd; Wu E. Y.; Ghose S.; Krishnan V.; Russo S. J.; Tamminga C.; Haggarty S. J.; Nestler E. J. (2009) Antidepressant actions of histone deacetylase inhibitors. J. Neurosci. 29, 11451–11460. 10.1523/JNEUROSCI.1758-09.2009. [DOI] [PMC free article] [PubMed] [Google Scholar]
- Graff J.; Rei D.; Guan J. S.; Wang W. Y.; Seo J.; Hennig K. M.; Nieland T. J.; Fass D. M.; Kao P. F.; Kahn M.; Su S. C.; Samiei A.; Joseph N.; Haggarty S. J.; Delalle I.; Tsai L. H. (2012) An epigenetic blockade of cognitive functions in the neurodegenerating brain. Nature 483, 222–226. 10.1038/nature10849. [DOI] [PMC free article] [PubMed] [Google Scholar]
- Finucane H. K.; Bulik-Sullivan B.; Gusev A.; Trynka G.; Reshef Y.; Loh P. R.; Anttila V.; Xu H.; Zang C.; Farh K.; Ripke S.; Day F. R.; Purcell S.; Stahl E.; Lindstrom S.; Perry J. R.; Okada Y.; Raychaudhuri S.; Daly M. J.; Patterson N.; Neale B. M.; Price A. L. (2015) Partitioning heritability by functional annotation using genome-wide association summary statistics. Nat. Genet. 47, 1228–1235. 10.1038/ng.3404. [DOI] [PMC free article] [PubMed] [Google Scholar]
- Jakovcevski M.; Bharadwaj R.; Straubhaar J.; Gao G.; Gavin D. P.; Jakovcevski I.; Mitchell A. C.; Akbarian S. (2013) Prefrontal cortical dysfunction after overexpression of histone deacetylase 1. Biol. Psychiatry 74, 696–705. 10.1016/j.biopsych.2013.03.020. [DOI] [PMC free article] [PubMed] [Google Scholar]
- Schroeder F. A.; Lewis M. C.; Fass D. M.; Wagner F. F.; Zhang Y. L.; Hennig K. M.; Gale J.; Zhao W. N.; Reis S.; Barker D. D.; Berry-Scott E.; Kim S. W.; Clore E. L.; Hooker J. M.; Holson E. B.; Haggarty S. J.; Petryshen T. L. (2013) A selective HDAC 1/2 inhibitor modulates chromatin and gene expression in brain and alters mouse behavior in two mood-related tests. PLoS One 8, e71323. 10.1371/journal.pone.0071323. [DOI] [PMC free article] [PubMed] [Google Scholar]
- Covington H. E. 3rd; Maze I.; Vialou V.; Nestler E. J. (2015) Antidepressant action of HDAC inhibition in the prefrontal cortex. Neuroscience 298, 329–335. 10.1016/j.neuroscience.2015.04.030. [DOI] [PMC free article] [PubMed] [Google Scholar]
- Covington H. E. 3rd; Vialou V. F.; LaPlant Q.; Ohnishi Y. N.; Nestler E. J. (2011) Hippocampal-dependent antidepressant-like activity of histone deacetylase inhibition. Neurosci. Lett. 493, 122–126. 10.1016/j.neulet.2011.02.022. [DOI] [PMC free article] [PubMed] [Google Scholar]
- Guan J. S.; Haggarty S. J.; Giacometti E.; Dannenberg J. H.; Joseph N.; Gao J.; Nieland T. J.; Zhou Y.; Wang X.; Mazitschek R.; Bradner J. E.; DePinho R. A.; Jaenisch R.; Tsai L. H. (2009) HDAC2 negatively regulates memory formation and synaptic plasticity. Nature 459, 55–60. 10.1038/nature07925. [DOI] [PMC free article] [PubMed] [Google Scholar]
- Kurita M.; Holloway T.; Garcia-Bea A.; Kozlenkov A.; Friedman A. K.; Moreno J. L.; Heshmati M.; Golden S. A.; Kennedy P. J.; Takahashi N.; Dietz D. M.; Mocci G.; Gabilondo A. M.; Hanks J.; Umali A.; Callado L. F.; Gallitano A. L.; Neve R. L.; Shen L.; Buxbaum J. D.; Han M. H.; Nestler E. J.; Meana J. J.; Russo S. J.; Gonzalez-Maeso J. (2012) HDAC2 regulates atypical antipsychotic responses through the modulation of mGlu2 promoter activity. Nat. Neurosci. 15, 1245–1254. 10.1038/nn.3181. [DOI] [PMC free article] [PubMed] [Google Scholar]
- Ookubo M.; Kanai H.; Aoki H.; Yamada N. (2013) Antidepressants and mood stabilizers effects on histone deacetylase expression in C57BL/6 mice: Brain region specific changes. J. Psychiatr. Res. 47, 1204–1214. 10.1016/j.jpsychires.2013.05.028. [DOI] [PubMed] [Google Scholar]
- Tang B.; Dean B.; Thomas E. A. (2011) Disease- and age-related changes in histone acetylation at gene promoters in psychiatric disorders. Transl. Psychiatry 1, e64. 10.1038/tp.2011.61. [DOI] [PMC free article] [PubMed] [Google Scholar]
- Colantuoni C.; Hyde T. M.; Mitkus S.; Joseph A.; Sartorius L.; Aguirre C.; Creswell J.; Johnson E.; Deep-Soboslay A.; Herman M. M.; Lipska B. K.; Weinberger D. R.; Kleinman J. E. (2008) Age-related changes in the expression of schizophrenia susceptibility genes in the human prefrontal cortex. Brain Struct. Funct. 213, 255–271. 10.1007/s00429-008-0181-5. [DOI] [PubMed] [Google Scholar]
- Lipska B. K.; Deep-Soboslay A.; Weickert C. S.; Hyde T. M.; Martin C. E.; Herman M. M.; Kleinman J. E. (2006) Critical factors in gene expression in postmortem human brain: Focus on studies in schizophrenia. Biol. Psychiatry 60, 650–658. 10.1016/j.biopsych.2006.06.019. [DOI] [PubMed] [Google Scholar]
- Vandesompele J.; De Preter K.; Pattyn F.; Poppe B.; Van Roy N.; De Paepe A.; Speleman F. (2002) Accurate normalization of real-time quantitative RT-PCR data by geometric averaging of multiple internal control genes. Genome Biol. 3, research0034.1. 10.1186/gb-2002-3-7-research0034. [DOI] [PMC free article] [PubMed] [Google Scholar]
- Mueller S.; Wang D.; Pan R.; Holt D. J.; Liu H. (2015) Abnormalities in hemispheric specialization of caudate nucleus connectivity in schizophrenia. JAMA psychiatry 72, 552–560. 10.1001/jamapsychiatry.2014.3176. [DOI] [PMC free article] [PubMed] [Google Scholar]
- Li X.; Black M.; Xia S.; Zhan C.; Bertisch H. C.; Branch C. A.; DeLisi L. E. (2015) Subcortical structure alterations impact language processing in individuals with schizophrenia and those at high genetic risk. Schizophr. Res. 169, 76. 10.1016/j.schres.2015.08.001. [DOI] [PMC free article] [PubMed] [Google Scholar]
- Zheng Y.; Wu C.; Li J.; Wu H.; She S.; Liu S.; Mao L.; Ning Y.; Li L. (2016) Brain substrates of perceived spatial separation between speech sources under simulated reverberant listening conditions in schizophrenia. Psychol. Med. 46, 477–491. 10.1017/S0033291715001828. [DOI] [PubMed] [Google Scholar]
- Tao H.; Wong G. H.; Zhang H.; Zhou Y.; Xue Z.; Shan B.; Chen E. Y.; Liu Z. (2015) Grey matter morphological anomalies in the caudate head in first-episode psychosis patients with delusions of reference. Psychiatry Res., Neuroimaging 233, 57–63. 10.1016/j.pscychresns.2015.04.011. [DOI] [PubMed] [Google Scholar]
- Greenbaum D.; Colangelo C.; Williams K.; Gerstein M. (2003) Comparing protein abundance and mRNA expression levels on a genomic scale. Genome biology 4, 117. 10.1186/gb-2003-4-9-117. [DOI] [PMC free article] [PubMed] [Google Scholar]
- Koussounadis A.; Langdon S. P.; Um I. H.; Harrison D. J.; Smith V. A. (2015) Relationship between differentially expressed mRNA and mRNA-protein correlations in a xenograft model system. Sci. Rep. 5, 10775. 10.1038/srep10775. [DOI] [PMC free article] [PubMed] [Google Scholar]
- Anderson K. W.; Chen J.; Wang M.; Mast N.; Pikuleva I. A.; Turko I. V. (2015) Quantification of histone deacetylase isoforms in human frontal cortex, human retina, and mouse brain. PLoS One 10, e0126592. 10.1371/journal.pone.0126592. [DOI] [PMC free article] [PubMed] [Google Scholar]
- Schroeder F. A.; Wang C.; Van de Bittner G. C.; Neelamegam R.; Takakura W. R.; Karunakaran A.; Wey H. Y.; Reis S. A.; Gale J.; Zhang Y. L.; Holson E. B.; Haggarty S. J.; Hooker J. M. (2014) PET Imaging Demonstrates Histone Deacetylase Target Engagement and Clarifies Brain Penetrance of Known and Novel Small Molecule Inhibitors in Rat. ACS Chem. Neurosci. 5, 1055–1062. 10.1021/cn500162j. [DOI] [PMC free article] [PubMed] [Google Scholar]
- Wang C.; Schroeder F. A.; Wey H. Y.; Borra R.; Wagner F. F.; Reis S.; Kim S. W.; Holson E. B.; Haggarty S. J.; Hooker J. M. (2014) In Vivo Imaging of Histone Deacetylases (HDACs) in the Central Nervous System and Major Peripheral Organs. J. Med. Chem. 57, 7999–8009. 10.1021/jm500872p. [DOI] [PMC free article] [PubMed] [Google Scholar]
- Wey H. Y.; Wang C.; Schroeder F. A.; Logan J.; Price J. C.; Hooker J. M. (2015) Kinetic Analysis and Quantification of [(1)(1)C]Martinostat for in Vivo HDAC Imaging of the Brain. ACS Chem. Neurosci. 6, 708–715. 10.1021/acschemneuro.5b00066. [DOI] [PMC free article] [PubMed] [Google Scholar]
- Wey H. Y.; Gilbert T. M.; Zurcher N. R.; She A.; Bhanot A.; Taillon B. D.; Schroeder F. A.; Wang C.; Haggarty S. J.; Hooker J. M. (2016) Insights into neuroepigenetics through human histone deacetylase PET imaging. Sci. Transl. Med. 8, 351ra106. 10.1126/scitranslmed.aaf7551. [DOI] [PMC free article] [PubMed] [Google Scholar]
- Strebl M. G.; Wang C.; Schroeder F. A.; Placzek M. S.; Wey H. Y.; Van de Bittner G. C.; Neelamegam R.; Hooker J. M. (2016) Development of a Fluorinated Class-I HDAC Radiotracer Reveals Key Chemical Determinants of Brain Penetrance. ACS Chem. Neurosci. 7, 528–533. 10.1021/acschemneuro.5b00297. [DOI] [PMC free article] [PubMed] [Google Scholar]
- Colantuoni C.; Lipska B. K.; Ye T.; Hyde T. M.; Tao R.; Leek J. T.; Colantuoni E. A.; Elkahloun A. G.; Herman M. M.; Weinberger D. R.; Kleinman J. E. (2011) Temporal dynamics and genetic control of transcription in the human prefrontal cortex. Nature 478, 519–523. 10.1038/nature10524. [DOI] [PMC free article] [PubMed] [Google Scholar]
- Peleg S.; Sananbenesi F.; Zovoilis A.; Burkhardt S.; Bahari-Javan S.; Agis-Balboa R. C.; Cota P.; Wittnam J. L.; Gogol-Doering A.; Opitz L.; Salinas-Riester G.; Dettenhofer M.; Kang H.; Farinelli L.; Chen W.; Fischer A. (2010) Altered histone acetylation is associated with age-dependent memory impairment in mice. Science 328, 753–756. 10.1126/science.1186088. [DOI] [PubMed] [Google Scholar]
- Berretta S.; Heckers S.; Benes F. M. (2015) Searching human brain for mechanisms of psychiatric disorders. Implications for studies on schizophrenia. Schizophrenia research 167, 91–97. 10.1016/j.schres.2014.10.019. [DOI] [PMC free article] [PubMed] [Google Scholar]
- Kunii Y.; Zhang W.; Xu Q.; Hyde T. M.; McFadden W.; Shin J. H.; Deep-Soboslay A.; Ye T.; Li C.; Kleinman J. E.; Wang K. H.; Lipska B. K. (2015) CHRNA7 and CHRFAM7A mRNAs: Co-Localized and Their Expression Levels Altered in the Postmortem Dorsolateral Prefrontal Cortex in Major Psychiatric Disorders. Am. J. Psychiatry 172, 1122–1130. 10.1176/appi.ajp.2015.14080978. [DOI] [PubMed] [Google Scholar]
- Madison J. M.; Zhou F.; Nigam A.; Hussain A.; Barker D. D.; Nehme R.; van der Ven K.; Hsu J.; Wolf P.; Fleishman M.; O’Dushlaine C.; Rose S.; Chambert K.; Lau F. H.; Ahfeldt T.; Rueckert E. H.; Sheridan S. D.; Fass D. M.; Nemesh J.; Mullen T. E.; Daheron L.; McCarroll S.; Sklar P.; Perlis R. H.; Haggarty S. J. (2015) Characterization of bipolar disorder patient-specific induced pluripotent stem cells from a family reveals neurodevelopmental and mRNA expression abnormalities. Mol. Psychiatry 20, 703–717. 10.1038/mp.2015.7. [DOI] [PMC free article] [PubMed] [Google Scholar]
- Nestler E. J.; Pena C. J.; Kundakovic M.; Mitchell A.; Akbarian S. (2016) Epigenetic Basis of Mental Illness. Neuroscientist 22, 447–463. 10.1177/1073858415608147. [DOI] [PMC free article] [PubMed] [Google Scholar]
- Narayan S.; Tang B.; Head S. R.; Gilmartin T. J.; Sutcliffe J. G.; Dean B.; Thomas E. A. (2008) Molecular profiles of schizophrenia in the CNS at different stages of illness. Brain Res. 1239, 235–248. 10.1016/j.brainres.2008.08.023. [DOI] [PMC free article] [PubMed] [Google Scholar]
- Hagihara H.; Ohira K.; Takao K.; Miyakawa T. (2014) Transcriptomic evidence for immaturity of the prefrontal cortex in patients with schizophrenia. Mol. Brain 7, 41. 10.1186/1756-6606-7-41. [DOI] [PMC free article] [PubMed] [Google Scholar]
- MacDonald J. L.; Roskams A. J. (2008) Histone deacetylases 1 and 2 are expressed at distinct stages of neuro-glial development. Dev. Dyn. 237, 2256–2267. 10.1002/dvdy.21626. [DOI] [PubMed] [Google Scholar]
- Montgomery R. L.; Hsieh J.; Barbosa A. C.; Richardson J. A.; Olson E. N. (2009) Histone deacetylases 1 and 2 control the progression of neural precursors to neurons during brain development. Proc. Natl. Acad. Sci. U. S. A. 106, 7876–7881. 10.1073/pnas.0902750106. [DOI] [PMC free article] [PubMed] [Google Scholar]
- Rusconi F.; Paganini L.; Braida D.; Ponzoni L.; Toffolo E.; Maroli A.; Landsberger N.; Bedogni F.; Turco E.; Pattini L.; Altruda F.; De Biasi S.; Sala M.; Battaglioli E. (2015) LSD1 Neurospecific Alternative Splicing Controls Neuronal Excitability in Mouse Models of Epilepsy. Cerebral cortex 25, 2729–2740. 10.1093/cercor/bhu070. [DOI] [PubMed] [Google Scholar]
- Yamada T.; Yang Y.; Hemberg M.; Yoshida T.; Cho H. Y.; Murphy J. P.; Fioravante D.; Regehr W. G.; Gygi S. P.; Georgopoulos K.; Bonni A. (2014) Promoter decommissioning by the NuRD chromatin remodeling complex triggers synaptic connectivity in the mammalian brain. Neuron 83, 122–134. 10.1016/j.neuron.2014.05.039. [DOI] [PMC free article] [PubMed] [Google Scholar]
Associated Data
This section collects any data citations, data availability statements, or supplementary materials included in this article.