

Abstract
In obesity, white adipose tissue (AT) inflammation is associated with reduced beige adipogenesis, a thermogenic and energy-dissipating function mediated by uncoupling protein-1 (UCP1)-expressing beige adipocytes. Here, we dissected an inflammation-driven inhibitory mechanism of beige adipogenesis in obesity that required direct adhesive interactions between macrophages and adipocytes mediated, respectively, by α4 integrin and its counter-receptor VCAM-1, the expression of which was upregulated in obesity. This adhesive interaction reciprocally and concomitantly modulated inflammatory activation in macrophages and Erk-dependent downregulation of UCP1 in adipocytes. Genetic or pharmacologic inactivation of α4 integrin in mice resulted in elevated UCP1 expression and beige adipogenesis of the subcutaneous AT in obesity. Our findings, established in both mouse and human systems, reveal a self-sustained cycle of inflammation-driven impairment of beige adipogenesis in obesity.
INTRODUCTION
The accumulation of macrophages in the obese adipose tissue (AT) and their polarization into classically activated (inflammatory) M1 cells are critically involved in AT inflammation and metabolic dysregulation in obesity1,2. In contrast to the extensively studied chemokine-driven monocyte/macrophage recruitment to the AT3,4,5, little information exists about mechanisms contributing to macrophage retention in the AT6. The close proximity of inflammatory macrophages with adipocytes in the obese AT, especially in regions designated “crown-like structures”1, suggests that direct macrophage-adipocyte adhesive interactions may constitute a macrophage retention mechanism in the AT. Direct adhesive interactions between immune and other cell types are largely mediated by leukocyte integrins7. However, whether integrin-dependent adhesion mediates macrophage retention in the obese AT and contributes to inflammation-related metabolic dysregulation in obesity has not been yet investigated.
Besides serving as energy-storage organ, the white AT plays a homeostatic role in energy dissipation. The energy-dispensing function of the AT is mediated by upregulation of uncoupling protein-1 (UCP1), which uncouples oxidative phosphorylation from ATP synthesis and thereby induces thermogenic activity in the white AT8,9,10. This function is largely attributed to a recently identified subtype of “beige” adipocytes. These cells inducibly express UCP1, principally in response to cold exposure, and thus share functional properties of brown adipocytes, e.g., thermogenic capacity9,11,12,13. As beige fat also exists in humans13, beige adipogenesis represents a potentially important therapeutic target in obesity13. Beige adipogenesis may derive from generation of beige adipocytes from committed progenitors but also from transdifferentiation of white adipocytes into beige cells9. Interestingly, cells of type 2 immunity stimulate beige adipogenesis in the lean AT14.
Intriguingly, the expression of UCP1 and the energy-dissipating activity of the white AT are diminished in adiposity15,16,17, although the mechanistic underpinnings involved remain obscure. Exacerbated inflammation, including a shift from M2 towards a predominantly pro-inflammatory M1 macrophage state, is a hallmark of obese white AT1,2. Yet, little evidence exists that inflammation can impede thermogenic beige adipogenesis in obesity18. Hypothetically, inflammatory macrophages in the obese AT may secrete factors that interfere with beige adipogenesis. Alternatively or additionally, given the proximity of macrophages and adipocytes in obese AT, adhesive interactions between these two cell types could conceivably contribute to inhibition of beige adipogenesis. This hypothesis was confirmed in the present study, which demonstrated that the interaction between α4 integrin7 on M1-polarized inflammatory macrophages and its counter-receptor vascular cell adhesion molecule-1 (VCAM-1) on adipocytes in the obese AT initiates a self-sustained inflammatory cycle that downregulates UCP1 expression in adipocytes in an extracellular signal-regulated kinase (Erk)-dependent manner. Conversely, genetic or pharmacological blockage of α4 integrin led to elevated beige adipogenesis and prevented metabolic dysregulation of the obese AT.
RESULTS
Macrophage-adipocyte adhesive interactions in obese AT
To study macrophage-adipocyte interactions in the obese AT, we focused on integrin adhesion receptors involved in leukocyte trafficking and cell-cell adhesion19. In this regard, the integrins α4β1 and αLβ2 are major players mediating the adhesive functions of monocytes and macrophages by recognizing their counter-receptors VCAM-1 and ICAM-1, respectively, on target cells7,20. We performed adoptive transfer experiments to identify those integrin receptors involved in macrophage accumulation in obese AT. To bypass embryonic lethality of α4 integrin (Itga4) deletion, we engaged mice with inducible hematopoietic Itga4 deficiency21, which were generated by breeding Itga4f/f mice with Mx1-Cre-transgenic mice, in which Cre activity is induced by poly I:C21. Cre-recombinase is induced in several tissues in Mx1-Cre-transgenic mice, however, the main Cre-recombinase activity is shown in hematopoietic system and liver22,23. Itga4 is predominantly expressed in hematopoietic cells21,24,25, whereas Itga4 expression in isolated liver parenchymal cells was comparably very low (data not shown). After poly I:C administration, robust reduction of α4 integrin expression in bone marrow-isolated monocytes from mice with inducible genetic excision of Itga4 (hereafter Cre+α4f/f) was observed (Supplementary Fig. 1a), consistent with a previous report involving Mx1-Cre+Itga4f/f mice21.
For adoptive transfer, dye-labeled bone marrow-isolated CD11b+ monocytes from Cre+α4f/f mice21, and monocytes from littermate Itga4-sufficient control mice (Cre−α4f/f), or monocytes from αL integrin-deficient and -proficient mice26 were simultaneously injected, at a 1:1 competitive fashion, into diet-induced obese wild-type mice. Seven days thereafter, we analyzed accumulation and retention of administered cells in the AT; the majority of adoptively transferred monocytes that had accumulated in the obese AT had acquired macrophage markers. Accumulation of macrophages in both obese visceral and inguinal subcutaneous AT (VAT and SAT, respectively) was dependent on α4 but not αL integrin expression (Fig. 1a and data not shown). The reduced accumulation of Itga4-deficient macrophages in the SAT and VAT of obese wild-type mice, as compared to Itga4-sufficient macrophages, was accompanied by significantly enhanced numbers of Itga4-deficient monocytes/macrophages in the draining lymph nodes of both SAT and VAT (Fig. 1b). These findings suggested that α4 integrin-deficient macrophages had egressed from SAT and VAT, and hence had reduced retention therein. In contrast, T lymphocyte accumulation in the obese SAT or VAT was independent of their α4 integrin expression (Fig. 1c).
Figure 1. The α4 integrin—VCAM-1 interaction mediates direct macrophage-adipocyte interactions.
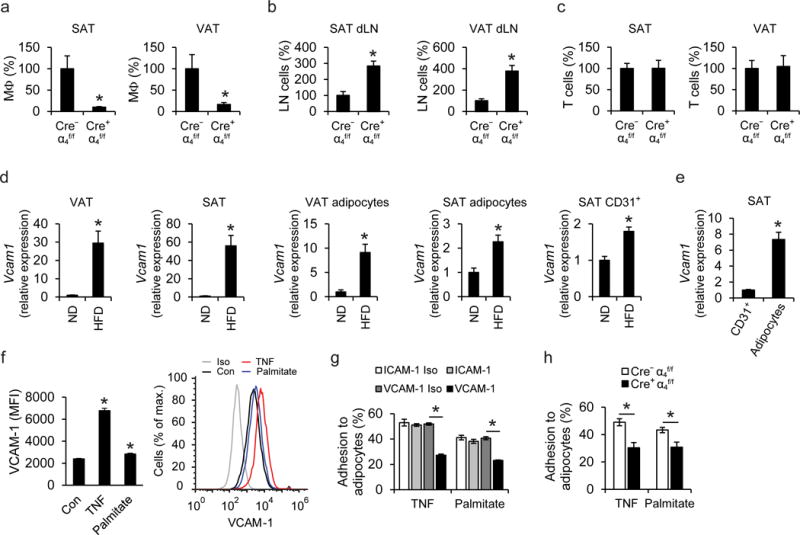
a–c) Adoptive transfer experiments; a 1:1 mixture of PKH26-red labeled Cre−α4f/f and PKH67-green labeled Cre+α4f/f cells (monocytes or splenic T cells) was simultaneously transferred into obese wild-type mice. The numbers of Cre−α4f/f and Cre+α4f/f macrophages (a) or T cells (c) accumulated in inguinal subcutaneous adipose tissue (SAT) or visceral adipose tissue (VAT) and the numbers of Cre−α4f/f and Cre+α4f/f monocytes/macrophages accumulated in the lymph nodes draining the SAT (SAT dLN) and lymph nodes draining the VAT (VAT dLN) (b) were analyzed by flow cytometry. Data (percentage of labeled cells in defined cells) are presented as relative to control. The percentage of labeled Cre−α4f/f cells in defined cells was set as 100% in each tissue; n=5 recipient mice in a,b and n=4 recipient mice in c; data in (b) are from one experiment, data in (a), (c) are representative of two experiments. d) Vcam1 mRNA expression was determined in VAT and SAT of lean mice, fed a normal diet (ND, n=8 mice) or obese mice (fed a HFD, n=10 mice), in mature adipocytes from VAT and SAT of lean (ND, n=6 mice) or obese mice (HFD, n=6 mice), and in CD31+ endothelial cells from SAT of lean (ND, n=5 mice) or obese mice (HFD, n=6 mice). 18S expression was used for normalization and Vcam1 expression of ND-fed mice was set as 1 in each case. Data are from one experiment (SAT endothelial cells) or representative of two experiments (VAT, SAT, VAT adipocytes, SAT adipocytes). (e) Comparison of Vcam1 mRNA expression between CD45−CD31+ endothelial cells and adipocytes from SAT of obese mice is shown. Vcam1 expression of endothelial cells was set as 1; n=6 mice; data are from one experiment. f) Primary mouse adipocytes were treated without (control; Con) or with TNF or palmitate. The surface expression of VCAM-1, expressed as Median Fluorescence Intensity (MFI) units, analyzed by flow cytometry, is shown (n=6 separate cell isolations; data are representative of two experiments). In the right panel, a representative flow cytometry plot depicting VCAM-1 expression of Control-, TNF-, or palmitate-treated adipocytes, as well as isotype control (Iso), is shown. g) Adhesion assay of bone marrow mononuclear cells (BMM) to TNF- or palmitate-pretreated 3T3-L1 adipocytes was performed in the presence of ICAM-1- or VCAM-1-blocking antibodies or respective isotype controls (ICAM-1 Iso or VCAM-1 Iso). The percentage of adherent cells is shown. Shown is one experiment performed in triplicate; representative of 3 experiments. h) Adhesion of BMM from Cre+α4f/f or Cre−α4f/f mice to TNF- or palmitate-pretreated 3T3-L1 adipocytes (data from separate BMM isolations from n=6 Cre+α4f/f mice and n=8 Cre−α4f/f mice; pooled from 3 experiments). The percentage of adherent cells is shown.
Data are presented as mean ± SEM. *P < 0.05. Mann-Whitney U-test in (a), (c), (d), (e), (f), Student’s t-test in (b), (g), (h).
To further elucidate the role of α4 integrin for macrophage retention in the obese AT, we analyzed the expression of VCAM-1, the major counter-receptor of α4β127. Constitutive expression of Vcam1 was observed in the lean SAT and VAT. Vcam1 expression was massively upregulated in both SAT and VAT upon diet-induced obesity (DIO) with high-fat diet (HFD) (Fig. 1d). The AT upregulation of Vcam1 was predominantly attributed to its increased expression in adipocytes rather than in endothelial cells (Fig. 1d). Adipocyte Vcam1 expression in the obese SAT was considerably higher than endothelial Vcam1 expression (Fig. 1e). VCAM-1 was detectable in both 3T3-L1 and primary adipocytes, and its expression was upregulated upon treatment with tumor necrosis factor (TNF) or palmitate, both being hallmark factors of the obese AT environment1,4 (Fig. 1f and data not shown). We therefore hypothesized that the interaction between α4 integrin and VCAM-1 could mediate adhesion of macrophages to adipocytes in the obese AT. Indeed, adhesion of bone marrow-derived mononuclear cells onto adipocytes in vitro was blocked by antibody to VCAM-1 but not antibody to ICAM-1 (Fig. 1g). Consistently, α4 integrin-deficient mononuclear cells displayed reduced adhesion to adipocytes, compared to α4 integrin-proficient cells (Fig. 1h). Together, macrophage-adipocyte adhesion is dependent on the α4 integrin-VCAM-1 interaction and α4 integrin mediates retention of macrophages in the obese AT.
Itga4 deficiency reduces metabolic dysfunction in DIO
We then determined whether the α4 integrin-mediated adhesive interaction between macrophages and adipocytes in the obese AT contributes to DIO-related metabolic dysregulation. Mice lacking o 4 integrin (Cre+α4f/f) and littermate control α4 integrin-proficient mice (Cre−α4f/f) were fed a HFD. By flow cytometry we observed robust deletion of α4 integrin in circulating monocytes and macrophages from the AT of Cre+α4f/f mice (Supplementary Fig. 1b,c). Obese Cre+α4f/f and Cre−α4f/f mice displayed no differences in terms of body weight gain, fat mass or liver, SAT or VAT weight (Fig. 2a,b and Supplementary Fig. 2a). Similarly, HFD-fed Cre+α4f/f mice displayed no significant changes in the adipocyte size of VAT or SAT as compared to Cre−α4f/f mice (Supplementary Fig. 2b). However, Cre+α4f/f) mice in DIO displayed improved insulin sensitivity and reduced glucose concentrations (though unaltered triglyceride or cholesterol concentrations) as compared to Cre−α4f/f mice (Fig. 2c,d and Supplementary Fig. 2c). No difference in insulin sensitivity between Cre+α4f/f and Cre−α4f/f mice under normal diet conditions was observed (data not shown).
Figure 2. Deficiency of α4 integrin ameliorates macrophage accumulation in obese AT and alleviates obesity-associated insulin resistance.
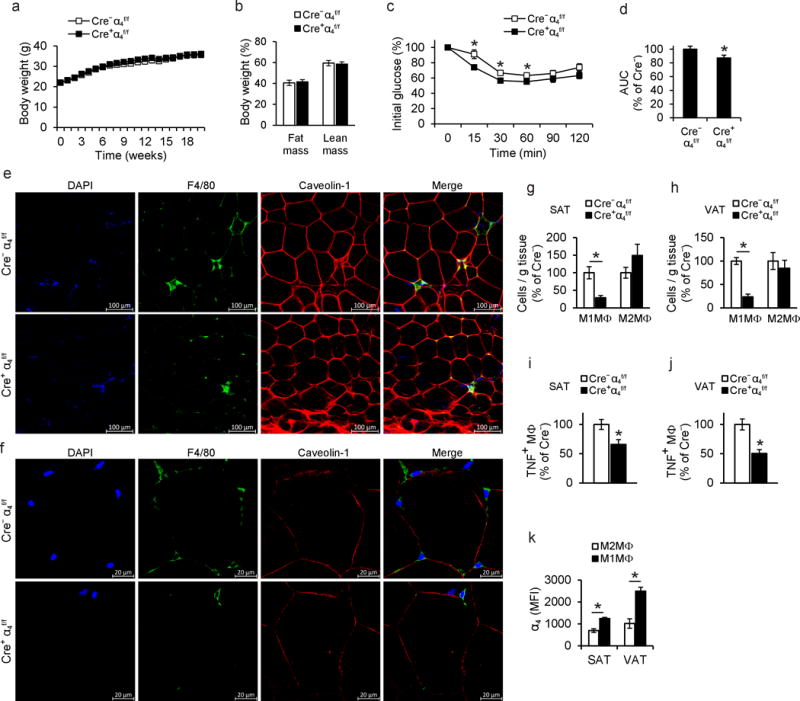
a) Body weight of Cre+α4f/f (n=14 mice) or Cre−α4f/f (n=15 mice) mice fed a HFD. b) Lean and fat mass of Cre+α4f/f (n=6 mice) and Cre−α4f/f (n=6 mice) mice were determined by micro-CT at the end of the feeding period. c) Insulin tolerance test (ITT) of obese Cre+α4f/f (n=14 mice) or Cre−α4f/f (n=15 mice) mice. d) Data obtained from ITT (c) are also presented as area under the curve (AUC). Data are presented as relative to control (Cre−α4f/f mice), which was set as 100%. e–f) Representative confocal microscopy images of SAT from obese Cre+α4f/f or Cre−α4f/f mice. Crown like structures (CLS) (e) and non-CLS-associated macrophages (f) in SAT are shown by staining for macrophages (F4/80, green), adipocytes (caveolin-1, red) and nuclei (DAPI, blue). g–h) Stromal vascular fraction (SVF) cells from (g) SAT (n=7 mice for Cre+α4f/f and n=4 mice for Cre−α4f/f) and (h) VAT (n=7 mice for Cre+α4f/f, and n=5 mice for Cre−α4f/f) of obese Cre+α4f/f and Cre−α4f/f mice were isolated and analyzed by flow cytometry. M1-like pro-inflammatory macrophages (M1MΦ) were defined as F4/80+CD11b+CD206−iNOS+ and M2-like anti-inflammatory macrophages (M2MΦ) were defined as F4/80+CD11b+CD206+iNOS−. Data are presented as relative to control; the numbers of M1MΦ/gram tissue or M2MΦ/gram tissue from Cre−α4f/f mice were set as the 100% control in each case. i–j) TNF expression of macrophages in (i) SAT (n=7 mice for Cre+α4f/f and n=4 mice for Cre−α4f/f) and (j) VAT (n=7 mice for Cre+α4f/f, and n=5 mice for Cre−α4f/f) of obese Cre+α4f/f and Cre−α4f/f mice was analyzed by flow cytometry. Data (percentage of TNF-positive macrophages, defined as CD45+F4/80+CD11b+ cells) are presented as relative to control (Cre−α4f/f mice) which was set as 100%. k) The SVF from SAT and VAT of obese wild type mice (n=4 mice) was prepared and the amount of α4 integrin, expressed as MFI units, was determined by flow cytometry in M1-like (F4/80+CD11b+CD206−iNOS+) or M2-like (F4/80+CD11b+CD206+iNOS−) macrophages.
Data are presented as mean ± SEM. Data in (a), (c) and (d) are pooled from 5 experiments; data in (b) are pooled from 2 experiments; data in (g), (h), (i), (j) are representative of 2 experiments; data in (k) are from one experiment. In (e) and (f) representative images are from analysis performed on 3–4 mice per genotype. *P < 0.05. Student’s t-test in (a)–(d) and (h), Mann-Whitney U-test in (g), (i), (j), (k).
To study macrophage accumulation and retention in the AT of obese Cre+α4f/f and Cre−α4f/f mice, we performed immunofluorescence staining (using caveolin-1 and F4/80 to stain adipocytes6,28 and macrophages, respectively) followed by confocal microscopy of the obese SAT from Cre+α4f/f and Cre−α4f/f mice. We found that the abundance of crown-like structures (CLS) as well as of non-CLS-associated macrophages in proximity to adipocytes was reduced in the obese AT as a result of Itga4 deletion (Fig. 2e,f). These findings were independently verified by immunohistochemistry analysis of F4/80-labeled macrophages and histological quantification, which demonstrated a significant reduction in CLS numbers and numbers of non-CLS-associated macrophages in contact with adipocytes in obese SAT resulting from loss of α4 integrin expression (Supplementary Fig. 3a,b).
To further substantiate our hypothesis that α4 integrin mediates macrophage-adipocyte interactions in the obese AT, we quantified the area of contact of macrophages to adipocytes, as a measure of macrophage-adipocyte adhesion. This analysis revealed that macrophages had reduced contact to adipocytes as a result of Itga4 deletion (Supplementary Fig. 3c). Moreover, 3D-reconstruction of macrophage-adipocyte interactions verified the decreased contact of macrophages to and spreading on adipocytes in Cre+α4f/f mice, compared to littermate Cre−α4f/f mice (Supplementary Fig. 4a–d). These effects were likely independent of netrin-1, which contributes to macrophage retention in the obese AT6, since Itga4 deletion did not affect Ntn1 expression in the obese SAT or VAT (Supplementary Fig. 5a–b).
To characterize the inflammatory milieu of the SAT and VAT of obese Cre+α4f/f and Cre−α4f/f mice, we studied the abundance of pro-inflammatory M1-like macrophages and of M2-like macrophages, defined by flow cytometry as F4/80+CD11b+iNOS+CD206− and F4/80+CD11b+iNOS−CD206+, respectively. We found significantly lower numbers of M1 macrophages in both SAT and VAT of obese Cre+α4f/f mice, as compared to their littermate controls, while the numbers of M2 macrophages in the obese AT remained unaffected by Itga4 deletion (Fig. 2g,h). These findings were confirmed by flow cytometry staining of inflammatory macrophages as F4/80+CD11b+CD11c+CD206− and M2-like macrophages as F4/80+CD11b+CD11c−CD206+ (data not shown); CD11c has been previously used as a marker of inflammatory AT macrophages29. Furthermore, the decreased M1 macrophage abundance in both VAT and SAT of Cre+α4f/f mice, compared to Cre−α4f/f mice, was confirmed by the reduced numbers of TNF-expressing macrophages (Fig. 2i,j). In wild-type mice, M1-like macrophages from obese SAT and VAT displayed higher expression of α4 integrin, as compared to M2-like macrophages (Fig. 2k). These data suggest that α4 integrin mediates direct macrophage adhesion to VCAM-1-expressing adipocytes and thereby inflammatory macrophage retention within the obese AT, AT inflammation and insulin resistance.
Cre+α4f/f mice in DIO have enhanced beige adipogenesis
To understand the improved metabolic phenotype of α4 integrin-deficient mice, we performed metabolic cage analysis. Cre+α4f/f mice in DIO displayed enhanced energy expenditure, as compared to littermate Cre−α4f/f mice (Fig. 3a) although no difference was detected in respiratory exchange ratio (data not shown). The absence of body weight difference in DIO between Cre−α4f/f and Cre+α4f/f mice, despite the increased energy expenditure of Cre+α4f/f mice, could be attributed to increased food intake by these mice (Supplementary Fig. 6a).
Figure 3. Deficiency of α4 integrin promotes beige adipogenesis of white AT in obesity.
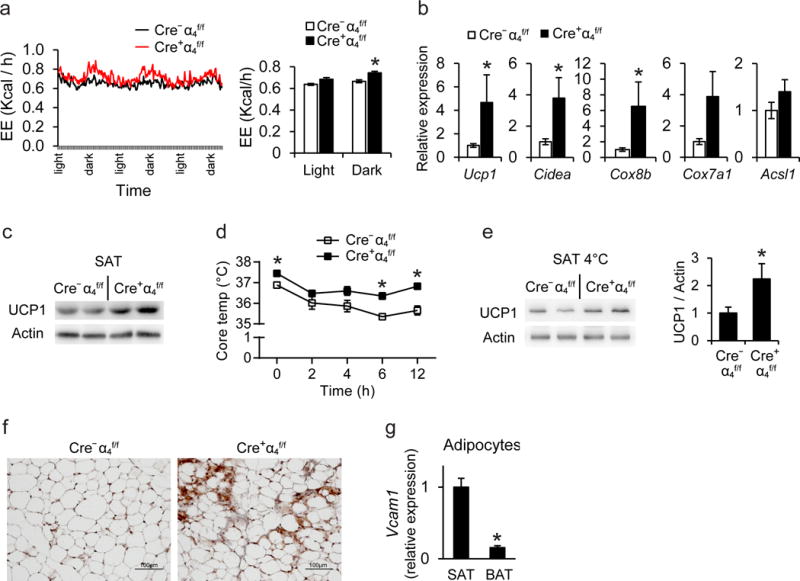
a) Energy expenditure (EE, expressed as kcal/h) of obese Cre+α4f/f (n=4 mice) and Cre−α4f/f (n=5 mice) mice was assessed by a metabolic cage monitoring system for 3 days (left). Average EE in light and dark period is also displayed (right). b) Gene expression in SAT of obese Cre+α4f/f or Cre−α4f/f mice was evaluated by qPCR (n=8 mice for Cre+α4f/f and 10–11 mice for Cr−α4f/f). 18S expression was used for normalization of mRNA expression and the respective gene expression of obese Cre−α4f/f mice was set as 1. c) Representative cropped blot images showing immunoblotting for UCP1 (and actin) in SAT from 2 obese Cre+α4f/f and 2 Cre−α4f/f mice. Actin was used as loading control. d–f) Obese Cre+ α4f/for Cre−α4f/f mice were challenged with a temperature of 4°C for 12 h. d) Core temperature of obese Cre+ α4f/f (n=4 mice) or Cre−α4f/f (n=6 mice) mice during cold exposure. e) Representative cropped blot images showing immunoblotting (left) for UCP1 (and actin) in SAT of 2 obese Cre+ α4f/fand 2 obese Cre−α4f/f mice exposed to cold. Densitometric analysis (right) of UCP1 immunobloting from a total of 4 Cre+ α4f/f mice and 5 Cre−α4f/f mice is shown. The protein amounts of UCP1 were normalized against actin; the UCP1 amounts (normalized over actin) in SAT from Cre−α4f/f mice were set as 1. f) UCP1 staining in SAT from Cre+α4f/f or Cre−α4f/f mice exposed to cold. g) Mature white and brown adipocytes were isolated from SAT and BAT of obese mice (n=6 mice) after tissue digestion and Vcam1 mRNA expression was determined. 18S expression was used for normalization and Vcam1 expression of SAT was set as 1. Data are presented as mean ± SEM. Data in (a), (d) and (e) are from one experiment; data in (b) are pooled from 3 experiments; data in (c) and (g) are representative of 2 experiments. In (f) representative images are from analysis performed on 5 −α4f/f and 4 Cre+α4f/f mice. *P < 0.05. ANCOVA in (a) and Mann-Whitney U-test in (b)–(g).
Abbreviations: Ucp1, uncoupling protein 1; Cidea, cell death-inducing DNA fragmentation factor-like effector A; Cox8b, cytochrome c oxidase subunit 8b; Cox7a1, Cytochrome c oxidase subunit 7A1; Acsl1, acyl-CoA synthetase long-chain family member 1
To elucidate the finding of increased energy expenditure in obese Cre+α4f/f mice, we assessed the expression of thermogenic genes in white or brown AT. Both mRNA and protein expression of the major thermogenic gene Ucp1, and mRNA expression of brown fat identity genes (Cidea, Cox8b) were upregulated in SAT of Cre+α4f/f mice (Fig. 3b,c). Consistently, cold (4°C)-challenged Cre+α4f/f mice sustained a higher core temperature, accompanied by enhanced expression of the key thermogenic protein UCP1, as compared to littermate control mice (Fig. 3d,e). Immunohistochemical analysis for UCP1 revealed increased presence of beige adipogenesis areas in SAT of cold-exposed Cre+α4f/f compared to Cre−α4f/f mice (Fig. 3f). Although Itga4 deletion enhanced beige adipogenesis in the SAT of obese mice, it had no effect on thermogenic gene expression in the VAT, or on thermogenic gene expression and UCP1 protein abundance, as assessed by immunohistochemistry, in the brown AT (BAT) (Supplementary Fig. 6b,c). To address this difference, we compared SAT and BAT for Vcam1 expression and found it much higher in the adipocytes of the obese SAT than in those from obese BAT (Fig. 3g). This finding provides an explanation as to why Itga4 deletion predominantly increased thermogenic beige adipogenesis in obese SAT, without affecting thermogenic gene expression in BAT. Therefore, the increased energy dissipation activity of obese Cre+α4f/f mice derived from a more thermogenic SAT.
Pharmacologic α4 integrin inhibition in obesity
As increased beige adipogenesis of the white AT is linked to improved metabolic control, approaches to stimulate white fat beiging have emerged as an attractive anti-obesity therapeutic strategy30. We therefore assessed the therapeutic potential of pharmacologic α4 integrin inhibition in wild-type mice that received an α4 integrin-inhibitor, which preferentially blocks α4β1 or vehicle control via mini-osmotic pumps for 6 weeks after establishment of DIO. DIO mice receiving the α4-inhibitor exhibited improved insulin sensitivity and lower concentrations of serum insulin, glucose and cholesterol as compared to control-treated mice (Fig. 4a–c). Confocal microscopy analysis of obese SAT revealed that α4 integrin inhibition reduced the abundance of macrophages in contact with adipocytes (Fig. 4d). Histological quantification demonstrated that numbers of both CLS and of non-CLS-associated macrophages in proximity to adipocytes in the SAT were significantly decreased by α4 integrin blockade (Fig. 4e). Moreover, flow cytometry analysis revealed that the abundance of M1-like macrophages (defined as F4/80+CD11b+iNOS+CD206−) was significantly lower in the SAT of obese mice receiving the α4-inhibitor, as compared to control treated mice, whereas the numbers of M2-like macrophages in the obese SAT remained unaffected by α4 integrin blockade (Fig. 4f). Furthermore, α4 integrin inhibition in DIO mice led to enhanced beige adipogenesis of the SAT, as evidenced by elevated mRNA and protein expression of UCP1 in the SAT (Fig. 5a,b) but not in VAT (data not shown).
Figure 4. Pharmacologic inhibition of α4 integrin ameliorates obesity-related metabolic dysregulation and enhances beige adipogenesis in SAT.
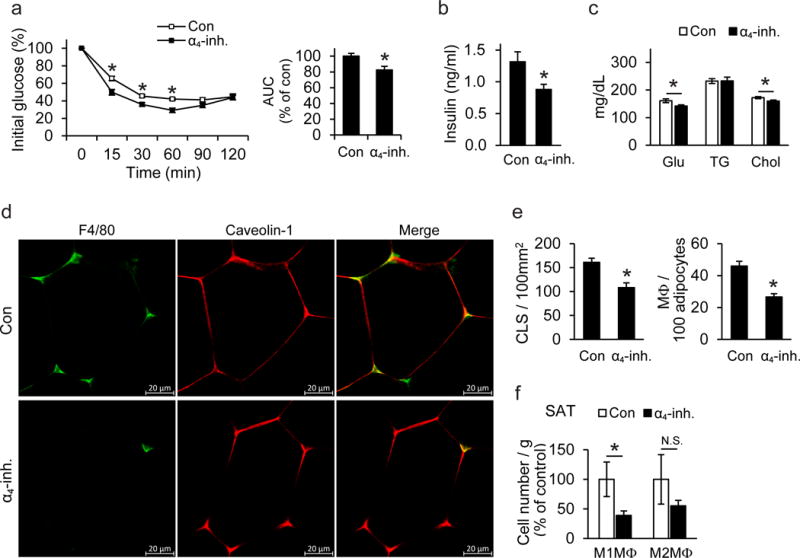
After establishment of DIO, C57BL/6 mice were implanted with an Alzet osmotic pump for continuous administration of α4-inhibitor (α4-inh.) or vehicle (Con) for 6 more weeks. a) Left: Insulin tolerance test (ITT) of control- (n=10 mice) or α4-inhibitor-treated (n=9 mice) mice 5 weeks after pump implantation. Right: Data obtained from ITT are presented as area under the curve (AUC); data are presented as relative to control (Con) which was set as 100%. b–c) Fasting plasma insulin (b), fasting blood glucose (Glu), triglyceride (TG), and cholesterol (Chol) (c) from control- (n=10 mice) or α4-inhibitor-treated (n=9 mice) mice were measured at the end of the feeding. d) Confocal microscopy images of SAT from α4-inhibitor (α4-inh.)-or vehicle (Con)-treated mice. Non-CLS-associated macrophages in SAT are shown by staining for macrophages (F4/80, green) and adipocytes (caveolin-1, red). e) Quantification of CLS numbers and of non-CLS-associated macrophages in SAT from α4-inhibitor (α4-inh, n=5 mice)- or vehicle- (Con, n=5 mice)-treated mice in sections stained immunohistochemically for F4/80. Shown are the number of CLS per 100 mm2 of tissue and the number of non-CLS-associated macrophages per 100 adipocytes. f) The stromal vascular fraction (SVF) from SAT of control- (n=4 mice) or α4-inhibitor-treated (n=5 mice) obese wild-type mice was isolated 6 weeks after pump implantation and pro-inflammatory M1-like macrophages (M1MΦ, F4/80+CD11b+CD206−iNOS+) and M2-like anti-inflammatory macrophages (M2MΦ, defined as F4/80+CD11b+CD206+iNOS−) were analyzed by flow cytometry. Data are presented as relative to control; the numbers of M1MΦ/gram tissue or M2MΦ/gram tissue from control-treated mice were set as the 100% control in each case.
Data are presented as mean ± SEM. Data in (a)–(c) and (e)–(f) are from one experiment. In (d) representative images are from analysis performed on 3 mice per treatment group. *P < 0.05. Student’s t-test in (b), (e) and Mann-Whitney U-test in (a), (c), (f).
Figure 5. UCP1 is essential for the beneficial effects of pharmacological inhibition of α4 integrin on beige adipogenesis.
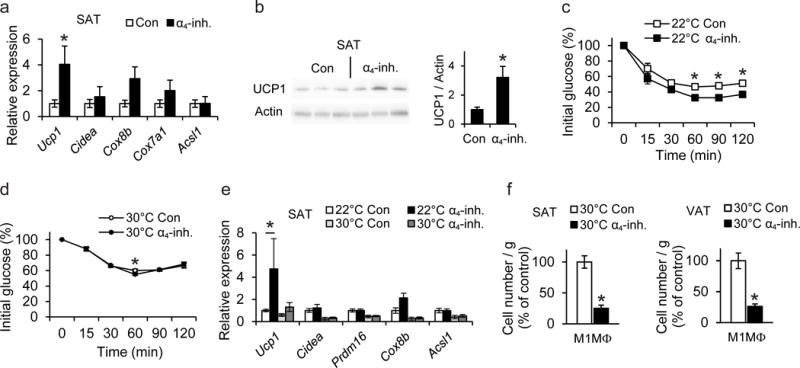
a–b) After establishment of DIO, C57BL/6 mice were treated with α4-inhibitor (α4-inh.) or vehicle (Con) for 6 more weeks. a) Expression of mRNA of thermogenesis-related genes in SAT of control- or α4-inhibitor-treated mice (n=6 mice per group). 18S expression was used for normalization and the respective gene expression of control-treated mice was set as 1. b) Representative cropped blot images showing immunoblotting (left) of UCP1 (and actin) in SAT of 3 control- and 3 α4-inhibitor-treated mice. Densitometric analysis (right) of UCP1 immunoblotting from a total of 6 control- and 6 α4-inhibitor-treated mice is shown. The protein amounts of UCP1 were normalized against actin; the UCP1 amounts (normalized over actin) in SAT from control-treated mice were set as 1. c–f) After 4 weeks on HFD, wild-type C57BL/6 mice were implanted with an Alzet osmotic pump, delivering α4-inhibitor (α4-inh.) or vehicle (Con). After pump implantation, each group of mice (α4-inh. or Con) was divided into two subgroups and the feeding was continued for another 4 weeks at 22°C or 30°C (thermoneutrality). c–d) Insulin tolerance tests (ITT) from mice 4 weeks after pump implantation are shown (n=6 mice/group and n=8 mice/group for 22°C and 30°C, respectively). e) The mRNA expression of thermogenic genes in SAT of α4-inh.-treated or control-treated mice at 22°C or 30°C was analyzed at the end of the feeding period. 18S expression was used for normalization and the respective gene expression of control-treated mice maintained at 22°C was set as 1 (22°C - Con, n=6 mice; 22°C - α4-inh., n=6 mice; 30°C - Con, n=8 mice; 30°C - α4-inh., n=8 mice). f) The SVF from SAT and VAT of control- or α4-inhibitor-treated obese wild-type mice maintained under thermoneutrality conditions, was isolated at the end of the experiment and M1-like macrophages (M1MΦ, F4/80+CD11b+CD206−iNOS+) were analyzed by flow cytometry. Data are presented as relative to control; the numbers of M1MΦ/gram tissue from control-treated mice were set as the 100% control in each case (Con, n=6 mice; α4-inh., n=7 mice in SAT; Con, n=5 mice; α4-inh., n=7 mice in VAT).
Data are presented as mean ± SEM. Data in (a)–(b) are representative of 2 experiments; data in (c)–(f) are from one experiment. *P < 0.05. Mann-Whitney U-test in (a)–(f). Abbreviations: Ucp1, uncoupling protein 1; Cidea, cell death-inducing DNA fragmentation factor-like effector A; Cox8b, cytochrome c oxidase subunit 8b; Cox7a1, Cytochrome c oxidase subunit 7A1; Acsl1, acyl-CoA synthetase long-chain family member 1; Prdm16, PR (PRD1-BF1-RIZ1 homologous)-domain containing 16
The α4-inhibitor was also tested in ob/ob mice, a model of genetically induced obesity. The α4-inhibitor-treated ob/ob mice displayed improved insulin sensitivity, which was accompanied by enhanced thermogenesis, increased UCP1 protein expression, and ameliorated inflammatory macrophage accumulation in the SAT (Supplementary Fig. 7a–d). Together, our findings suggest that functional inactivation of α4 integrin-mediated macrophage interactions in obese AT ameliorates obesity-related metabolic dysregulation via improved beige adipogenesis.
To substantiate the mechanism of action of pharmacologic α4β1 inhibition, we exposed α4-inhibitor- or vehicle-treated DIO mice to thermoneutrality conditions (30°C), wherein UCP1 is functionally incompetent12,14. In contrast to the improved insulin sensitivity and enhanced Ucp1 expression as a result of α4-inhibitor treatment in mice kept under 22°C, these differences were largely abolished in thermoneutrality (Fig. 5c–e). In thermoneutrality, a slight increase in Ucp1 gene expression, which was however not significant, was observed in α4-inhibitor-treated DIO mice, compared to control-treated mice (Fig. 5e). The M1-macrophage content was reduced in both SAT and VAT of the α4-inhibitor-treated mice under thermoneutral conditions (Fig. 5f). Hence, the a4-inhibitor failed to improve insulin sensitivity or beige adipogenesis under thermoneutral conditions despite reducing macrophage accumulation, suggesting that UCP1 is crucially involved in the mechanism whereby pharmacologic α4 inhibition promotes beige adipogenesis of white AT and prevents obesity-related metabolic dysregulation.
Macrophage-adipocyte adhesion inhibits UCP1 expression
Recent studies suggested that alternatively activated M2 macrophages, promote beige adipogenesis in the lean AT in a paracrine fashion14. However, whether M1-like inflammatory macrophages can conversely mediate proactive inhibition of beige adipogenesis has not been hitherto demonstrated, although it is strongly suggested by our findings. Consistent with previous findings16,18,31, the expression of UCP1 in the obese SAT was reduced at mRNA and protein level, as compared to the lean SAT (data not shown), implying that the predominance of inflammatory macrophages in the obese SAT correlates with inhibition of beige adipogenesis. To conclusively demonstrate this concept and to dissect its mechanistic underpinnings, we performed macrophage-primary adipocyte co-cultures. The adipocytes used were generated from pre-adipocytes isolated from the stromal vascular fraction (SVF) of wild-type mouse SAT that maintain their ability to express beige-related genes including Ucp18. White and beige adipocytes have bidirectional interconversion properties9,13,32, likely because they originate from PDGFRα+ bipotent precursors33. Norepinephrine and triiodothyronine (T3) were added to primary adipocytes prior to adipocyte-macrophage co-cultures performed here, in order to drive a beige-like profile and activation of Ucp1 expression34 (Supplementary Fig. 8). For M1-like inflammatory macrophages, we used GM-CSF-cultured bone marrow-derived macrophages (BMDMs) that were stimulated with lipopolysaccharide (LPS) or obese SAT-derived, LPS- plus interferon-γ (IFN-γ)-stimulated macrophages35,36. When adipocytes were cultured in direct contact (same well) with pro-inflammatory M1-like BMDMs, the norepinephrine/T3-stimulated adipocyte Ucp1 expression was significantly decreased (Fig. 6a). Similar results were obtained when adipocytes were cultured in direct contact with SAT-derived pro-inflammatory, LPS plus IFN-γ-stimulated macrophages (Fig. 6b). Consistently, Itga4 deletion was associated with increased thermogenic Ucp1 expression in the SAT, which, among fat pads with thermogenic potential (SAT and BAT), was the one with the highest adipocyte VCAM-1 expression in obesity. The inhibition of Ucp1 expression mediated by the direct cell-cell contact of inflammatory macrophages with adipocytes was reversed by the α4-inhibitor, which did not affect adipocyte expression of this thermogenic gene in the absence of macrophages (Fig. 6a,b). These data suggest that the inhibitory effect of inflammatory macrophages on beige adipogenesis requires direct α4 integrin-dependent cell-to-cell adhesive interactions.
Figure 6. α4 integrin-dependent macrophage-adipocyte interactions inhibit UCP1 expression in a phospho-Erk dependent manner.
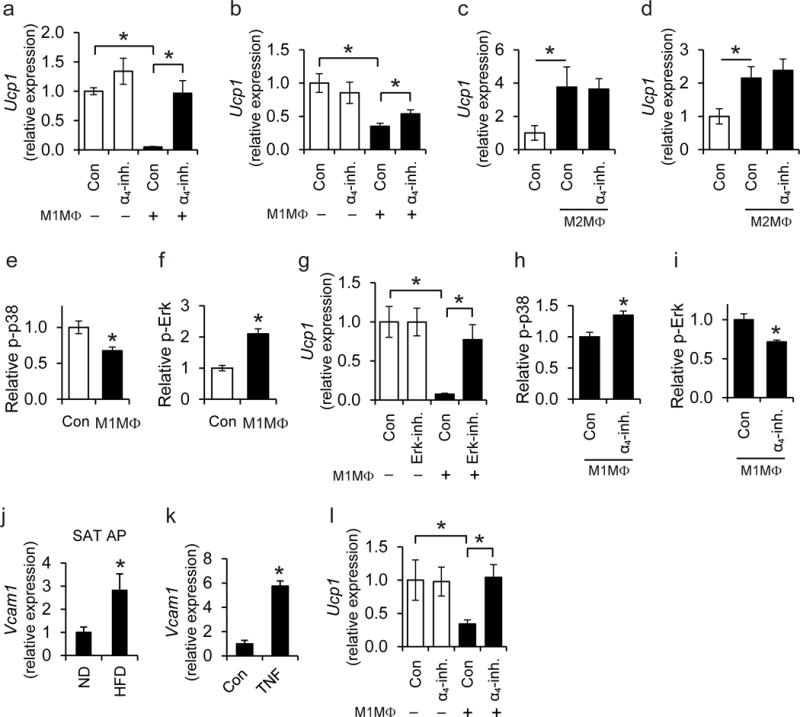
a–b) Primary adipocytes were cultured with T3 and norepinephrine to induce a thermogenic response, prior to co-culture in the absence or presence of (a) M1-like polarized pro-inflammatory BMDMs or (b) M1-like polarized primary SAT-derived macrophages [M1MΦ in the figure are M1-like polarized BMDMs in (a) or SAT macrophages in (b)] for 1 h. Co-culture was performed in direct contact (in the same well). Experiments were performed in the absence (control; Con) or presence of α4-inhibitor (α4-inh.). a) Ucp1 mRNA expression was analyzed in adipocytes after separation from the BMDMs. 18S expression was used for normalization and Ucp1 expression in adipocytes cultured in the absence of macrophages and in the absence of α4-inhibitor was set as 1 (n=5 separate primary adipocyte isolations). b) The mRNA expression of Ucp1 was analyzed in adipocytes after separation from SAT macrophages. l8S expression was used for normalization and Ucp1 expression in adipocytes cultured in the absence of macrophages and in the absence of α4-inhibitor was set as 1 (n=5 separate primary cell isolations from SAT). c–d) Primary adipocytes (pre-stimulated with T3 and norepinephrine) were co-cultured in the absence or presence of M2-like polarized primary SAT-derived macrophages (M2MΦ) in direct contact (c, in the same well) or in an indirect way (d, in transwell co-culture system, wherein adipocytes and macrophages were in the lower and upper compartment, respectively). Experiments were performed in the absence (control; Con) or presence of α4-inhibitor (α4-inh.). The mRNA expression of Ucp1 was analyzed in adipocytes after separation from the macrophages. l8S expression was used for normalization and Ucp1 expression in adipocytes cultured in the absence of macrophages was set as 1 (n=5 separate primary cell isolations from SAT). e–f) Primary adipocytes (pre-stimulated with T3 and norepinephrine) were co-cultured in the absence (control; Con) or presence of M1-like polarized BMDMs (direct contact) for 30 min. The amounts of phospho-p38 (e) and phospho-Erk (f) in adipocytes were detected by flow cytometry. Phospho-p38 or phospho-Erk protein amounts (MFI) in adipocytes cultured in the absence of M1MΦ were set as 1 (n=4 separate primary adipocyte isolations). g) Primary adipocytes were pre-treated with T3 and norepinephrine for 3 h, washed and then incubated in the absence (control; Con) or presence of an Erk inhibitor for 30 min. After washing, direct co-cultures between adipocytes and M1-like BMDMs were performed for 1 h and the mRNA expression of Ucp1 was studied in adipocytes after separation from the macrophages. The mRNA expression of Ucp1 in the absence of BMDMs and without Erk-inhibitor pre-treatment was set as 1 (n=4 separate primary adipocyte isolations). h, i) T3- and norepinephrine-pre-treated adipocytes were co-cultured with M1-like BMDMs (M1MΦ) in direct contact for 30 min in the absence (control; Con) or presence of α4-inhibitor (α4-inh.). Phospho-p38 (h) and phospho-Erk (i) in adipocytes were detected by flow cytometry and their respective amount (MFI) in the presence of M1MΦ but in the absence of α4-inhibitor was set as 1 (n=4 separate primary adipocyte isolations). j) Primary adipocyte progenitor cells (AP) were isolated from SAT of wild-type C57BL/6 lean (ND, n=4 mice) and obese (HFD, n=6 mice) mice by FACS-sorting (AP cells were defined as CD31−CD45−Sca1+PDGFRα+ cells) and Vcam1 mRNA expression was determined. 18S expression was used for normalization and Vcam1 expression of ND-fed mice was set as 1. k) AP were isolated from SVF of SAT of wild-type mice with FACS-sorting (CD31−CD45−Sca1+PDGFRα+ cells). Cells were treated without (control; Con) or with TNF. Vcam1 mRNA expression was analyzed. 18S expression was used for normalization and Vcam1 expression of control-treated cells (Con) was set as 1 (n=4 separate cell isolations). l) AP were isolated as in (k) and treated with T3 and norepinephrine. Thereafter, AP were co-cultured in the absence or presence of M1-like polarized pro-inflammatory BMDMs (M1MΦ) in direct contact with each other. Experiments were performed in the absence (control; Con) or presence of α4-inhibitor (α4-inh.). The mRNA expression of Ucp1 in AP was detected after macrophage separation. 18S expression was used for normalization and Ucp1 expression in the absence of macrophages and in the absence of α4-inh. was set as 1 (n=5 separate primary adipocyte progenitor isolations).
Data are presented as mean ± SEM. Data in (b), (c), (d) are pooled from 3 experiments; data in (a), (e), (f), (g), (h), (i), (k) are representative of 2 experiments; data in (j) and (l) are from one experiment. *P < 0.05. Mann-Whitney U-test in (a)–(l).
We generated M2-like macrophages by stimulating lean SAT-derived macrophages with interleukin-4 (IL-4) and co-cultured them with differentiated adipocytes. M2-like macrophages promoted adipocyte Ucp1 expression when cultured with adipocytes in both direct contact and non-contact (transwell) mode. Under both co-culture conditions, α4 integrin inhibition did not affect the M2-like macrophage-triggered Ucp1 expression in adipocytes (Fig. 6c,d).
Recent studies have highlighted the opposing roles of the p38 mitogen-activated protein kinase (p38 MAPK)37 and Erk signaling pathways38,39 in beige adipogenesis and UCP1 regulation, mediating stimulatory or inhibitory effects, respectively. We found that direct co-culture of inflammatory macrophages with primary adipocytes resulted in downregulation of phospho-p38 and upregulation of phospho-Erk content in adipocytes (Fig. 6e,f), thereby providing a mechanistic basis for the inhibitory effect of inflammatory macrophages on adipocyte Ucp1 expression. The reduction of Ucp1 expression by the presence of M1-like macrophages was reversed when adipocytes were pre-treated with an Erk inhibitor (Fig. 6g). Next, we sought to determine whether the α4 integrin-dependent inhibitory effect of inflammatory macrophages on beige adipogenesis was driven by regulation of the phospho-p38 and phospho-Erk pathways. In support of this notion, the abundance of phospho-p38 increased, whereas phospho-Erk decreased when the direct contact between adipocytes and inflammatory macrophages was blocked by the α4-inhibitor (Fig. 6h,i).
Besides the ability of white adipocytes for induction of UCP1 expression9,10,40, adipocyte progenitors can also differentiate to beige adipocytes33,41. We, therefore, assessed whether direct contact with pro-inflammatory macrophages could affect Ucp1 expression also in adipocyte progenitors. First, we found that PDGFRa+Sca-1+ adipocyte progenitors from SAT of obese mice displayed significantly increased expression of Vcam1 compared to adipocyte progenitors from lean mice (Fig. 6j). Moreover, TNF significantly increased Vcam1 expression in adipocyte progenitors (Fig. 6k). In addition, when adipocyte progenitors were cultured in the presence of pro-inflammatory M1-like macrophages (in a direct cell-to-cell contact assay), their Ucp1 expression was significantly decreased in a manner dependent on the a4β1-VCAM-1 interaction (Fig. 6l).
We next assessed whether the direct α4β1-VCAM-1 interaction between macrophages and adipocytes could also affect inflammatory activation in macrophages, thereby leading to a self-sustained cycle of persistent AT inflammation. Culture of macrophages on VCAM-1 pre-coated plates enhanced TNF expression (Fig. 7a,b), which is a cardinal marker of M1 macrophage polarization2,35,42. The VCAM-1-dependent upregulation of TNF in macrophages was abrogated in the presence of the α4-inhibitor (Fig. 7a) or in α4 integrin-deficient macrophages (Fig. 7b). Consistently, α4 integrin inhibition or deficiency in macrophages prevented the enhanced TNF expression in macrophages resulting from direct cell-to-cell contact with adipocytes (Fig. 7c,d). Thus, the α4 integrin-dependent crosstalk of macrophages with adipocytes is bidirectional, promoting inflammatory activation in the former and blocking beige adipogenesis in the latter.
Figure 7. The interaction between adipocyte VCAM-1 and macrophage α4 integrin leads to enhanced inflammatory macrophage activation.
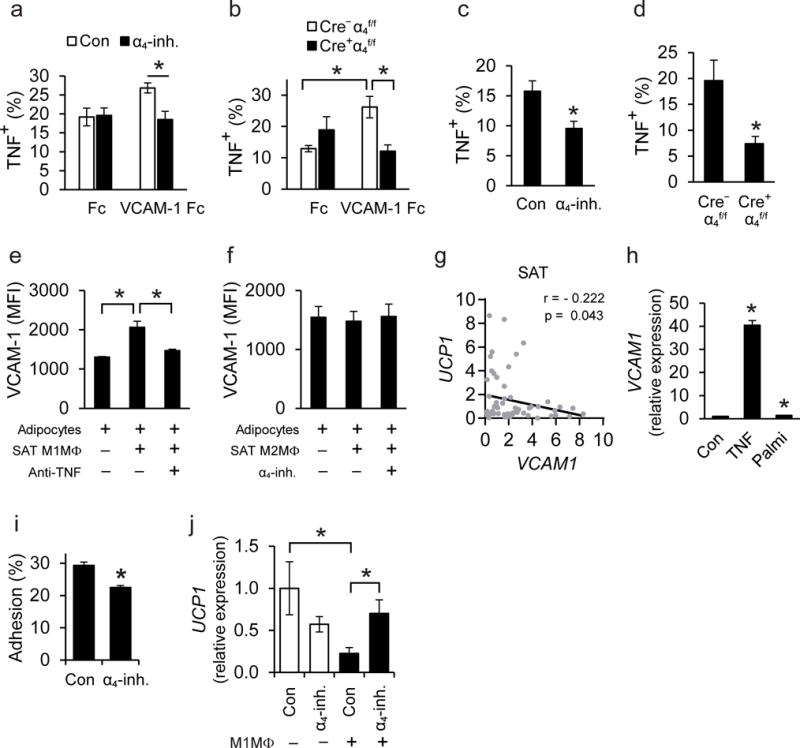
a–d) Peritoneal macrophages were FACS-sorted from wild-type C57BL/6 mice or Cre+α4f/f and Cre−α4f/f mice. a–b) Macrophages were cultured on plates pre-coated with Fc or VCAM-1-Fc. a) Wild-type macrophages (n=4 separate cell isolations) were incubated on pre-coated plates for 12 h in the absence (control; Con) or presence of the α4-inhibitor (α4-inh.) and macrophage TNF expression was analyzed by flow cytometry. Data are expressed as percentage of TNF-positive macrophages (F4/80+CD11b+). b) Isolated Cre+α4f/f (n=4 separate cell isolations) or Cre−α4f/f (n=5 separate cell isolations) macrophages were incubated on plates pre-coated with Fc or VCAM-1-Fc for 6 h and TNF expression was analyzed by flow cytometry. Data are presented as percentage of TNF-positive macrophages (F4/80+CD11b+). c–d) Macrophages were co-cultured in a direct cell-to-cell contact mode with 3T3-L1 adipocytes for 12 h. c) Wild-type macrophages were co-cultured with adipocytes in the absence (control, Con) or presence of α4-inhibitor (α4-inh.) and macrophage TNF expression was analyzed by flow cytometry. Data are presented as percentage of TNF-positive macrophages (defined as CD45+F4/80+CD11b+) (n=4 separate macrophage isolations). d) Cre+α4f/f or Cre−α4f/f macrophages were co-cultured with adipocytes in a direct cell-to-cell contact mode and macrophage TNF expression was analyzed by flow cytometry. Data are expressed as percentage of TNF-positive macrophages (CD45+F4/80+CD11b+) (n=4 separate macrophage isolations). Data in (a)–(d) are representative of 2 experiments. e–f) Primary adipocytes were cultured in the absence or presence of M1-like or M2-like polarized SAT-derived macrophages in a transwell co-culture system (adipocytes, lower compartment; macrophages, upper compartment). The experiments were performed in the presence or absence of the α4-inh. or TNF-blocking antibody, as indicated. After 24 h of incubation, adipocyte VCAM-1 expression was analyzed by flow cytometry and is expressed as MFI units (n=4 separate primary cell isolations from SAT in e and n=5 separate primary cell isolations from SAT in f). Data in (e)–(f) are pooled from 2 experiments. g) Correlation analysis between mRNA expression of UCP1 and VCAM1 in human SAT (n=61 human samples). h) Human subcutaneous pre-adipocytes were differentiated to adipocytes and 10 days after starting differentiation were treated without (control; Con) or with TNF or palmitate for 12 h. VCAM1 expression was analyzed and ACTB expression was used for normalization. VCAM1 expression of control-treated adipocytes was set as 1. Data are pooled from 4 experiments. i) Human inflammatory macrophages were allowed to adhere to TNF-pre-treated differentiated human adipocytes in the absence (control; Con) or presence of α4-inhibitor (α4-inh.). The percentage of adherent cells is shown (n=4 separate macrophage isolations). Data are representative of 2 experiments. j) Differentiated human adipocytes were treated with T3 and norepinephrine to induce a thermogenic response, washed and then co-cultured without or with human M1-like inflammatory macrophages (M1MΦ) in the same well (direct contact) for 1 h. Experiments were performed in the absence (control; Con) or presence of α4-inhibitor (α4-inh.). The expression of UCP1 in adipocytes (after exclusion of CD45-expressing cells) was detected; ACTB expression was used for normalization. UCP1 expression in adipocytes cultured in the absence of M1MΦ and in the absence of α4-inhibitor was set as 1. Shown is one representative experiment (n=4–5 cell culture treatments); similar results were observed in 2 experiments.
Data are mean ± SEM.; *P < 0.05. Mann-Whitney U-test was used in (a)–(f) and (h)–(j) and one-tailed Pearson Correlation analysis in (g).
We then studied whether inflammatory macrophages could further contribute to inhibition of beige adipogenesis by upregulating VCAM-1 in the adipocyte compartment. Since TNF could enhance VCAM-1 in adipocytes and TNF itself was upregulated by the direct macrophage-adipocyte contact, we explored whether macrophage-derived TNF could stimulate VCAM-1 expression in adipocytes. We therefore performed non-contact (transwell) macrophage-adipocyte co-cultures. We observed upregulation of VCAM-1 in adipocytes upon co-culture with SAT-derived M1-like inflammatory macrophages. This paracrine increase in adipocyte VCAM-1 expression by inflammatory macrophages was inhibited by an antibody against TNF (Fig. 7e). In contrast, adipocyte VCAM-1 expression was not affected upon co-culture in transwells with SAT-derived M2-like macrophages both in the absence or presence of the α4 integrin inhibitor (Fig. 7f).
Together, the α4 integrin-dependent adhesive macrophage-adipocyte interaction promotes a self-sustained inflammatory loop in obese AT, which involves inflammatory activation of macrophages, resulting in enhanced TNF production that further upregulates VCAM-1 in adipocytes. The direct α4 integrin-dependent macrophage-adipocyte interaction also inhibits UCP1 expression, which may contribute to reduced beige adipogenesis in obesity.
Macrophage-adipocyte interactions in the human system
We then determined whether the adhesive α4 integrin-VCAM-1-dependent inflammatory macrophage-adipocyte interaction could also operate in the human system. At first, we observed an inverse correlation between the expression of UCP1 and VCAM1 in SAT samples obtained from individuals during abdominal surgery (Fig. 7g). We also found that expression of VCAM1 was increased in human adipocytes (differentiated from pre-adipocytes) upon stimulation with TNF or palmitate (Fig. 7h). Moreover, adhesion of human M1-like proinflammatory macrophages to adipocytes was partially inhibited by the a4-inhibitor (Fig. 7i). Co-culture of inflammatory macrophages with primary adipocytes (in a direct cell-to-cell contact fashion) reduced UCP1 expression in the latter in a manner dependent on α4β1-VCAM-1-mediated adhesion (Fig. 7j). These data suggest that direct macrophage-adipocyte interactions may downregulate UCP1 expression in human SAT as well.
DISCUSSION
Beige adipogenesis linked with thermogenic UCP1 expression is a homeostatic function of the lean AT promoting energy expenditure43. In human and murine obesity, beige adipogenesis becomes dysfunctional and this phenomenon is associated with enhanced AT inflammation15,17,18,33,44,45. Here, we established a self-sustained loop linking AT inflammation and inflammatory macrophage retention with impaired beige adipogenesis in obesity. Specifically, α4 integrin-mediated adhesion of inflammatory macrophages to VCAM-1, the expression of which is augmented in adipocytes (and their progenitors) in obesity, inhibits thermogenic UCP1 expression via an Erk-dependent way.
Enhanced abundance of inflammatory macrophages in the obese AT may depend on integrins, such as α4β1, increased expression of monocyte-attracting chemokines1,20,27,29, or on local macrophage expansion44. It is conceivable that the herein identified α4 integrin-mediated macrophage retention mechanism might also facilitate AT macrophage expansion44. We found that TNF, which is elevated in the obese AT1,46, upregulates VCAM-1 expression in adipocytes and their progenitors, thereby promoting direct α4 integrin-VCAM-1-dependent adhesive interactions with macrophages. This interaction promotes retention of macrophages in the obese AT and drives further pro-inflammatory M1-like polarization, including increased TNF production, thereby further enhancing adipocyte VCAM-1 expression and sustaining the direct macrophage-adipocyte interaction, hence perpetuating AT inflammation. Importantly, the α4 integrin-dependent adhesion of macrophages to adipocyte VCAM-1 inhibits UCP1 expression and thus beige adipogenesis, thereby establishing a paramount paradigm of inflammation-driven metabolic dysfunction of obese AT.
In this regard, the α4 integrin-mediated interaction of inflammatory macrophages with adipocytes downregulated p38 MAPK and upregulated Erk signaling in the latter cells, leading to downregulation of UCP1, in accordance with recent reports37,38,39. Furthermore, Erk signaling in adipocytes promotes insulin resistance and diabetogenic actions via regulation of PPARγ function47. Therefore, the α4 integrin-VCAM-1-mediated mechanism dissected here may regulate further detrimental actions of Erk signaling in adipocytes.
Our findings are consistent with a previous study, which utilized α4(Y991A) knock-in mice, and demonstrated that inhibition of α4 integrin signaling ameliorates DIO-related metabolic dysfunction20. However, our work additionally introduces a new concept that α4 integrin-dependent direct adhesion of inflammatory macrophages to adipocytes inhibits UCP1 expression and reveals a hitherto unknown self-sustained cycle linking AT inflammation with impaired beige adipogenesis in obesity.
VCAM-1 expression analysis is usually confined to predominantly the vascular endothelium and hematopoietic cells48,49. We found that enhanced VCAM-1 expression in the obese AT50 predominantly derives from adipocytes. Moreover, the most prominent adipocyte VCAM-1 expression was observed in the SAT (rather than the VAT or the BAT), thereby potentially explaining why genetic or pharmacologic α4 integrin inhibition primarily affected UCP1 expression and beige adipogenesis in this particular fat pad. The dissected α4 integrin-dependent adhesive interaction may regulate beige adipogenesis in the human system, as supported by the inverse correlation between human SAT VCAM-1 and UCP1 expression. Noteworthy, although multiple papers have described adhesive leukocyte-endothelial interactions that mediate inflammatory cell recruitment, little knowledge exists on adhesive mechanisms between macrophages and tissue resident cells, as well as the functional consequences thereof for the local tissue environment. In this context, a new pathogenic principle arising from this work involves direct adhesive interactions between inflammatory cells and parenchymal cells. This novel disease-promoting mechanism may underlie several other chronic inflammatory disorders and is therapeutically important, as it is amenable to intervention. The mechanism presented here is of therapeutic relevance, since we have pinpointed α4 integrin as a potential target for anti-obesity intervention. Pharmacologic inhibition of α4 integrin promoted systemic insulin sensitivity by stimulating beige adipogenesis; such a therapeutic strategy has not been yet harnessed by current antidiabetic drugs and may merit detailed investigation in further preclinical settings.
Online Methods
Animal studies
Mx1-cre+Itga4flox/flox mice (Cre+α4f/f) were previously described21. To induce excision of α4 integrin, Cre-recombinase was induced in male Cre+α4f/f mice by 3 intraperitoneal (i.p.) injections of poly-(I:C) (Invivogen) at 2-day intervals21,51. Littermate male Mx1-cre−α4f/f mice (Cre−α4f/f) that also received identical treatments with poly-(I:C) served as controls. The mice were fed a normal-fat diet (D12450B, 10% fat, Research Diets) or a high-fat diet (HFD; D12492, 60% fat, Research Diets) for up to 20 weeks starting at 2 weeks after Cre-recombinase induction. Deletion of α4 integrin was confirmed by examining α4 integrin expression by flow cytometry (anti-CD49d, PS/2, AbD Serotec) in leukocytes isolated from blood upon Ficoll gradient purification (GE Healthcare). Mice with Itgal deletion (αL integrin KO) were previously described52. B6.V-Lepob/JRj (ob/ob) mice were from Janvier Labs. Animal experiments were approved by the Landesdirektion Sachsen, Germany.
In the α4 integrin inhibitor experiments, male C57BL/6 mice (Charles River) were fed a HFD for at least 6 weeks before subcutaneous implantation of an Alzet osmotic pump (Alzet, model 2006) filled with vehicle (PBS) or α4-inhibitor (α4-inh.; 69.125 [μM in a 200 [μl-total volume in the pump) allowing for continuous release for 6 weeks. Thereafter, mice were fed a HFD for another 6 weeks. The ob/ob mice were implanted with an Alzet osmotic pump including PBS or α4-inhibitor at week 6 of their age. The α4 integrin inhibitor ELND002, which has been previously used in clinical trials (NCT01318421 and NCT01144351), preferentially blocks α4β1 integrin (as compared to α4β7 integrin) and efficiently inhibits the α4β1—VCAM-1 interaction53 is described in detail in patent US 8,269,009 B2, and was provided by Elan Pharmaceuticals and Biogen Idec.
In thermoneutrality experiments, male C57BL/6 mice were fed a HFD for a total of 8 weeks. After 4 weeks of feeding, the mice were implanted with an Alzet osmotic pump, delivering α4-inhibitor or vehicle. After pump implantation each group of mice (α4- inh. or PBS) was divided into two subgroups and the feeding was continued for another 4 weeks under ambient (22°C) or thermoneutrality (30°C) conditions. In cold exposure experiments, obese mice were challenged with a temperature of 4°C with free access to water and food for 12 h. Thereafter, tissues were harvested and snap frozen in liquid nitrogen for RNA and protein analysis or fixed in 10% formalin for histology.
An estimate of at least 4–6 mice/group was used in experiments. No blinding was performed. In the osmotic pump experiments, groups were weight matched and randomized to the two different treatments. Pre-established exclusion criteria included death of a mouse or requirement of euthanasia of a mouse following animal protocol-defined endpoints (for instance signs of systemic illness or other forms of distress) prior to completion of the experiment. According to these predefined criteria, exclusion was necessitated in one experiment involving overall one mouse. One mouse from the 30°C α4-inh. group (involving the assays shown in Fig. 5d,e) was excluded according to these pre-established criteria.
Monocyte and T cell trafficking assays
Mouse bone marrow monocytes or splenic T cells were isolated from Cre−α4f/f and Cre+α4f/f mice after induction of Cre recombinase by using a mouse monocyte enrichment kit (EasySep) or a Pan T cell isolation kit II (Miltenyi Bitotec). Cell purity was confirmed by flow cytometry; monocytes were defined as CD11b+Ly6G− cells and T cells as CD45+CD3+ cells (anti-Ly6G, 1A8 from BD; anti-CD11b, M1/70 from Biolegend; anti-CD45, 30-F11 from BD; anti-CD3, 145-2C11 from eBioscience). Monocyte or T cell labeling and trafficking were performed as described with modifications54. Cre−α4f/f and Cre+α4f/f monocytes or T cells were labeled with PKH26red and PKH67green, respectively, by using the PKH26- or PKH67-fluorescent cell linker kits (Sigma Aldrich). Isolated monocytes or T cells were washed with PBS and resuspended in 1 ml diluent solution C (included in the aforementioned kit). One ml of PKH26 or PKH67 (4 μM in diluent C per 2 × 10⁷ cells) was finally added and the cells were incubated for 5 min at 22°C in dark. The staining was halted by adding 2 ml FBS and cells were washed in medium supplemented with 10% FBS. A combination of equal numbers of PKH26- and PKH67-labeled cells (2.9 × 10⁶ cells) was simultaneously injected into DIO C57BL/6 male mice (fed a HFD up to 20 weeks). Seven days thereafter, the labeled cells, located in the inguinal subcutaneous adipose tissue (SAT), visceral adipose tissue (VAT) or draining lymph nodes (inguinal lymph nodes for SAT, mesenteric lymph nodes for VAT), were analyzed by flow cytometry; in some cases analysis also included additional staining for identification of macrophages (anti-F4/80, BM8 from eBioscience and anti-CD11b) and T cells (anti-CD3).
Metabolic phenotyping
Blood glucose, cholesterol and triglycerides were measured in blood samples of overnight fasted mice with a glucose meter device (Accu-Chek, Roche) and the Accutrend Plus system (Roche). Fasting insulin concentrations were measured with an ELISA Kit (Crystal Chem). For insulin tolerance tests (ITT), mice were fasted for 6 h and then injected i.p. with insulin (1–1.5 U/Kg, Huminsulin, Lilly). Glucose concentrations were measured at specific time points up to 120 min after insulin injection.
For metabolic cage analysis55, mice fed a HFD for 8 weeks were individually housed in metabolic chambers (PhenoMaster, TSE Systems) with free access to food and water, maintaining a 12 h : 12 h dark—light cycle. Mice were acclimatized in metabolic chambers for 24 h before initiation of data collection. The volume of oxygen consumption (VO2) and carbon dioxide production (VCO2) were determined every 20 min for a period of 3 days. Respiratory exchange ratio (RER) was defined as VCO2/VO2 and energy expenditure (EE) was determined by using the formula 3.941×VO2 + 1.106×VCO2; food uptake was also determined. Statistics were performed using ANCOVA analysis. Determination of lean and fat mouse mass was performed by using computed tomography (CT, Skyscan 1178; Bruker)56.
3T3-L1 cell culture
Mouse 3T3-L1 preadipocytes (ATCC) were maintained in Dulbecco’s modified Eagle’s medium (DMEM) supplemented with penicillin-streptomycin and 10% heat-inactivated fetal calf serum (FBS) (Gibco-BRL). Cells were tested negative for mycoplasma. For differentiation to adipocytes, medium was replaced with complete DMEM containing insulin (1 μg/ml, Sigma Aldrich), 3-isobutyl-1-methylxantine (0.5 mM, Sigma Aldrich) and dexamethasone (0.25 μM, Sigma Aldrich) starting 2 days after reaching confluence (day 0). On day 3, the medium was replaced every other day with complete DMEM containing insulin (1 μg/ml). Fully differentiated 3T3-L1 adipocytes (day 8–10) were used for assays. In some experiments, 3T3-L1 adipocytes were stimulated with mouse TNF (20 ng/ml, R&D) or palmitate-BSA (250 μM, Sigma Aldrich) prior to further analysis.
Primary pre-adipocyte isolation and adipocyte differentiation
Mouse primary adipocyte differentiation was performed as described with modifications8,57. For isolation of stromal vascular (SV) cells, SAT of lean male C57BL/6 mice was dissected, minced, digested for 60 min at 37°C in PBS containing 0.5% BSA (Sigma Aldrich), collagenase I (2 mg/ml, Gibco) and 10 mM CaCl2, filtered through a 40-μm cell strainer and centrifuged at 600g for 5 min. SV cells were resuspended in DMEM/F12 medium supplemented with 10% FBS, glutamax and penicillin-streptomycin and filtered through a 40-μm cell strainer. Afterwards, the SV cells underwent a CD45 negative selection to remove hematopoietic cells using MACS magnetic beads (Miltenyi) and were plated into 6-well plates. After 90 min, SV cells were washed twice with PBS, to remove non-adherent cells and then were grown to 70–80% confluence in complete DMEM/F12. For SV cell differentiation to adipocytes, SV cells were seeded into 24-well plates at a density of 5 × 10⁴ cells per well in 1 ml complete DMEM/F12. When reaching confluence (day 0), cell medium was replaced with medium containing insulin (1 μg/ml, Sigma Aldrich), 3-isobutyl-1-methylxantine (0.5 mM, Sigma Aldrich), dexamethasone (0.25 μM), pioglitazone (1 μM, Sigma Aldrich), and T3 (1 nM, Sigma Aldrich). After 48 h, medium was exchanged (every 2 days) with complete DMEM/F12 containing insulin (1 | g/ml), T3 (1 nM) and pioglitazone (1 μM). Differentiated adipocytes (day 8–10) were used for assays. In some experiments, adipocytes were stimulated with mouse TNF (10 ng/ml) or palmitate-BSA (250 μM) prior to analysis.
Co-cultures of macrophages with primary adipocytes or adipocyte progenitors
Primary bone marrow derived macrophages (BMDMs) were prepared by flushing the bone marrow of C57BL/6 mice26,58. After performing red blood cell (RBC) lysis, cells were grown in RPMI-1640 supplemented with 10% FBS, glutamax, penicillin-streptomycin, and recombinant murine GM-CSF (10 ng/ml, PeproTech) for 7 days. GM-CSF-cultured BMDMs were stimulated with LPS (100 ng/ml; Invivogen) for 12 h to induce an inflammatory M1-like phenotype. BMDMs were harvested by using a non-enzymatic cell dissociation solution (Sigma Aldrich) and were counted before co-culturing with adipocytes.
Primary pre-adipocytes isolated from the SV of the SAT undergoing differentiation (see previous paragraph) were treated on day 8 or 9 of their differentiation with T3 (10 nM) and norepinephrine (1 μM; Sigma Aldrich) for 3 h, to induce a thermogenic response34 and then washed before co-culturing with BMDMs. For direct primary adipocyte–BMDM co-cultures, in which the cells were in contact with each other, adipocytes were cultured without or with BMDMs (5 × 10⁴) for 1 h. Experiments were performed in the absence or presence of the α4-inhibitor (ELND002; 1 nM). In other experiments, adipocytes were pre-treated with an Erk inhibitor (UO126, 10 μM, Sigma Aldrich) for 30 min and washed with medium prior to addition of M1-like polarized BMDMs. For adipocyte mRNA expression analysis, cells were trypsinized, washed with PBS and separated from macrophages by performing CD45 negative selection using MACS magnetic beads (Miltenyi). Ucp1 mRNA expression was analyzed by qPCR; 18S was used for normalization.
For protein detection of phospho-Erk1/2 and phospho-p38 in adipocytes after co-cultures with macrophages for 30 min, cells were harvested by trypsinization, washed with PBS and incubated with mouse Fc block and a rat anti-mouse APC-conjugated CD11b antibody (M1/70) (both from BD) for 15 min on ice. After fixation with 4% paraformaldehyde for 10 min, cells were permeabilized by using 90% methanol, treated with 10% goat serum (Sigma Aldrich) and incubated with either rabbit anti-mouse phospho-p44/42 MAPK (pErk1/2, Thr202/Tyr204) antibody (0.5 μg/100 μl; Cell Signaling; catalog # 9101), or rabbit anti-mouse phospho-p38 MAPK (Thr180/Tyr182) antibody (0.25 μg/100 μl; Cell Signaling, catalog # 4511) for 1 h at 22°C. After washing, cells were incubated with goat anti-rabbit IgG (H+L) Alexa fluor 488 (0.1 μg/100 μ1 Invitrogen; catalog # A-11034) for 1 h at 22°C. Median fluorescence intensity (MFI) was determined by flow cytometry (FACS Canto II, BD) after gating of adipocytes (defined as CD11b-negative cells).
In other experiments, co-cultures of adipocytes were performed with SAT-derived macrophages. For isolation of primary macrophages from SAT, SV cells were isolated from lean mice or obese C57BL/6 mice. Isolated SV cells were stained with anti-F4/80 Microbeads (Miltenyi Biotec) and macrophages were selected as F4/80+ cells by using MACS columns. The isolated macrophages were cultured in complete RPMI 1640 medium with M-CSF (10 ng/ml, eBioscience) for 24 h. To obtain M1-like polarized macrophages, obese SAT-derived macrophages were additionally treated with LPS (100 ng/ml, Invivogen) and IFN-γ (20 ng/ml, BD) for 12 h, while for obtaining M2-like polarized macrophages, lean SAT-derived macrophages were treated with IL-4 (20 ng/ml, PeproTech) for 12 h.
In direct primary adipocyte—SATderived macrophages co-cultures, adipocytes, pre-treated with T3 and norepinephrine, were co-cultured without or with SAT-derived M1-like polarized macrophages (2 × 10⁴ cells) for 1 h, as described above for adipocyte-BMDM co-cultures. In other experiments, adipocytes were co-cultured without or with SAT-derived M2-like polarized macrophages (2 × 10⁴ cells) for 6 h. Experiments were performed in the absence or presence of the α4-inhibitor (1 nM). The cells were trypsinized, and Ucp1 mRNA expression in adipocytes was analyzed by qPCR after their separation as CD45-negative cells by using MACS magnetic beads (Miltenyi Biotec).
The indirect primary adipocyte-primary SAT-derived macrophages co-cultures, in which the cells were not in contact, were performed by using 0.4-μm pore size Transwell inserts (Corning). T3 and norepinephrine pre-treated primary adipocytes (lower compartment), were co-cultured for 6 h without or with SAT-derived M2-like polarized macrophages (2 × 10⁴ cells) that were in the Transwell inserts, in the absence or presence of the α4-inhibitor. At the end of the experiment, Transwell inserts were removed, adipocytes were washed and Ucp1 mRNA expression was analyzed by qPCR.
In other experiments, M1- or M2-like polarized SAT-derived macrophages were seeded on 0.4-μm pore size Transwell inserts (0.4-μm pore size) at a density of 2 × 10⁴ cells and co-cultured with primary adipocytes. The experiments with M2-like macrophages were performed in the absence or presence of the α4-inhibitor. In the case of M1-like macrophages, experiments were performed in the absence or presence of a TNF-blocking antibody (1 μg/ml, R&D; catalog # AF-410-NA). After incubating for 24 h, adipocytes were trypsinized and stained with an anti-VCAM-1 antibody (clone 429, BD); VCAM-1 expression was analyzed by flow cytometry.
For adipocyte progenitor cell isolation, SV cells from SAT from lean C57BL/6 mice were washed with PBS containing 0.5% BSA (Sigma Aldrich), incubated with Fc block (BD) and stained with anti-CD31 (MEC 13.3 from BD), anti-CD45 (30-F11 from Biolegend), anti-Sca1 (D7 from BD), and anti-PDGFRα (APA5 from BD) for 20 min at 4°C. Adipocyte progenitors were sorted as CD31−CD45−Sca1+PDGRα+ cells in a FACS Aria II cell sorter (BD). The cells were seeded into culture dishes until reaching 70–80% confluence and then transferred to 24-well plates (5 × 10⁴ cells/well) before co-culturing with BMDMs. Specifically, after 3 h pre-treatment of adipocyte progenitors with T3 and norepinephrine, direct co-cultures of adipocyte progenitors with M1-like polarized BMDMs were performed for 1 h in the absence or presence of the α4-inhibitor. Thereafter, Ucp1 mRNA abundance in adipocyte progenitors was determined by qPCR, after exclusion of BMDMs as described above. In other experiments, after isolation of SV cells and adipocyte progenitor cell sorting, the latter were seeded for 24 h in 48-well plates (2 × 10⁴ cells/well), then treated overnight with mouse recombinant TNF (20 ng/ml, R&D systems) and mRNA expression of Vcam1 was analyzed by qPCR.
Isolation of mature adipocytes, adipocyte progenitors and endothelial cells from AT
SAT, VAT and BAT from lean or obese C57BL/6 mice were digested with collagenase and filtered. After centrifugation, the floating cells representing the mature adipocytes were collected, washed 3x with PBS and RNA isolation was performed with Trizol. The SV cells in the pellet were washed with PBS containing 0.5% BSA and then incubated with Fc block (BD) and stained with anti-CD31 (MEC 13.3 from BD), anti-CD45 (30-F11 from BioLegend), anti-Sca1 (D7 from BD), and anti-PDGFRα (APA5 from BD) antibodies for 20 min at 4°C. After washing, CD31−CD45−Sca1+PDGRα+ adipocyte progenitors or CD45−CD31+ endothelial cells were sorted in a FACS Aria II cell sorter (BD) and RNA from each individual population was isolated by using Trizol.
Stromal vascular fraction (SVF) isolation and flow cytometry
SVF was prepared as reported55,59,60. Briefly, inguinal SAT or VAT were isolated from euthanized mice, minced and digested for 60 min in DMEM containing collagenase type I (2 mg/ml per gram of tissue; Invitrogen) at 37°C. Cell suspensions were then filtered through a 40-μm cell strainer and the SVF was collected as a pellet after centrifugation at 500g for 5 min. After RBC lysis, cells were stained with anti-CD45 (30-F11, BD), anti-F4/80 (clone BM8, BioLegend), anti-CD11b (M1/70, BD), anti-CD11c (HL3, BD), anti-CD206 (c06802, BioLegend; MR5D3, Acris), anti-TNF (MP6-XT22, BioLegend), anti-iNOS (CXNFT, eBioscience) and anti-CD49d [clone PS/2, AbD Serotec or clone 9C10(MFR4.B), BioLegend]. Cells were analyzed in a FACS Canto II flow cytometer (BD).
Histological analysis
For immunohistochemistry, AT were fixed overnight in 10% formalin solution, embedded in paraffin and cut into 5-μm sections59. For adipocyte size determination, images of H&E-stained SAT or VAT sections were obtained and the diameter of ~ 200 adipocytes per slide was measured with the AxioVision Rel. 4.8 software (Carl Zeiss MicroImaging). The diameters of both height and width were measured from each cell. For UCP1 or F4/80 immunohistochemistry, sections were de-paraffinized and incubated with pronase (Sigma Aldrich) or citrate buffer, respectively. Sections were then incubated overnight with antibody against UCP1 (Abcam; catalog # ab10983) or F4/80 (Novus Biologicals; catalog # NB600-404). The Vectastain ABC kit (Vector Laboratories) was used for UCP1 or F4/80 detection. Images were obtained by a computerized microscope (Zeiss) or an Axioscan.Z1 slide scanner (Zeiss). Quantification of CLS numbers was performed in whole-section F4/80-stained mosaic images by counting the number of CLS per mm2 of tissue in 6 sections per sample. Determination of non-CLS-associated macrophage numbers was performed by counting the number of F4/80 positive cells per 100 adipocytes from 10 random low-magnification CLS-free fields per sample. The Zen Imaging Software (Zeiss) was used in both types of quantification.
For immunofluorescence detection of macrophages (F4/80 staining) and adipocytes (caveolin-1 staining)6,28 in SAT, whole mounts were prepared. The tissues were extracted and fixed with paraformaldehyde 4% (Thermo Fisher Scientific) for 2 h at 4°C. Thereafter, the tissue was cut into small cubic pieces (each side approximately 2 mm). The samples were thoroughly washed with PBS and blocked-permeabilized in serum-free protein block (Dako) with 1% Saponin (Sigma Aldrich) for 2 h at 22°C. The primary antibody incubation was performed in Antibody diluent (Dako) supplemented with 0.5% Saponin overnight at 4°C. A rat anti-mouse F4/80 (1:100, CI:A3-1; Abcam, ab6640) and a rabbit anti-mouse caveolin-1 (1:100, Abcam, ab192869) were used. After washings, incubation with appropriate fluorescently-labeled secondary antibodies (from Jackson Immunoresearch and Thermo Scientific) and counterstaining with DAPI (1:2000, Sigma Aldrich), images were acquired with a Zeiss LSM 510 confocal microscope (Zeiss). For the 3D reconstruction of macrophage-adipocyte interactions in the SAT, the Arivis Vision 4D software was used.
For the quantification of the contact area between macrophages and adipocytes in SAT, images were acquired with an Olympus IX83 microscope equipped with a Yokogawa CSU-X1 spinning disc confocal scanner (Olympus). Quantification was performed with the Fiji software61 and its update SCF-MPI-CBG (http://sites.imagej.net/SCF-MPI-CBG/) by analyzing 10 arbitrarily selected cells per mouse. Annotation of the contact surface between macrophages (F4/80 positive cells - green) and adipocytes (caveolin-1 positive cells - red) was done by manually drawing lines along the surface plane by plane in the Fiji software. The surface area was then calculated by a custom tool (SCF-MPI-CBG), which interpolated the surface area from the drawn lines.
Analysis of human VCAM1 and UCP1 mRNA expression in adipose tissue
Paired samples of subcutaneous whole AT were obtained from 169 individuals (113 women and 56 men). The age ranged from 19 to 88 years and the BMI from 18.8 to 73.2 kg/m2. Phenotypic characterization of the study participants was reported62. All AT samples were collected during open or laparoscopic abdominal surgery as described62. The study was approved by the Ethics Committee of the University of Leipzig (approval no: 159-12-21052012 and 017-12-23012012), and performed in accordance to the declaration of Helsinki. All subjects gave written informed consent before taking part in this study.
AT was immediately frozen in liquid nitrogen and stored at −80°C. RNA was extracted from AT by using RNeasy Lipid tissue Mini Kit (Qiagen). Quantity and integrity of RNA was monitored with NanoVue plus Spectrophotometer (GE Healthcare). One μg total RNA from subcutaneous AT was reverse-transcribed with standard reagents (Life technologies). cDNA was then proceeded for TaqMan probe-based quantitative real-time polymerase chain reaction (qPCR) using the QuantStudio 6 Flex Real-Time PCR System (Life Technologies). Human VCAM1 and UCP1 expression were measured by quantitative real-time RT-PCR using the following probes: human VCAM1 (Hs01003370_m1, ThermoFisher Scientific), UCP1 (Hs00222453_m1, ThermoFisher Scientific). Fluorescence emissions were monitored after each cycle. Human VCAM1 and UCP1 mRNA expression were calculated relative to the mRNA expression of hypoxanthine guanine phosphoribosyltransferase 1 (HPRT1) (Hs01003267_m1, ThermoFisher Scientific). For correlation analysis (as presented in Fig. 7g) only samples with detectable UCP1 expression were utilized, as UCP1 expression was detectable only in a subset of the AT samples.
Statistical analysis
Statistical tests used are indicated in figure legends. For statistical comparisons, data were analyzed by a Student’s t-test or a Mann-Whitney U test, as appropriate. One-tailed Pearson correlation analysis was performed to examine the association between VCAM1 and UCP1 expression in human AT samples. For metabolic cage analysis, a one-way analysis of covariance (ANCOVA) was conducted in conjunction with a Bonferroni post-hoc test. The body weight was used as the covariate. The Graph Pad Prism 6 or the IBM SPSS statistics 22 were used. Significance was set at P < 0.05.
Supplementary Material
Acknowledgments
We thank S. Grossklaus, B. Gercken, M. Prucnal and K. Bar for technical assistance, T. Yednock (Annexon Biosciences) for helpful discussions and C. Ballantyne (Baylor College of Medicine) for αL integrin-deficient mice. Supported by the German Center for Diabetes Research (TC) and by grants from the Deutsche Forschungsgemeinschaft (CH279/5-1 to T.C.), from the European Research Council (DEMETINL to T.C.), and from the US National Institutes of Health (DE024716 to G.H. and DE026152 to G.H. and T.C.).
Footnotes
AUTHOR CONTRIBUTIONS
K.-J.C. designed and performed experiments, analyzed and interpreted data and wrote the paper; A.C. performed experiments, analyzed and interpreted data and wrote the paper; M.E., R.G.-M., V.I.A., I.M., M.N., J.G., J.P. and J.-H.L. performed experiments and analyzed data. T.Z., S.E.G., K.P.K. and T.P. participated in experimental design and discussion; T.P. also provided α4-floxed mice; M.B. performed research, analyzed and interpreted data, G.H. participated in experimental design and edited the paper; T.C. designed the study and wrote the paper.
COMPETING FINANCIAL INTERESTS
SEG is a former employee of ELAN Pharmaceuticals and Biogen Idec; she has no conflict of interest related to this work. The rest of the authors also disclose no conflict of interest.
Data availability statement.
The data that support the findings of this study are available from the corresponding authors upon request.
The Supplementary Information contains additional Methods (Cell adhesion assays, Macrophage activation studies, Experiments with human cells, Immunoblot, Real-Time PCR).
References
- 1.Chmelar J, Chung KJ, Chavakis T. The role of innate immune cells in obese adipose tissue inflammation and development of insulin resistance. Thrombosis and haemostasis. 2013;109:399–406. doi: 10.1160/TH12-09-0703. [DOI] [PubMed] [Google Scholar]
- 2.McNelis JC, Olefsky JM. Macrophages, immunity, and metabolic disease. Immunity. 2014;41:36–48. doi: 10.1016/j.immuni.2014.05.010. [DOI] [PubMed] [Google Scholar]
- 3.Anderson EK, Gutierrez DA, Hasty AH. Adipose tissue recruitment of leukocytes. Current opinion in lipidology. 2010;21:172–177. doi: 10.1097/MOL.0b013e3283393867. [DOI] [PMC free article] [PubMed] [Google Scholar]
- 4.Bai Y, Sun Q. Macrophage recruitment in obese adipose tissue. Obesity reviews : an official journal of the International Association for the Study of Obesity. 2015;16:127–136. doi: 10.1111/obr.12242. [DOI] [PMC free article] [PubMed] [Google Scholar]
- 5.Kim D, et al. CXCL12 secreted from adipose tissue recruits macrophages and induces insulin resistance in mice. Diabetologia. 2014;57:1456–1465. doi: 10.1007/s00125-014-3237-5. [DOI] [PubMed] [Google Scholar]
- 6.Ramkhelawon B, et al. Netrin-1 promotes adipose tissue macrophage retention and insulin resistance in obesity. Nat Med. 2014;20:377–384. doi: 10.1038/nm.3467. [DOI] [PMC free article] [PubMed] [Google Scholar]
- 7.Mitroulis I, et al. Leukocyte integrins: Role in leukocyte recruitment and as therapeutic targets in inflammatory disease. Pharmacol Ther. 2015;147C:123–135. doi: 10.1016/j.pharmthera.2014.11.008. [DOI] [PMC free article] [PubMed] [Google Scholar]
- 8.Fisher FM, et al. FGF21 regulates PGC-1alpha and browning of white adipose tissues in adaptive thermogenesis. Genes Dev. 2012;26:271–281. doi: 10.1101/gad.177857.111. [DOI] [PMC free article] [PubMed] [Google Scholar]
- 9.Rosenwald M, Perdikari A, Rulicke T, Wolfrum C. Bi-directional interconversion of brite and white adipocytes. Nat Cell Biol. 2013;15:659–667. doi: 10.1038/ncb2740. [DOI] [PubMed] [Google Scholar]
- 10.Rossato M, et al. Human white adipocytes express the cold receptor TRPM8 which activation induces UCP1 expression, mitochondrial activation and heat production. Mol Cell Endocrinol. 2014;383:137–146. doi: 10.1016/j.mce.2013.12.005. [DOI] [PubMed] [Google Scholar]
- 11.Harms M, Seale P. Brown and beige fat: development, function and therapeutic potential. Nat Med. 2013;19:1252–1263. doi: 10.1038/nm.3361. [DOI] [PubMed] [Google Scholar]
- 12.Shabalina IG, et al. UCP1 in brite/beige adipose tissue mitochondria is functionally thermogenic. Cell Rep. 2013;5:1196v1203. doi: 10.1016/j.celrep.2013.10.044. [DOI] [PubMed] [Google Scholar]
- 13.Wu J, et al. Beige adipocytes are a distinct type of thermogenic fat cell in mouse and human. Cell. 2012;150:366–376. doi: 10.1016/j.cell.2012.05.016. [DOI] [PMC free article] [PubMed] [Google Scholar]
- 14.Qiu Y, et al. Eosinophils and type 2 cytokine signaling in macrophages orchestrate development of functional beige fat. Cell. 2014;157:1292–1308. doi: 10.1016/j.cell.2014.03.066. [DOI] [PMC free article] [PubMed] [Google Scholar]
- 15.Cypess AM, et al. Identification and importance of brown adipose tissue in adult humans. N Engl J Med. 2009;360:1509–1517. doi: 10.1056/NEJMoa0810780. [DOI] [PMC free article] [PubMed] [Google Scholar]
- 16.Fromme T, Klingenspor M. Uncoupling protein 1 expression and high-fat diets. Am J Physiol Regul Integr Comp Physiol. 2011;300:R1–8. doi: 10.1152/ajpregu.00411.2010. [DOI] [PubMed] [Google Scholar]
- 17.Saito M, et al. High incidence of metabolically active brown adipose tissue in healthy adult humans: effects of cold exposure and adiposity. Diabetes. 2009;58:1526–1531. doi: 10.2337/db09-0530. [DOI] [PMC free article] [PubMed] [Google Scholar]
- 18.Chiang SH, et al. The protein kinase IKKepsilon regulates energy balance in obese mice. Cell. 2009;138:961–975. doi: 10.1016/j.cell.2009.06.046. [DOI] [PMC free article] [PubMed] [Google Scholar]
- 19.Abram CL, Lowell CA. The ins and outs of leukocyte integrin signaling. Annu Rev Immunol. 2009;27:339–362. doi: 10.1146/annurev.immunol.021908.132554. [DOI] [PMC free article] [PubMed] [Google Scholar]
- 20.Feral CC, et al. Blockade of alpha4 integrin signaling ameliorates the metabolic consequences of high-fat diet-induced obesity. Diabetes. 2008;57:1842–1851. doi: 10.2337/db07-1751. [DOI] [PMC free article] [PubMed] [Google Scholar]
- 21.Scott LM, Priestley GV, Papayannopoulou T. Deletion of alpha4 integrins from adult hematopoietic cells reveals roles in homeostasis, regeneration, and homing. Mol Cell Biol. 2003;23:9349–9360. doi: 10.1128/MCB.23.24.9349-9360.2003. [DOI] [PMC free article] [PubMed] [Google Scholar]
- 22.Hartner JC, Walkley CR, Lu J, Orkin SH. ADAR1 is essential for the maintenance of hematopoiesis and suppression of interferon signaling. Nat Immunol. 2009;10:109–115. doi: 10.1038/ni.1680. [DOI] [PMC free article] [PubMed] [Google Scholar]
- 23.Onoyama I, et al. Fbxw7 regulates lipid metabolism and cell fate decisions in the mouse liver. J Clin Invest. 2010;121:342–354. doi: 10.1172/JCI40725. [DOI] [PMC free article] [PubMed] [Google Scholar]
- 24.Priestley GV, Scott LM, Ulyanova T, Papayannopoulou T. Lack of alpha4 integrin expression in stem cells restricts competitive function and self-renewal activity. Blood. 2006;107:2959–2967. doi: 10.1182/blood-2005-07-2670. [DOI] [PMC free article] [PubMed] [Google Scholar]
- 25.Rettig MP, Ansstas G, DiPersio JF. Mobilization of hematopoietic stem and progenitor cells using inhibitors of CXCR4 and VLA-4. Leukemia. 2012;26:34–53. doi: 10.1038/leu.2011.197. [DOI] [PMC free article] [PubMed] [Google Scholar]
- 26.Choi EY, et al. Del-1, an endogenous leukocyte-endothelial adhesion inhibitor, limits inflammatory cell recruitment. Science. 2008;322:1101–1104. doi: 10.1126/science.1165218. [DOI] [PMC free article] [PubMed] [Google Scholar]
- 27.Ley K, Laudanna C, Cybulsky MI, Nourshargh S. Getting to the site of inflammation: the leukocyte adhesion cascade updated. Nat Rev Immunol. 2007;7:678–689. doi: 10.1038/nri2156. [DOI] [PubMed] [Google Scholar]
- 28.Jeffery E, Church CD, Holtrup B, Colman L, Rodeheffer MS. Rapid depot-specific activation of adipocyte precursor cells at the onset of obesity. Nat Cell Biol. 2015;17:376–385. doi: 10.1038/ncb3122. [DOI] [PMC free article] [PubMed] [Google Scholar]
- 29.Lumeng CN, Bodzin JL, Saltiel AR. Obesity induces a phenotypic switch in adipose tissue macrophage polarization. J Clin Invest. 2007;117:175–184. doi: 10.1172/JCI29881. [DOI] [PMC free article] [PubMed] [Google Scholar]
- 30.Bartelt A, Heeren J. Adipose tissue browning and metabolic health. Nat Rev Endocrinol. 2014;10:24–36. doi: 10.1038/nrendo.2013.204. [DOI] [PubMed] [Google Scholar]
- 31.Shimizu I, et al. Vascular rarefaction mediates whitening of brown fat in obesity. J Clin Invest. 2014;124:2099–2112. doi: 10.1172/JCI71643. [DOI] [PMC free article] [PubMed] [Google Scholar]
- 32.Wang QA, Tao C, Gupta RK, Scherer PE. Tracking adipogenesis during white adipose tissue development, expansion and regeneration. Nat Med. 2013;19:1338–1344. doi: 10.1038/nm.3324. [DOI] [PMC free article] [PubMed] [Google Scholar]
- 33.Lee YH, Petkova AP, Mottillo EP, Granneman JG. In vivo identification of bipotential adipocyte progenitors recruited by beta3-adrenoceptor activation and high-fat feeding. Cell Metab. 2012;15:480–491. doi: 10.1016/j.cmet.2012.03.009. [DOI] [PMC free article] [PubMed] [Google Scholar]
- 34.Federico L, et al. Autotaxin and its product lysophosphatidic acid suppress brown adipose differentiation and promote diet-induced obesity in mice. Mol Endocrinol. 2012;26:786–797. doi: 10.1210/me.2011-1229. [DOI] [PMC free article] [PubMed] [Google Scholar]
- 35.Murray PJ. Macrophage Polarization. Annu Rev Physiol. 2017;79:541–566. doi: 10.1146/annurev-physiol-022516-034339. [DOI] [PubMed] [Google Scholar]
- 36.Murray PJ, et al. Macrophage activation and polarization: nomenclature and experimental guidelines. Immunity. 2014;41:14–20. doi: 10.1016/j.immuni.2014.06.008. [DOI] [PMC free article] [PubMed] [Google Scholar]
- 37.Cao W, et al. p38 mitogen-activated protein kinase is the central regulator of cyclic AMP-dependent transcription of the brown fat uncoupling protein 1 gene. Mol Cell Biol. 2004;24:3057–3067. doi: 10.1128/MCB.24.7.3057-3067.2004. [DOI] [PMC free article] [PubMed] [Google Scholar]
- 38.Ye L, et al. TRPV4 is a regulator of adipose oxidative metabolism, inflammation, and energy homeostasis. Cell. 2012;151:96–110. doi: 10.1016/j.cell.2012.08.034. [DOI] [PMC free article] [PubMed] [Google Scholar]
- 39.Sakamoto T, et al. Inflammation induced by RAW macrophages suppresses UCP1 mRNA induction via ERK activation in 10T1/2 adipocytes. Am J Physiol Cell Physiol. 2013;304:C729–738. doi: 10.1152/ajpcell.00312.2012. [DOI] [PMC free article] [PubMed] [Google Scholar]
- 40.Barbatelli G, et al. The emergence of cold-induced brown adipocytes in mouse white fat depots is determined predominantly by white to brown adipocyte transdifferentiation. Am J Physiol Endocrinol Metab. 2010;298:E1244–1253. doi: 10.1152/ajpendo.00600.2009. [DOI] [PubMed] [Google Scholar]
- 41.Wang W, et al. Ebf2 is a selective marker of brown and beige adipogenic precursor cells. Proc Natl Acad Sci U S A. 2014;111:14466–14471. doi: 10.1073/pnas.1412685111. [DOI] [PMC free article] [PubMed] [Google Scholar]
- 42.Sica A, Mantovani A. Macrophage plasticity and polarization: in vivo veritas. J Clin Invest. 2012;122:787–795. doi: 10.1172/JCI59643. [DOI] [PMC free article] [PubMed] [Google Scholar]
- 43.Wang J, et al. Ablation of LGR4 promotes energy expenditure by driving white-to-brown fat switch. Nat Cell Biol. 2013;15:1455–1463. doi: 10.1038/ncb2867. [DOI] [PubMed] [Google Scholar]
- 44.Amano SU, et al. Local proliferation of macrophages contributes to obesity-associated adipose tissue inflammation. Cell Metab. 2014;19:162–171. doi: 10.1016/j.cmet.2013.11.017. [DOI] [PMC free article] [PubMed] [Google Scholar]
- 45.Carey AL, et al. Reduced UCP-1 content in in vitro differentiated beige/brite adipocytes derived from preadipocytes of human subcutaneous white adipose tissues in obesity. PloS one. 2014;9:e91997. doi: 10.1371/journal.pone.0091997. [DOI] [PMC free article] [PubMed] [Google Scholar]
- 46.Wellen KE, et al. Interaction of tumor necrosis factor-alpha- and thiazolidinedione-regulated pathways in obesity. Endocrinology. 2004;145:2214–2220. doi: 10.1210/en.2003-1580. [DOI] [PubMed] [Google Scholar]
- 47.Banks AS, et al. An ERK/Cdk5 axis controls the diabetogenic actions of PPARgamma. Nature. 2015;517:391–395. doi: 10.1038/nature13887. [DOI] [PMC free article] [PubMed] [Google Scholar]
- 48.Ulyanova T, Priestley GV, Nakamoto B, Jiang Y, Papayannopoulou T. VCAM-1 ablation in nonhematopoietic cells in MxCre+ VCAM-1f/f mice is variable and dictates their phenotype. Exp Hematol. 2007;35:565–571. doi: 10.1016/j.exphem.2007.01.031. [DOI] [PMC free article] [PubMed] [Google Scholar]
- 49.Ulyanova T, et al. VCAM-1 expression in adult hematopoietic and nonhematopoietic cells is controlled by tissue-inductive signals and reflects their developmental origin. Blood. 2005;106:86–94. doi: 10.1182/blood-2004-09-3417. [DOI] [PMC free article] [PubMed] [Google Scholar]
- 50.Bosanska L, et al. The influence of obesity and different fat depots on adipose tissue gene expression and protein levels of cell adhesion molecules. Physiol Res. 2010;59:79–88. doi: 10.33549/physiolres.931705. [DOI] [PubMed] [Google Scholar]
- 51.Schneider RK, et al. Role of casein kinase 1A1 in the biology and targeted therapy of del(5q) MDS. Cancer Cell. 2014;26:509–520. doi: 10.1016/j.ccr.2014.08.001. [DOI] [PMC free article] [PubMed] [Google Scholar]
- 52.Ding ZM, et al. Relative contribution of LFA-1 and Mac-1 to neutrophil adhesion and migration. J Immunol. 1999;163:5029–5038. [PubMed] [Google Scholar]
- 53.Garrido C, et al. ELND002 is a potent inhibitor of a4 integrin-mediated human leukocyte adhesion in vitro. J Neuroimmunol. 2010;228:92. [Google Scholar]
- 54.Oh DY, Morinaga H, Talukdar S, Bae EJ, Olefsky JM. Increased macrophage migration into adipose tissue in obese mice. Diabetes. 2012;61:346–354. doi: 10.2337/db11-0860. [DOI] [PMC free article] [PubMed] [Google Scholar]
- 55.Chatzigeorgiou A, et al. Dual role of B7 costimulation in obesity-related nonalcoholic steatohepatitis and metabolic dysregulation. Hepatology. 2014;60:1196–1210. doi: 10.1002/hep.27233. [DOI] [PubMed] [Google Scholar]
- 56.Garcia-Martin R, et al. Adipocyte-Specific Hypoxia-Inducible Factor 2alpha Deficiency Exacerbates Obesity-Induced Brown Adipose Tissue Dysfunction and Metabolic Dysregulation. Mol Cell Biol. 2016;36:376–393. doi: 10.1128/MCB.00430-15. [DOI] [PMC free article] [PubMed] [Google Scholar]
- 57.Aune UL, Ruiz L, Kajimura S. Isolation and differentiation of stromal vascular cells to beige/brite cells. J Vis Exp. 2013 doi: 10.3791/50191. [DOI] [PMC free article] [PubMed] [Google Scholar]
- 58.Choi EY, et al. Regulation of LFA-1-dependent inflammatory cell recruitment by Cbl-b and 14-3-3 proteins. Blood. 2008;111:3607–3614. doi: 10.1182/blood-2007-07-103077. [DOI] [PMC free article] [PubMed] [Google Scholar]
- 59.Phieler J, et al. The complement anaphylatoxin C5a receptor contributes to obese adipose tissue inflammation and insulin resistance. J Immunol. 2013;191:4367–4374. doi: 10.4049/jimmunol.1300038. [DOI] [PMC free article] [PubMed] [Google Scholar]
- 60.Chatzigeorgiou A, et al. Blocking CD40-TRAF6 signaling is a therapeutic target in obesity-associated insulin resistance. Proc Natl Acad Sci U S A. 2014;111:2686–2691. doi: 10.1073/pnas.1400419111. [DOI] [PMC free article] [PubMed] [Google Scholar]
- 61.Schindelin J, et al. Fiji: an open-source platform for biological-image analysis. Nat Methods. 2012;9:676–682. doi: 10.1038/nmeth.2019. [DOI] [PMC free article] [PubMed] [Google Scholar]
- 62.Kloting N, et al. Insulin-sensitive obesity. Am J Physiol Endocrinol Metab. 2010;299:E506–515. doi: 10.1152/ajpendo.00586.2009. [DOI] [PubMed] [Google Scholar]
Associated Data
This section collects any data citations, data availability statements, or supplementary materials included in this article.