

Abstract
Carcinogenicity refers to a highly toxic end point of certain chemicals, and has become an important issue in the drug development process. In this study, three novel ensemble classification models, namely Ensemble SVM, Ensemble RF, and Ensemble XGBoost, were developed to predict carcinogenicity of chemicals using seven types of molecular fingerprints and three machine learning methods based on a dataset containing 1003 diverse compounds with rat carcinogenicity. Among these three models, Ensemble XGBoost is found to be the best, giving an average accuracy of 70.1 ± 2.9%, sensitivity of 67.0 ± 5.0%, and specificity of 73.1 ± 4.4% in five-fold cross-validation and an accuracy of 70.0%, sensitivity of 65.2%, and specificity of 76.5% in external validation. In comparison with some recent methods, the ensemble models outperform some machine learning-based approaches and yield equal accuracy and higher specificity but lower sensitivity than rule-based expert systems. It is also found that the ensemble models could be further improved if more data were available. As an application, the ensemble models are employed to discover potential carcinogens in the DrugBank database. The results indicate that the proposed models are helpful in predicting the carcinogenicity of chemicals. A web server called CarcinoPred-EL has been built for these models (http://ccsipb.lnu.edu.cn/toxicity/CarcinoPred-EL/).
Introduction
Evaluating the toxicity of new compounds is an essential part of the drug development process1, 2. Any chemical substances that can cause cancer are defined as carcinogens. Thus, among various toxicological endpoints of chemical substances, carcinogenicity is of great concern because of its serious effects on human health. The carcinogenic mechanism of chemicals may be due to their ability to damage the genome or disrupt cellular metabolic processes. Many approved drugs have been identified as carcinogens in humans or animals and have been withdrawn from the market3. To prevent the appearance of drug-induced cancer, as stipulated by regulatory authorities, pharmaceutical companies must perform several carcinogenicity tests before receiving marketing approval for their new compounds4.
In general, the carcinogenic potency of chemicals is evaluated using animal models, such as the 2-year rodent carcinogenicity assay and the 26-week Tg-rasH2 mice carcinogenicity study5. However, these animal model experiments are laborious, time consuming, highly expensive, and even unethical. It is impossible to assess the carcinogenicity of a large number of unascertained chemicals to identify problematic compounds in the early stages of drug development. Therefore, computational approaches for predicting carcinogenicity based on chemical structure properties are recognized as an alternative solution, and have become the focus of research in recent years6, 7.
Over the past decades, numerous computational approaches have been proposed for the prediction of chemical carcinogenicity. These approaches can be divided into three categories: qualitative structure–activity relationship (SAR) models8–20, i.e., classification models, quantitative structure–activity relationship models (QSAR)19–25, and expert systems26–29. SAR and QSAR models attempt to describe the relationships between chemical structure features (usually represented by molecular descriptors) and biological activity (e.g., carcinogenicity) based on known activity data using various statistical or mathematical methods30. Many SAR and QSAR models have achieved high predictive accuracy in specific congeneric chemical classes such as nitrocompounds21, aromatic amines22, polycyclic aromatic hydrocarbons23, and polychlorinated biphenyls8. For example, Morales et al. developed a QSAR model for predicting the rodent carcinogenicity of nitrocompounds by applying a topological substructural molecular design approach, which gave a determination coefficient of 0.666 in leave-one-out validation21. Tanabe et al. constructed a series of support vector machine (SVM)-based SAR models using 20 mutually overlapping subgroups of 911 chemicals, and reported an overall classification accuracy of approximately 80%9. However, these models can only be applied to a specific group of congeneric chemicals; in other words, they have a limited applicability domain (AD), and are therefore unsuitable for regulatory use, where there is a need to evaluate diverse classes of chemicals.
In recent years, several SAR models for predicting the carcinogenicity of diverse classes of compounds have been developed based on heterogeneous databases16–20. For example, Fjodorova et al. presented a carcinogenic potency classification model for diverse chemicals that achieved an accuracy of 92.2% on the training set and 68.3% on the test set20. Their model was constructed using 27 molecular descriptors and a counter-propagation artificial neural network (CP ANN) technique based on a dataset containing 422 carcinogenic and 383 non-carcinogenic organic compounds20. Zhang et al. built a naïve Bayes classification model using five simple molecular descriptors and extended-connectivity fingerprints (ECFPs), and achieved an overall accuracy of 90% with an internal training set and 68% in five-fold cross-validation16. These models have a wide AD, but their accuracy in forecasting the carcinogenicity of new compounds (the accuracy estimated by cross-validation or external testing) remains unsatisfactory. Moreover, many models that achieve higher accuracy are generated through fine-tuning processes and have not been evaluated by an appropriate cross-validation.
Structural alert-based expert systems also achieve an overall accuracy of about 70% in predicting the carcinogenicity of compounds27, 31. This reflects that the carcinogenicity of a compound is closely related to its two-dimensional structure, which means that molecular fingerprints can be used to predict carcinogenicity.
Molecular fingerprints have been widely used in many aspects of computer-aided drug design, such as virtual screening32 and similarity search33, but are rarely used in the prediction of carcinogenicity. Using six types of fingerprints, Li et al. applied 30 classification models, the best of which was generated by MACCS fingerprints and a k-nearest neighbour (kNN) algorithm, with an overall accuracy of 80.46% in an external validation set17. However, the accuracy of the kNN model was only estimated using external validation, and did not use cross-validation.
Ensemble learning is a rather new machine learning model building method. Ensemble models can be formed by fusing a series of simple independent models (base classifiers) via voting or averaging. The ensemble learning method typically produces more accurate and robust models than any of its constituent models. On the other hand, it also has some limitations. For example, the computational cost for training and prediction is high, and the resulting model is difficult to interpret. Nevertheless, it has been successfully used in many cheminformatics and bioinformatics applications, such as hepatotoxicity prediction34, and phosphorylation sites prediction35. In this study, we apply this method to the prediction of carcinogenicity of chemicals.
The aim of the current study is to build classification models using different molecular fingerprints and ensemble machine learning methods to satisfactorily predict the carcinogenicity of diverse organic compounds, and to identify the structural features related to carcinogenic effects. The predictive performance of the models will be carefully evaluated by five-fold cross-validation with 100 repeats and external validation, which is commonly used in the evaluation of computational models36–41. The models are expected to be used in the early stages of drug discovery to filter potential carcinogens. For this purpose, a free carcinogenicity prediction online server has been built to enable public access to the models. The web server is called CarcinoPred-EL (Carcinogenicity Prediction using Ensemble Learning methods).
Results and Discussion
Dataset analysis
In this study, 1003 compounds collected from the Carcinogenic Potency Database (CPDB) were used as training data for building and validating the predictive models. This dataset contained 494 carcinogens and 509 non-carcinogens. As we know, the diversity of compounds in a database has an important effect on the prediction accuracy of a model. The chemical space distribution of the training set can be illustrated by a scatter plot of molecular weight (MW) against the logarithm of the octanol/water partition coefficient (AlogP) for both carcinogens and non-carcinogens. As shown in Fig. 1, the MW and ALogP of carcinogenic and non-carcinogenic compounds have a similar distribution, with MW ranging from approximately 50–900 Da and AlogP ranging from approximately −7–6, which is a broader range than that of most drugs. It is also clear from Fig. 1 that we cannot distinguish carcinogenic from non-carcinogenic compounds using MW and ALogP alone, because they occupy an overlapping chemical space. In addition to MW and AlogP, the distribution of four widely used molecular descriptors was investigated (number of hydrogen bond acceptors (nHBAcc), number of hydrogen bond donors (nHBDon), Weiner path number (Weiner), and the sum of the atomic polarizabilities (Apol)). Their overall distribution is shown in Fig. 2. These box plots reveal that carcinogens tend to have slightly smaller MW and Apol than non-carcinogens (Fig. 2b and f) as deduced from the median and the first and third quartiles of the box plots. For the distribution of ALogP, nHBAcc, nHBDon, and Weiner, there is no significant difference between carcinogens and non-carcinogens. Thus, it is difficult to predict the carcinogenicity of a compound using only simple molecular descriptors.
Figure 1.
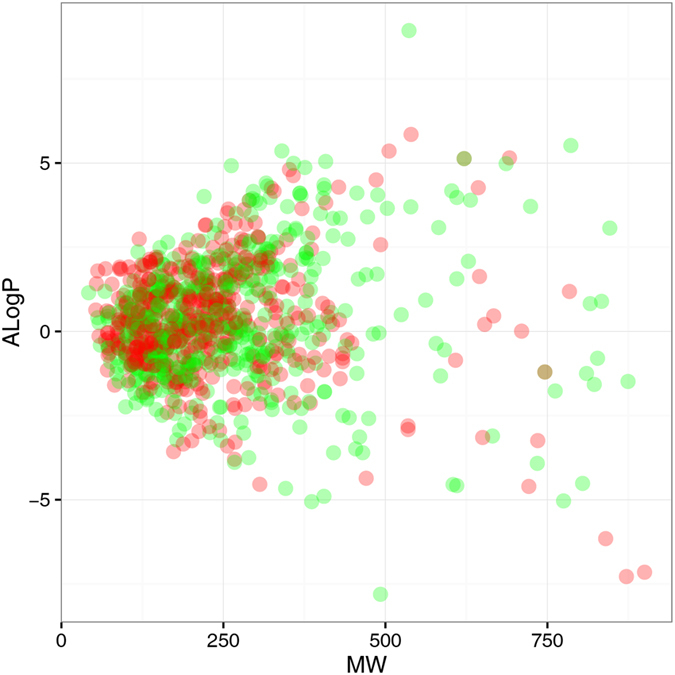
Chemical space of the training set. The chemical space is defined by the molecular weight (MW) on the X-axis and the logarithm of the octanol/water partition coefficient (ALogP) on the Y-axis. Carcinogens and non-carcinogens are represented by red and green dots, respectively.
Figure 2.
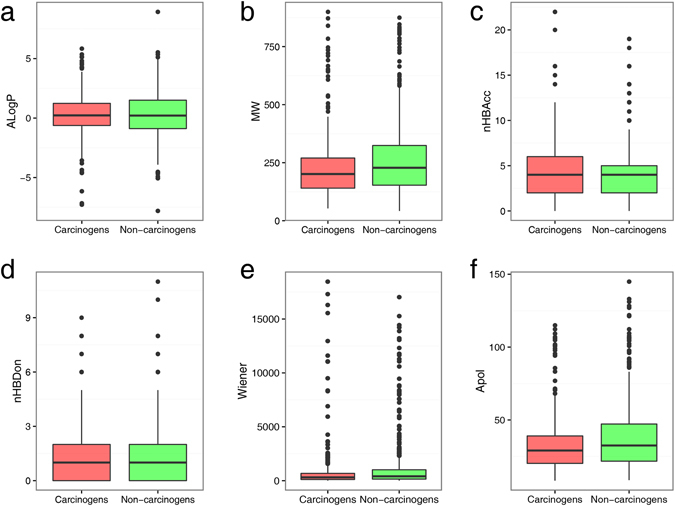
Box plot representing the molecular descriptors for carcinogens and non-carcinogens. Carcinogens and non-carcinogens are represented by red and green boxes, respectively.
Performance of the models
Twelve types of molecular fingerprints (Table 1) were generated for the compounds in the training dataset. Feature selection was then performed to remove the zero variation and collinear bits in each type of fingerprint. Based on the resulting fingerprints, 36 basic classifiers were generated using Support Vector Machine (SVM), Random Forest (RF), and Extreme Gradient Boosting (XGBoost) algorithms. The performance of these models was evaluated by five-fold cross-validation with 100 repeats. The mean and standard deviation of the performance indicators from these runs are presented in Table 2. The accuracy (Q) of these basic classifiers ranges from 61.1–68.4% and the area under the curve (AUC) ranges from 65.2–74.5%. The most accurate classifier is generated by the RF algorithm using CDKExt fingerprints, whereas the highest AUC score is given by the XGBoost algorithm using CDKExt fingerprints. It can be observed that there are small differences in accuracy for the classifiers generated by different algorithms using the same fingerprints. The general rule is that RF almost always achieves slightly higher accuracy than SVM and XGBoost. A bigger difference was observed among the classifiers generated using different fingerprints. The classifiers generated using the Estate (64.2% in RF model), FP4 (62.1%), FP4C (63.6%), AP2D (64.1%), and AP2DC (64.7%) fingerprints have significantly lower accuracy than those constructed from the other fingerprints. Hence, the basic classifiers generated based on the other seven fingerprints (CDK, CDKExt, CDKGraph, MACCS, Pubchem, KR, and KRC) were fused to develop ensemble models.
Table 1.
Performance of the basic classifiers in five-fold cross-validation. The performance values are represented as means and standard deviation.
| Algorithms | Fingerprints | Q (%) | SE (%) | SP (%) | AUC (%) |
|---|---|---|---|---|---|
| SVM | CDK | 67.5 ± 2.9 | 63.5 ± 4.9 | 71.5 ± 4.9 | 73.8 ± 3.0 |
| CDKExt | 67.9 ± 2.9 | 62.9 ± 5.1 | 72.7 ± 4.9 | 73.7 ± 3.2 | |
| CDKGraph | 65.0 ± 3.1 | 61.5 ± 5.2 | 68.4 ± 5.0 | 69.4 ± 3.4 | |
| Estate | 63.0 ± 2.9 | 57.8 ± 5.3 | 68.0 ± 5.0 | 68.3 ± 3.2 | |
| MACCS | 67.1 ± 3.1 | 63.6 ± 5.1 | 70.6 ± 4.9 | 72.0 ± 3.3 | |
| Pubchem | 68.1 ± 3.0 | 64.7 ± 4.9 | 71.5 ± 4.5 | 72.8 ± 3.2 | |
| FP4 | 64.6 ± 3.0 | 63.7 ± 4.9 | 65.4 ± 5.0 | 68.9 ± 3.1 | |
| FP4C | 62.2 ± 3.2 | 62.6 ± 5.0 | 61.8 ± 5.1 | 65.5 ± 3.5 | |
| KR | 66.5 ± 2.9 | 65.7 ± 4.9 | 67.2 ± 4.8 | 71.9 ± 3.1 | |
| KRC | 66.7 ± 3.0 | 67.5 ± 4.9 | 66.0 ± 5.1 | 72.1 ± 3.2 | |
| AP2D | 63.5 ± 3.0 | 56.3 ± 5.3 | 70.5 ± 5.4 | 68.3 ± 3.4 | |
| AP2DC | 63.4 ± 3.0 | 57.0 ± 6.1 | 69.7 ± 5.9 | 68.9 ± 3.2 | |
| RF | CDK | 68.3 ± 3.0 | 64.5 ± 5.1 | 72.1 ± 4.5 | 74.1 ± 3.1 |
| CDKExt | 68.4 ± 2.9 | 63.9 ± 4.8 | 72.8 ± 4.4 | 74.3 ± 3.1 | |
| CDKGraph | 66.6 ± 2.8 | 64.0 ± 4.7 | 69.0 ± 4.4 | 71.3 ± 3.1 | |
| Estate | 64.2 ± 3.0 | 61.6 ± 4.8 | 66.7 ± 4.9 | 69.9 ± 3.2 | |
| MACCS | 67.4 ± 2.9 | 63.4 ± 4.6 | 71.3 ± 4.4 | 73.1 ± 2.9 | |
| Pubchem | 68.0 ± 3.0 | 65.7 ± 4.9 | 70.3 ± 4.6 | 74.2 ± 3.1 | |
| FP4 | 62.1 ± 3.0 | 65.3 ± 4.8 | 59.1 ± 5.0 | 66.8 ± 3.4 | |
| FP4C | 63.6 ± 3.2 | 63.9 ± 5.0 | 63.3 ± 4.9 | 67.9 ± 3.5 | |
| KR | 67.0 ± 2.9 | 66.5 ± 4.8 | 67.6 ± 4.9 | 73.3 ± 3.0 | |
| KRC | 66.5 ± 2.9 | 68.0 ± 4.5 | 65.1 ± 4.6 | 73.0 ± 3.0 | |
| AP2D | 64.1 ± 2.9 | 56.5 ± 5.1 | 71.5 ± 4.7 | 68.2 ± 3.2 | |
| AP2DC | 64.7 ± 3.0 | 59.6 ± 5.4 | 69.7 ± 4.9 | 70.9 ± 3.3 | |
| XGBoost | CDK | 67.0 ± 3.0 | 65.9 ± 5.1 | 68.2 ± 4.9 | 73.6 ± 3.0 |
| CDKExt | 68.3 ± 2.9 | 66.0 ± 4.5 | 70.6 ± 4.4 | 74.5 ± 2.9 | |
| CDKGraph | 65.1 ± 3.1 | 64.7 ± 4.6 | 65.5 ± 4.8 | 70.8 ± 3.2 | |
| Estate | 63.0 ± 2.9 | 60.9 ± 4.8 | 65.0 ± 4.8 | 69.5 ± 3.0 | |
| MACCS | 67.2 ± 2.9 | 65.5 ± 4.9 | 68.8 ± 4.7 | 73.2 ± 2.9 | |
| Pubchem | 67.8 ± 3.1 | 66.7 ± 5.2 | 68.8 ± 4.8 | 73.8 ± 3.2 | |
| FP4 | 62.5 ± 2.7 | 66.1 ± 4.6 | 59.0 ± 4.4 | 65.9 ± 3.1 | |
| FP4C | 61.1 ± 3.2 | 61.3 ± 4.9 | 60.8 ± 5.1 | 65.2 ± 3.3 | |
| KR | 66.0 ± 3.0 | 66.8 ± 4.8 | 65.2 ± 4.9 | 72.7 ± 3.0 | |
| KRC | 66.5 ± 3.1 | 66.2 ± 4.8 | 66.8 ± 4.7 | 73.0 ± 3.1 | |
| AP2D | 64.4 ± 3.0 | 59.0 ± 5.0 | 69.5 ± 4.7 | 70.0 ± 3.3 | |
| AP2DC | 64.4 ± 3.2 | 60.9 ± 5.2 | 67.7 ± 4.8 | 70.9 ± 3.3 |
Table 2.
Performance of ensemble models in five-fold cross-validation. The performance values are represented as means and standard deviation.
| Models | Fingerprints | Q (%) | SE (%) | SP (%) | AUC (%) |
|---|---|---|---|---|---|
| Ensemble SVM | Top 7 | 69.4 ± 2.9 | 65.2 ± 5.2 | 73.5 ± 4.6 | 75.6 ± 3.0 |
| Ensemble RF | Top 7 | 69.2 ± 2.9 | 67.0 ± 5.1 | 71.3 ± 4.6 | 75.7 ± 2.9 |
| Ensemble XGBoost | Top 7 | 70.1 ± 2.9 | 67.0 ± 5.0 | 73.1 ± 4.4 | 76.5 ± 2.9 |
| Ensemble SVM 2 | All 12 | 69.1 ± 3.0 | 64.3 ± 5.3 | 73.7 ± 4.7 | 76.0 ± 3.1 |
| Ensemble RF 2 | All 12 | 68.6 ± 2.9 | 65.5 ± 4.9 | 71.6 ± 4.6 | 75.5 ± 3.0 |
| Ensemble XGBoost 2 | All 12 | 69.8 ± 3.0 | 65.8 ± 5.0 | 73.7 ± 4.5 | 76.6 ± 3.0 |
The performance of the ensemble models generated using these seven fingerprint sets were evaluated by five-fold cross-validation with 100 repeats. The results are shown in Table 2. It is interesting that the three ensemble models achieve significantly higher accuracy and AUC than any basic classifier. The accuracy of SVM, RF, and XGBoost improves by 1.3%, 0.8%, and 1.8%, respectively, and the AUC improves by 1.8%, 1.4%, and 2.0%, respectively, compared with the best basic classifier built by the same algorithm. Although the RF algorithm has the highest accuracy of the basic classifiers, the ensemble method exhibits the least improvement, resulting in performance equivalent to the ensemble SVM. Ensemble XGBoost is the most improved model, with performance indicators of accuracy, sensitivity, specificity, and AUC of 70.1 ± 2.9%, 67.0 ± 5.0%, 73.1 ± 4.4%, and 76.5 ± 2.9%, respectively. Ensemble models were also trained and evaluated using all 12 fingerprints. The resulting accuracy is lower than when using only the top-seven fingerprint sets, but still higher than the basic classifiers. Clearly, the ensemble method significantly improves the performance of SVM, RF and XGBoost in predicting the carcinogenicity of chemicals.
Furthermore, an external validation dataset containing 40 compounds from the ISSCAN database was used to further evaluate the performance of the ensemble models built using the top-seven fingerprint sets. Because these compounds were not involved in the construction of the models, the resulting performance reflects the ability of the models to predict the carcinogenicity of new compounds. The results in Table 3 indicate that all three models produce high overall prediction accuracy, comparable to that in five-fold cross-validation. Ensemble XGBoost is still the most accurate model. In addition, the AUC of the three models is very high, suggesting that the ensemble models have a good ability to sort the carcinogenic potential of the compounds. These results indicate that the three models established using seven types of molecular fingerprints and the ensemble learning methods can discriminate carcinogenic and non-carcinogenic compounds in both training data and external validation data with high accuracy.
Table 3.
Performance of ensemble models and some existing software in the external validation dataset.
| Models | Type | Q (%) | SE (%) | SP (%) | AUC (%) |
|---|---|---|---|---|---|
| Ensemble SVM | machine learning | 67.5 | 60.9 | 76.5 | 81.8 |
| Ensemble RF | machine learning | 65.0 | 56.5 | 76.5 | 80.1 |
| Ensemble XGBoost | machine learning | 70.0 | 65.2 | 76.5 | 80.3 |
| admetSAR | machine learning | 50.0 | 34.8 | 70.6 | 49.6 |
| PreADMET | machine learning | 62.5 | 52.2 | 76.5 | —a |
| VEGA CAESAR | machine learning | 70.0 | 65.2 | 76.5 | —a |
| VEGA ISS | rule based | 70.0 | 73.9 | 64.7 | —a |
| VEGA IRFMN/Antares | rule based | 70.0 | 78.3 | 58.8 | —a |
| VEGA IRFMN/ISSCAN-CGX | rule based | 75.0 | 82.6 | 64.7 | —a |
| Toxtree | rule based | 70.0 | 78.3 | 58.6 | —a |
| lazar | similarity search | 75.0 | 87.0 | 58.8 | —a |
aThe AUC cannot be calculated for this software because there are no probability values in its results.
These results indicate that the ensemble models will be useful for predicting the carcinogenicity of chemicals. For convenient use of these three ensemble models, a user-friendly web server called CarcinoPred-EL has been established (http://ccsipb.lnu.edu.cn/toxicity/CarcinoPred-EL/).
In addition, the method proposed in this study for building the ensemble model using different types of molecular fingerprints can be conveniently applied to the prediction of other toxicity endpoints or other pathological drug properties of chemicals. Since the molecular fingerprints generating methods and the machine learning algorithms used in this study are all publicly available, these models can be implemented as a software module in other programming environments, and integrated into larger software for predicting carcinogenicity and other pathological drug properties.
Comparison with previous methods
Previously, a number of computational methods have been established for predicting the carcinogenicity of chemicals. Here, we only compare with the SAR methods that have been evaluated using proper cross-validation, because the prediction performance estimated from conventional validation (dividing the dataset into two parts, one for training and one for testing) may be biased by the single split of data. The performance indicators and evaluation method of some recent reported chemical carcinogenicity classification models are summarized in Table 4. From Tables 2 and 4, we can see the following. (1) Compared with previous models, the three proposed ensemble models achieve high overall accuracy (Q). In detail, the IRFMN/ISSCAN-CGX29 model implemented in VEGA software42 achieves an overall accuracy of 72%, which is higher than that of our models. The MDL-QSAR14 model achieves an overall accuracy comparable to our models. And the overall accuracy of other models was lower. (2) Although the specificity (SP) of the ensemble models is lower than that of MDL-QSAR, lazar, and Naïve Bayesian, their sensitivity (SE) is significantly higher (about 5%). SE represents the ability to correctly identify carcinogens. This is considered to be a more important indicator of the quality of a predictor for carcinogenicity classification8 because, for human health safety, successful prediction of carcinogens is more important than successful prediction of non-carcinogens. It is noteworthy that the sensitivity of the two rule-based models (IRFMN/Antares and IRFMN/ISSCAN-CGX in VEGA) is significantly higher. But their specificity is low. (3) All models, excepting the two rule-based models, yield larger SP and smaller SE. This phenomenon suggests that lower specificity may be a common characteristic of machine learning based carcinogenicity prediction models. To overcome this drawback, future research should consider not only the overall accuracy of a model, but also its sensitivity. Note that the differences between SP and SE of the three ensemble models are 8.3% (Ensemble SVM), 4.3% (Ensemble RF), and 6.1% (Ensemble XGBoost), which is much less than the 9.5% (MC4PC), 12.0% (MDL-QSAR), 13.5% (lazar), and 22% (Naïve Bayesian) of the other machine learning based models. This indicates that our approach has made some advances in improving the sensitivity of machine learning based models.
Table 4.
Performance indicators and the evaluation method of some carcinogenicity classification models reported in the literature.
| Model name | Evaluation method | Q (%) | SE (%) | SP (%) | Reference |
|---|---|---|---|---|---|
| MC4PCa | 10-fold CVe | 66.5 | 61.4 | 70.9 | 14 |
| MDL-QSARb | 10-fold CV | 69.2 | 62.8 | 74.8 | 14 |
| lazar | LOOCVf | 66.9 | 59.9 | 73.4 | 15 |
| Naïve Bayesian | 5-fold CV | 68 | 57 | 79 | 16 |
| CP ANN MDLc | 5-fold CVg | 66 | — | — | 12 |
| CP ANN Dragon (VEGA CAESAR)c | 5-fold CV | 62 | — | — | 12 |
| VEGA IRFMN/Antares | 5-fold CV | 66.0 | 83.1 | 48.3 | 29 |
| VEGA IRFMN/ISSCAN-CGXd | 5-fold CV | 72.7 | 76.5 | 61.8 | 29 |
aThe coverage of this model was 96%. bThe coverage of this model was 97%. cThis study did not provide the SE and SP of the models. dThis model was trained using carcinogenesis data from both rats and mice. eTen-fold cross-validation. fLeave-one-out cross-validation. gFive-fold cross-validation.
Moreover, the performance of the ensemble models was compared with some existing software, including admetSAR43, PreADMET44, VEGA42, Toxtree45, and lazar46, using the external validation dataset. Table 3 presents performance indicators for the three ensemble models, the T_Carc_I model13 in admetSAR, the Carcino_Rat model in PreADMET, the four VEGA models (CAESAR12, ISS27, 28, IRFMN/Antares29, and IRFMN/ISSCAN-CGX29), the ISS model27, 28 implemented in Toxtree, and the rat carcinogenicity endpoint15 of lazar. As shown in the table, the accuracy of admetSAR and PreADMET on this dataset is 50.5% and 62.5%, respectively, significantly lower than in the three ensemble models. The low accuracy of these software models is mainly due to their low sensitivity, indicating a poor ability to identify carcinogens. The CAESAR model in the VEGA software offers similar predictive performance to the Ensemble XGBoost model, and outperforms the Ensemble SVM and Ensemble RF models. The CAESAR model (CP ANN Dragon in Table 4) was also evaluated using five-fold cross-validation, achieving an overall accuracy of 62%12. The IRFMN/ISSCAN-CGX model has an accuracy of 75%, but this high score may be due to some overlap of the data source for the external validation dataset (from ISSCAN) with the training set of the IRFMN/ISSCAN-CGX model (from ISSCAN and CGX). The rule-based models (i.e., ISS, IRFMN/Antares, and IRFMN/ISSCAN-CGX) achieve high accuracy of approximately 70.0% and significantly higher sensitivity than machine learning-based methods, indicating that they have a very strong ability to identify carcinogens. However, their specificity is significantly lower than that of machine learning methods. This indicates that machine learning algorithms tend to accurately predict non-carcinogenic chemicals, whereas rule-based expert systems tend to accurately predict carcinogenic chemicals. The lazar model, using a modified kNN algorithm, has the best accuracy and sensitivity among the tested software, but its performance is relatively poor in leave-one-out cross-validation (Table 4).
As shown above, the three ensemble models have achieved good performance. Nevertheless, there are still some weakest links. Obviously, the execution speed of the ensemble models is slow. When predicting carcinogenicity of new compounds, seven types of molecular fingerprints will firstly be generated. Based on these fingerprints, seven different basic classifiers will be performed, and their results will be averaged to generate the final prediction. This process is relatively computationally expensive, causing the ensemble model to be the slowest among the above mentioned software. Secondly, as with other machine learning based models, the sensitivity of the ensemble models is relatively low. In the future studies, increasing sensitivity should be prioritized. Moreover, as these models predict carcinogenicity of new compounds based on the rule mined from known dataset, although the performance of these models were carefully evaluated by 100 times five fold cross-validation and an external validation, these models are still likely to produce unreliable results when predicting novel compounds that shares few substructure to the compounds in the training dataset. Therefore, these models currently are not suitable to be a standard tool for evaluating carcinogenicity of new compounds, they are preferably suitable for preliminary screening of carcinogenic compounds in early stages of drug discovery.
The effect of sample size on the performance of the ensemble models
To understand the effect of the number of compounds in the training set on the performance of the resulting ensemble model, the 1003 compounds in the training set were randomly sampled to form datasets containing 100–1000 (at intervals of 100) compounds, and a new ensemble RF model was trained for each dataset. Its performance was then evaluated by five-fold cross-validation and an external validation. The above sampling, training, and evaluation process was repeated 100 times to avoid any bias. As this process is computationally intensive, only the ensemble RF model (in which there is no need to tune the parameters) was investigated. As shown in Fig. 3, the results from five-fold cross-validation (Fig. 3a) and the external validation (Fig. 3b) show that the mean specificity for the RF ensemble model reaches a maximum with 700 compounds in the dataset, and then decreases slightly as the number of compounds increases to 1000. This implies that the available data may have already provided sufficient information on non-carcinogens for the RF ensemble model. It is obvious that the mean accuracy, sensitivity, and AUC increase with the number of compounds in the training set, and these metrics do not reach a plateau until the sample size reaches 1000. These results suggest that the performance, especially the accuracy, sensitivity, and AUC, of the ensemble models could be further improved by the use of more data.
Figure 3.
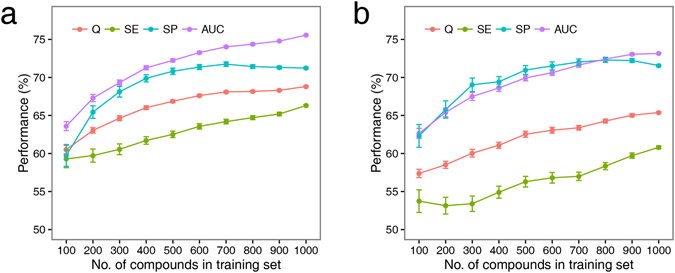
Performance on five-fold cross-validation (a) and external validation (b) as a function of number of compounds in training set for RF ensemble models. The performance values are represented as means and standard error.
Substructures related to carcinogenicity
The RF algorithm can estimate the importance of the features used in the model by calculating the mean decrease of the Gini index (MeanDecreaseGini) for each feature. Molecular substructures related to the carcinogenicity of the compounds can be identified by analysing the important bits in the molecular fingerprints. In the present study, feature importance analysis was performed for the RF models trained with the Estate, MACCS, Pubchem, FP4, KR, and AP2D fingerprints. The five most important features (with larger values of MeanDecreaseGini) for each fingerprint are shown in Fig. 4. As shown in the figure, there are 10 features with significantly higher MeanDecreaseGini values, suggesting that the substructures represented by these features may be closely related to the carcinogenicity of chemicals. The description and number of occurrences in carcinogens and non-carcinogens for these substructures are listed in Table 5. It can be seen that most of the top-ranking substructures are nitrogen-containing groups, such as the N-N, N-O, N = O, -N = groups, which occur more often in carcinogens than in non-carcinogens. Many of the known carcinogenic compounds, such as nitrosamines and nitrosoureas, contain these substructures. These features are components in many structure alerts (SA) that are used to build rule-based carcinogenicity classifiers, e.g., Aliphatic N-nitro, Alkyl nitrite, and Nitro aromatic SAs developed by Benigni et al.27. The fingerprint key of FP4-88 shows that carboxylic acid derivative is mostly present in non-carcinogens. Although the patterns of the substructures proposed in this study are very simple, and may not be suitable as SAs for rule-based carcinogenicity prediction, these substructures should be taken into consideration in the early stages of drug design.
Figure 4.
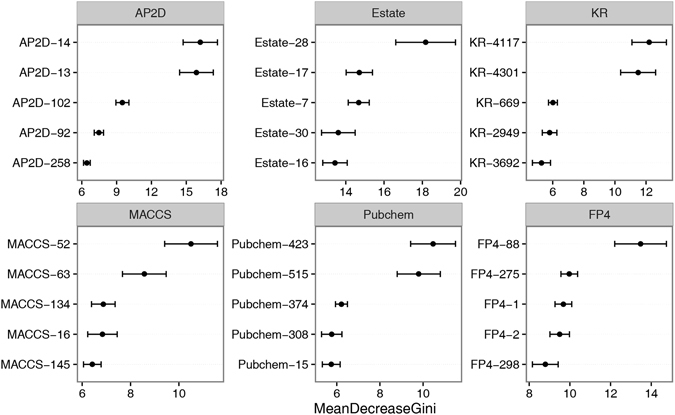
Feature importance results for top-five features from each RF model trained with Estate, MACCS, Pubchem, FP4, KR, and AP2D fingerprints. The MeanDecreaseGini values are represented as means and standard deviation.
Table 5.
Top ranking substructures and their corresponding description and the number of occurrence in carcinogens and non-carcinogens.
| Fingerprint Key | Description | SMARTS Pattern | Present in Carcinogens | Present in Non-Carcinogens |
|---|---|---|---|---|
| AP2D-14 | N-O at topological distance 1 | [#7]~[#8] | 175 | 67 |
| AP2D-13 | N-N at topological distance 1 | [#7]~[#7] | 160 | 54 |
| Estate-28 | dsN | [ND2H0]( = *)-* | 155 | 69 |
| KR-4117 | N = O | N = O | 162 | 59 |
| KR-4301 | NN | NN | 137 | 40 |
| MACCS-52 | NN | [#7]~[#7] | 160 | 54 |
| MACCS-63 | N = O | [#7] = [#8] | 162 | 59 |
| Pubchem-423 | N = O | [#7] = ,:[#8] | 163 | 60 |
| Pubchem-515 | N-N-C-C | N-N-C-C | 131 | 43 |
| FP4-88 | Carboxylic acid derivative | [$([#6X3 H0][#6]),$([#6X3H])]( = [!#6])[!#6] | 136 | 234 |
Case studies: discovery of potential carcinogens in drugs
Carcinogenicity is a serious adverse drug reaction that has already occurred in many approved drugs. As reviewed by Onakpoya et al.3, 61 medicinal products were withdrawn from the market between 1953 and 2013 because of carcinogenicity, accounting for 13% of all withdrawn. Some approved drugs or experimental drugs may also be carcinogens47. To identify potential carcinogens in drugs, the three ensemble models proposed in this study were employed to predict the carcinogenicity of 6538 approved and experimental small molecular drugs from the DrugBank database48. Among these drug molecules, 634 were predicted to be carcinogens by the ensemble SVM model, 554 were predicted to be carcinogens by the ensemble RF model, 742 were predicted to be carcinogens by the ensemble XGBoost model, and 394 were simultaneously predicted to be carcinogens by all three ensemble models. Among these 394 compounds, 61 were duplicates of compounds in the training set. Thus, our models have identified 333 potentially carcinogenic drugs.
We investigated the carcinogenicity of those drugs with predicted probabilities greater than 0.8 by searching the literature. The results are presented in Table 6. Four approved drugs are classified by the International Agency for Research on Cancer (IARC). Carmustine, Trypan blue, and Lomustine are Group 2 carcinogens, denoting that they are probably carcinogenic to humans and definitely carcinogenic to experimental animals, whereas Furazolidone is a Group 3 carcinogen that is recognized as a genotoxic carcinogen by the FAO/WHO Expert Committee on Food Additives because of its increased incidence of malignant tumours in mice and rats. Fotemustine and 1-Aminoanthracene have been reported to be a base-pair mutagen to Salmonella and to have genotoxic potency in Drosophila49–51. Additionally, 9-hydroxy aristolochic acid is a derivative of aristolochic acid, which is a strong carcinogen and has been classified by the IARC as a Group 1 agent. Five of the drugs predicted to be carcinogens are corticosteroids with very similar chemical structures, with Flunisolide recognized as causing an increased incidence of mammary adenocarcinomas in female rats in a long-term carcinogenesis assay52. We did not find any studies on carcinogenicity for the three experimental drugs 1,8-Dihydroxy-4-Nitroanthraquinone, Iodoindomethacin, and tert-butyl N-[cyano(methyl)amino]carbamate. As these experimental drugs were predicted as having a high probability of being carcinogens, developers should pay close attention to their carcinogenicity.
Table 6.
Predicted carcinogenic drugs with predicted probabilities >0.8.
| DrugBank ID | Name | Probabilities | Remarks | ||
|---|---|---|---|---|---|
| SVM | RF | XGBoost | |||
| DB00262 | Carmustine | 0.8 | 0.87 | 0.96 | IARC Group 2A |
| DB09158 | Trypan blue | 0.78 | 0.91 | 0.95 | IARC Group 2B |
| DB00614 | Furazolidone | 0.73 | 0.85 | 0.94 | IARC Group 3 |
| DB01206 | Lomustine | 0.71 | 0.78 | 0.91 | IARC Group 2A |
| DB04106 | Fotemustine | 0.71 | 0.74 | 0.89 | Mutagen to Salmonella |
| DB01260 | Desonide | 0.73 | 0.83 | 0.87 | Corticosteroid |
| DB03035 | 1,8-Dihydroxy-4-Nitroanthraquinone | 0.72 | 0.73 | 0.85 | — |
| DB00288 | Amcinonide | 0.69 | 0.73 | 0.84 | Corticosteroid |
| DB02636 | 9-hydroxy aristolochic acid | 0.65 | 0.69 | 0.83 | Derivative of aristolochic acid (IARC Group 1) |
| DB07983 | Iodoindomethacin | 0.64 | 0.7 | 0.82 | — |
| DB00591 | Fluocinolone Acetonide | 0.73 | 0.82 | 0.81 | Corticosteroid |
| DB00180 | Flunisolide | 0.73 | 0.81 | 0.81 | Corticosteroid |
| DB01047 | Fluocinonide | 0.69 | 0.73 | 0.81 | Corticosteroid |
| DB08594 | tert-butyl N-[cyano(methyl)amino]carbamate | 0.69 | 0.64 | 0.8 | — |
| DB01976 | 1-Aminoanthracene | 0.71 | 0.8 | 0.73 | Mutagen to Genotoxic to DrosophilaSalmonella |
The full list of 333 potentially carcinogenic drugs along with their predicted probabilities is presented in Supplementary Table S1.
Conclusions
In this study, three novel ensemble machine learning models (Ensemble RF, Ensemble SVM, and Ensemble XGBoost) were developed to predict the carcinogenicity of chemicals in rats using molecular fingerprint representations of 1003 structurally diverse compounds. The ensemble models outperformed their basic classifiers in both overall accuracy and AUC. The best ensemble model (Ensemble XGBoost) attained an average accuracy of 70.1 ± 2.9%, sensitivity of 67.0 ± 5.0%, specificity of 73.1 ± 4.4%, and AUC of 76.5 ± 2.9% in five-fold cross-validation and an accuracy of 70.0%, sensitivity of 65.2%, specificity of 76.5%, and AUC of 80.3% in external validation. Compared with recent carcinogenicity predictors, the new ensemble models yielded good prediction quality, as demonstrated by their high accuracy and sensitivity in cross-validation. Compared with some existing software using an external validation dataset, the new ensemble models yielded high accuracy and sensitivity among machine learning-based models and similar accuracy but significantly lower sensitivity than rule-based systems. By analysing the effect of sample size on the performance of the ensemble models, we found that the accuracy, sensitivity, and AUC of the ensemble models could be further improved in the future when more data are available. Moreover, some substructures related to carcinogenicity were identified from six types of molecular fingerprints. As an application of the proposed models, 333 potentially carcinogenic drugs were identified from the DrugBank database. These models could be useful in the early stages of drug discovery for filtering potential carcinogens. The ensemble methods used in this paper could also be extended to predict other toxicity end points.
The three ensemble models have been integrated into a web server, which is freely available at http://ccsipb.lnu.edu.cn/toxicity/CarcinoPred-EL/.
Materials and Methods
Data Preparation
The training dataset used to develop models for predicting the carcinogenicity of diverse organic compounds was derived from the Carcinogenic Potency Database (CPDB) summary tables (CPDBAS, version 5d)53, which is a unique and standardized resource of long-term animal carcinogenesis study results on more than 1500 chemical substances. In the CPDB, chemicals are labelled as active (carcinogens) or inactive (non-carcinogens) according to their TD50 values. In the present study, we only considered the carcinogenicity data of the compounds against rats, as the results from rats were considered more suitable for predicting human carcinogenicity54, 55. To build robust predictive models, the following compounds were excluded: (1) compounds containing less than three carbon atoms; (2) compounds containing heavy metals; (3) polymers; (4) mixtures. As a result, 1003 compounds for rat carcinogenicity, including 494 carcinogens and 509 non-carcinogens, were remained as the training set for building predictive models. The details of the molecules in the training dataset are provided in Supplementary Table S2.
To further evaluate the predictive performance of the models, an external validation dataset containing compounds that do not duplicate the training dataset was constructed from the ISSCAN database56. The external test set contained 40 compounds, of which 23 are carcinogenic compounds and 17 are non-carcinogenic compounds. Details of the molecules in the external validation dataset are provided in Supplementary Table S3.
The DrugBank database version 5.048 contains 8246 approved and experimental drug entries. We selected 6538 small molecular drugs that matched the selection criteria of the training set from this database. As an application example, the carcinogenicity of these molecules was estimated by our predictive models.
Calculation of Molecular Fingerprints
In this study, twelve types of molecular fingerprints were generated to represent the chemical structures of the compounds. The fingerprints and their corresponding size and pattern type are summarized in Table 7. All the fingerprints were generated by the PaDEL-Descriptor software (version 2.21)57. Prior to the generation of the molecular fingerprints, salt was removed using the -removesalt parameter of the PaDEL-Descriptor. Each bit of these molecular fingerprints was used as a feature in the machine learning process.
Table 7.
Summary of the 12 types of molecular fingerprints.
| Fingerprint Type | Abbreviation | Pattern Type | Size (bits) | Selected (bits) |
|---|---|---|---|---|
| CDK | CDK | Hash fingerprints | 1024 | 931 |
| CDK Extended | CDKExt | Hash fingerprints | 1024 | 942 |
| CDK Graph | CDKGraph | Hash fingerprints | 1024 | 233 |
| Estate | Estate | Structural features | 79 | 19 |
| MACCS | MACCS | Structural features | 166 | 84 |
| Pubchem | Pubchem | Structural features | 881 | 106 |
| Substructure | FP4 | Structural features | 307 | 31 |
| Substructure Count | FP4C | Structural features count | 307 | 27 |
| Klekota-Roth | KR | Structural features | 4860 | 97 |
| Klekota-Roth Count | KRC | Structural features count | 4860 | 59 |
| 2D Atom Pairs | AP2D | Structural features | 780 | 47 |
| 2D Atom Pairs Count | AP2DC | Structural features count | 780 | 25 |
To investigate the chemical space distribution of the compounds, six molecular descriptors (logarithm of the octanol/water partition coefficient (ALogP), molecular weight (MW), number of hydrogen bond acceptors (nHBAcc), number of hydrogen bond donors (nHBDon), Weiner path number (Weiner), and sum of the atomic polarizabilities (Apol)) that are widely used in ADME/T prediction were also calculated by the PaDEL-Descriptor.
Feature selection
Feature selection is an important procedure for building predictive models. The deletion of redundant features can simplify the generated model, prevent overfitting, and enhance the generalization ability of the model. In this study, features that had only a single unique value (zero variation features) in the training dataset were identified and removed using the nearZeroVar function from the R package caret (version 6.0–71)58. The pairwise Pearson’s correlation coefficients among the remaining features were then calculated. Highly correlated features (Pearson’s correlation coefficients >0.7) were filtered out using the findCorrelation function from caret 58. The remaining features (bits) for each molecular fingerprint are summarized in Table 7.
Model building
Ensemble machine learning models formed by fusing a series of simple independent models (base classifiers) via voting or averaging usually produce more accurate results than any of the single models.
In this study, three ensemble models were proposed using three different machine learning algorithms, namely SVM, RF, and XGBoost. Twelve base classifiers were built for each ensemble model by applying the different molecular fingerprints to the corresponding machine learning algorithms. The basic classifiers with better predictive performance were fused to form the ensemble model via averaging the probabilities from the basic classifiers. A flowchart of the ensemble model building process is shown in Fig. 5.
Figure 5.
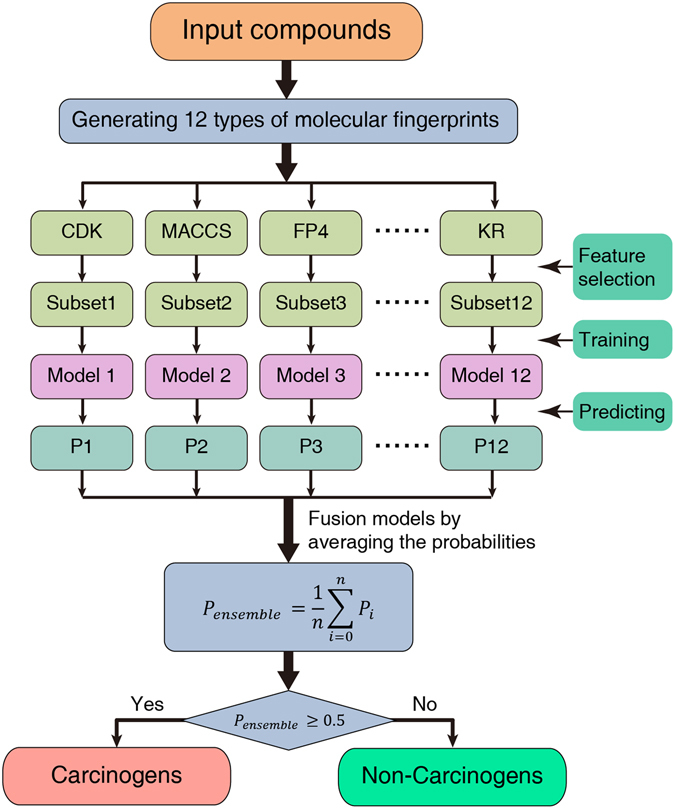
Flowchart to show the ensemble model building process.
The SVM, RF, and XGBoost algorithms were all executed in R (version 3.3.1) using the kernlab (version 0.9–25)59, randomForest (version 4.6–12)60, and xgboost (version 0.4–4)61 packages, respectively. A brief description of the basic theory of each algorithm and how they were used in this study is provided below.
Support vector machine
An SVM is an efficient supervised machine learning method based on the principle of structural risk minimization. This algorithm maps the input data into a high-dimensional feature space through some kernel functions and constructs an optimal separating hyperplane in this space. In this study, the radial basis kernel function (RBF) was used to implement the SVM models. The regularization parameter C and the kernel width parameter gamma were optimized through the random search method62, which was implemented in the caret package.
Random forest
RF is an ensemble machine learning method in which a multitude of decision trees are combined using randomly selected subsets of training samples and features. RF is considered to be more accurate and robust than decision trees. One of the most important advantages of RF is that it can handle a large number of features without overfitting, and can give an estimate of the importance of the features. There are two main parameters in RF, the number of trees in the forest (ntree) and the number of features randomly sampled (mtry). In this study, the default values of these parameters were used, that is, ntree = 500 and mtry = the square root of the number of features in the dataset. The feature importance for each type of molecular fingerprint was analysed using the importance function in the randomForest package.
Extreme gradient boosting
XGBoost is a new implementation of the gradient tree boosting technique. XGBoost has been tested in a series of datasets for QSAR modelling, achieving high accuracy and requiring much less computation time than deep neural nets63. There are several adjustable parameters in XGBoost. In this study, the step size shrinkage (eta), maximum depth of tree (max.depth), minimum sum of instance weight (min.child.weight), and the maximum number of iterations (nrounds) were optimized by the caret package.
Performance Evaluation
The performance of the basic classifiers and ensemble models was evaluated by five-fold cross-validation with 100 repeats. In detail, the training set was randomly divided into five equal parts. Four parts were used to train the classifier, and the fifth part was used as a test set to evaluate the performance of the classifier. Thus, five classifiers and performance indicators can be obtained. To reduce the randomness of the results, the five-fold cross-validation was repeated 100 times, resulting in a total of 500 sets of performance indicators. The performance indicators were aggregated to give an accurate performance evaluation of each model. In addition, the final ensemble models and some existing methods (software) were also evaluated using an external validation dataset.
Four performance indicators were used to evaluate the models, namely accuracy (Q), specificity (SP), sensitivity (SE), and the area under the receiver operating characteristic curve (AUC). The accuracy represents the overall prediction accuracy of carcinogens and non-carcinogens. Specificity represents the predictive accuracy for non-carcinogens, and sensitivity describes the predictive accuracy for carcinogens. The indicators were calculated as follows:
| 1 |
| 2 |
| 3 |
where TP (true positive) denotes the number of correctly predicted carcinogens, TN (true negative) represents the number of correctly predicted non-carcinogens, FP (false positive) represents the number of non-carcinogens predicted to be carcinogens, and FN (false negative) represents the number of carcinogen compounds predicted to be non-carcinogens.
The receiver operating characteristic curve (ROC) is a plot of the TP rate (sensitivity) against the FP rate (1-specificity) for the different possible cutoff points of a diagnostic test. The AUC was calculated as an indicator of model predictiveness.
Electronic supplementary material
Acknowledgements
This work was supported by the National Natural Science Foundation of China (No: 31570160), Innovation Team Project (No: LT2015011) and General Research Project Foundation (No: L2014001) of Education Department of Liaoning Province, Large-scale Equipment Shared Services Project (No: F15165400) and Applied Basic Research Project (No: F16205151) of Science and Technology Bureau of Shenyang. This project was supported by Engineering Laboratory for Molecular Simulation and Designing of Drug Molecules of Liaoning and Research Center for Computer Simulating and Information Processing of Bio-macromolecules of Liaoning Province.
Author Contributions
L.Z., H.A. and H.L. conceived the prediction method. L.Z., H.A. and W.C. developed the prediction method. W.C., L.Z. and H.H. developed the web server. L.Z., Z.Y. and Q.Z. compared the proposed model with previous methods. Z.Y., J.Z. and J.Z. performed the case study. L.Z., H.A., W.C., Z.Y., H.H., Q.Z. and H.L. contributed to the discussion and manuscript writing. All authors read and approved the final manuscript.
Competing Interests
The authors declare that they have no competing interests.
Footnotes
Li Zhang and Haixin Ai contributed equally to this work.
Electronic supplementary material
Supplementary information accompanies this paper at doi:10.1038/s41598-017-02365-0
Publisher's note: Springer Nature remains neutral with regard to jurisdictional claims in published maps and institutional affiliations.
References
- 1.Parasuraman S. Toxicological screening. J. Pharmacol. Pharmacother. 2011;2:74–79. doi: 10.4103/0976-500X.81895. [DOI] [PMC free article] [PubMed] [Google Scholar]
- 2.Segall MD, Barber C. Addressing toxicity risk when designing and selecting compounds in early drug discovery. Drug Discov. Today. 2014;19:688–693. doi: 10.1016/j.drudis.2014.01.006. [DOI] [PubMed] [Google Scholar]
- 3.Onakpoya IJ, Heneghan CJ, Aronson JK. Post-marketing withdrawal of 462 medicinal products because of adverse drug reactions: a systematic review of the world literature. BMC Med. 2016;14:10. doi: 10.1186/s12916-016-0553-2. [DOI] [PMC free article] [PubMed] [Google Scholar]
- 4.Jacobs A, Hatfield K. History of chronic toxicity and animal carcinogenicity studies for pharmaceuticals. Vet. Pathol. 2013;50:324–333. doi: 10.1177/0300985812450727. [DOI] [PubMed] [Google Scholar]
- 5.Jacobs AC, Brown PC. Regulatory Forum Opinion Piece* Transgenic/Alternative Carcinogenicity Assays: A Retrospective Review of Studies Submitted to CDER/FDA 1997–2014. Toxicol. Pathol. 2015;43:605–610. doi: 10.1177/0192623314566241. [DOI] [PubMed] [Google Scholar]
- 6.Raies AB, Bajic VB. In silico toxicology: computational methods for the prediction of chemical toxicity. Wiley Interdiscip. Rev. Comput. Mol. Sci. 2016;6:147–172. doi: 10.1002/wcms.1240. [DOI] [PMC free article] [PubMed] [Google Scholar]
- 7.Benigni R. Predicting the carcinogenicity of chemicals with alternative approaches: recent advances. Expert Opin. Drug Met. Toxicol. 2014;10:1199–1208. doi: 10.1517/17425255.2014.934670. [DOI] [PubMed] [Google Scholar]
- 8.Ruiz P, et al. Prediction of the health effects of polychlorinated biphenyls (PCBs) and their metabolites using quantitative structure-activity relationship (QSAR) Toxicology letters. 2008;181:53–65. doi: 10.1016/j.toxlet.2008.06.870. [DOI] [PubMed] [Google Scholar]
- 9.Tanabe K, et al. Improvement of carcinogenicity prediction performances based on sensitivity analysis in variable selection of SVM models. SAR. QSAR. Environ. Res. 2013;24:565–580. doi: 10.1080/1062936X.2012.762425. [DOI] [PubMed] [Google Scholar]
- 10.Tanabe K, et al. Prediction of carcinogenicity for diverse chemicals based on substructure grouping and SVM modeling. Mol. Divers. 2010;14:789–802. doi: 10.1007/s11030-010-9232-y. [DOI] [PubMed] [Google Scholar]
- 11.Tharwat A, Moemen YS, Hassanien AE. A Predictive Model for Toxicity Effects Assessment of Biotransformed Hepatic Drugs Using Iterative Sampling Method. Sci. Rep. 2016;6:38660. doi: 10.1038/srep38660. [DOI] [PMC free article] [PubMed] [Google Scholar]
- 12.Fjodorova, N., Vračko, M., Novič, M., Roncaglioni, A. & Benfenati, E. New public QSAR model for carcinogenicity. Chem. Cent. J. 4 (Suppl 1), 1, S3, 10.1186/1752-153X-4-S1-S3 (2010). [DOI] [PMC free article] [PubMed]
- 13.Lagunin A, et al. Computer-Aided Prediction of Rodent Carcinogenicity by PASS and CISOC-PSCT. QSAR. Comb. Sci. 2009;28:806–810. doi: 10.1002/qsar.200860192. [DOI] [Google Scholar]
- 14.Contrera JF, Kruhlak NL, Matthews EJ, Benz RD. Comparison of MC4PC and MDL-QSAR rodent carcinogenicity predictions and the enhancement of predictive performance by combining QSAR models. Regul. Toxicol. Pharm. 2007;49:172–182. doi: 10.1016/j.yrtph.2007.07.001. [DOI] [PubMed] [Google Scholar]
- 15.Helma C. Lazy structure-activity relationships (lazar) for the prediction of rodent carcinogenicity and Salmonella mutagenicity. Mol. Divers. 2006;10:147–158. doi: 10.1007/s11030-005-9001-5. [DOI] [PubMed] [Google Scholar]
- 16.Zhang H, Cao ZX, Li M, Li YZ, Peng C. Novel naïve Bayes classification models for predicting the carcinogenicity of chemicals. Food Chem. Toxicol. 2016;97:141–149. doi: 10.1016/j.fct.2016.09.005. [DOI] [PubMed] [Google Scholar]
- 17.Li X, et al. In Silico Estimation of Chemical Carcinogenicity with Binary and Ternary Classification Methods. Mol. Inform. 2015;34:228–235. doi: 10.1002/minf.201400127. [DOI] [PubMed] [Google Scholar]
- 18.Zhong M, Nie X, Yan A, Yuan Q. Carcinogenicity prediction of noncongeneric chemicals by a support vector machine. Chem. Res. Toxicol. 2013;26:741–749. doi: 10.1021/tx4000182. [DOI] [PubMed] [Google Scholar]
- 19.Singh KP, Gupta S, Rai P. Predicting carcinogenicity of diverse chemicals using probabilistic neural network modeling approaches. Toxicol. Appl. Pharmacol. 2013;272:465–475. doi: 10.1016/j.taap.2013.06.029. [DOI] [PubMed] [Google Scholar]
- 20.Fjodorova N, et al. Quantitative and qualitative models for carcinogenicity prediction for non-congeneric chemicals using CP ANN method for regulatory uses. Mol. Divers. 2010;14:581–594. doi: 10.1007/s11030-009-9190-4. [DOI] [PubMed] [Google Scholar]
- 21.Morales AH, Pérez MÁC, Combes RD, González MP. Quantitative structure activity relationship for the computational prediction of nitrocompounds carcinogenicity. Toxicology. 2006;220:51–62. doi: 10.1016/j.tox.2005.11.024. [DOI] [PubMed] [Google Scholar]
- 22.Benigni R, Giuliani A, Franke R, Gruska A. Quantitative structure-activity relationships of mutagenic and carcinogenic aromatic amines. Chem. Rev. 2000;100:3697–3714. doi: 10.1021/cr9901079. [DOI] [PubMed] [Google Scholar]
- 23.Zhou Z, Dai Q, Gu T. A QSAR model of PAHs carcinogenesis based on thermodynamic stabilities of biactive sites. J. Chem. Inf. Comput. Sci. 2003;43:615–621. doi: 10.1021/ci0256135. [DOI] [PubMed] [Google Scholar]
- 24.Wu X, Zhang Q, Wang H, Hu J. Predicting carcinogenicity of organic compounds based on CPDB. Chemosphere. 2015;139:81–90. doi: 10.1016/j.chemosphere.2015.05.056. [DOI] [PubMed] [Google Scholar]
- 25.Toropova AP, Toropov AA. CORAL software: prediction of carcinogenicity of drugs by means of the Monte Carlo method. Eur. J. Pharm. Sci. 2014;52:21–25. doi: 10.1016/j.ejps.2013.10.005. [DOI] [PubMed] [Google Scholar]
- 26.Sushko I, Salmina E, Potemkin VA, Poda G, Tetko IV. ToxAlerts: a web server of structural alerts for toxic chemicals and compounds with potential adverse reactions. J. Chem. Inf. Model. 2012;52:2310–2316. doi: 10.1021/ci300245q. [DOI] [PMC free article] [PubMed] [Google Scholar]
- 27.Benigni, R., Cecilia, B., Nina, J., Tatiana, N. & Andrew, W. The Benigni/Bossa rulebase for mutagenicity and carcinogenicity-a module of Toxtree. JRC Scientific and Technical Reports (2008).
- 28.Benigni R, Bossa C, Tcheremenskaia O. Nongenotoxic carcinogenicity of chemicals: mechanisms of action and early recognition through a new set of structural alerts. Chem. Rev. 2013;113:2940–2957. doi: 10.1021/cr300206t. [DOI] [PubMed] [Google Scholar]
- 29.Golbamaki A, et al. New clues on carcinogenicity-related substructures derived from mining two large datasets of chemical compounds. J. Environ. Sci. Health C Environ. Carcinog. Ecotoxicol. Rev. 2016;34:97–113. doi: 10.1080/10590501.2016.1166879. [DOI] [PubMed] [Google Scholar]
- 30.Dearden JC. The History and Development of Quantitative Structure-Activity Relationships (QSARs) Int. J. Quanti. Struct. Property Relat. (IJQSPR) 2016;1:1–44. doi: 10.4018/IJQSPR.2016010101. [DOI] [Google Scholar]
- 31.Benigni R, Bossa C, Tcheremenskaia O, Giuliani A. Alternatives to the carcinogenicity bioassay: in silico methods, and the in vitro and in vivo mutagenicity assays. Expert Opin. Drug Met. Toxicol. 2010;6:809–819. doi: 10.1517/17425255.2010.486400. [DOI] [PubMed] [Google Scholar]
- 32.Cereto-Massagué A, et al. Molecular fingerprint similarity search in virtual screening. Methods. 2015;71:58–63. doi: 10.1016/j.ymeth.2014.08.005. [DOI] [PubMed] [Google Scholar]
- 33.Xue L, Godden JW, Stahura FL, Bajorath J. Profile scaling increases the similarity search performance of molecular fingerprints containing numerical descriptors and structural keys. J. Chem. Inf. Comput. Sci. 2003;43:1218–1225. doi: 10.1021/ci030287u. [DOI] [PubMed] [Google Scholar]
- 34.Liew CY, Lim YC, Yap CW. Mixed learning algorithms and features ensemble in hepatotoxicity prediction. J. Comput. Aided Mol. Des. 2011;25:855–871. doi: 10.1007/s10822-011-9468-3. [DOI] [PubMed] [Google Scholar]
- 35.Qiu WR, Xiao X, Xu ZC, Chou KC. iPhos-PseEn: identifying phosphorylation sites in proteins by fusing different pseudo components into an ensemble classifier. Oncotarget. 2016;7:51270–51283. doi: 10.18632/oncotarget.9987. [DOI] [PMC free article] [PubMed] [Google Scholar]
- 36.Chen X, et al. Drug-target interaction prediction: databases, web servers and computational models. Brief. Bioinform. 2016;17:696–712. doi: 10.1093/bib/bbv066. [DOI] [PubMed] [Google Scholar]
- 37.Chen X, et al. NLLSS: predicting synergistic drug combinations based on semi-supervised learning. PLoS. Comput. Biol. 2016;12:e1004975. doi: 10.1371/journal.pcbi.1004975. [DOI] [PMC free article] [PubMed] [Google Scholar]
- 38.Chen, X., Yan, C. C., Zhang, X. & You, Z. Long non-coding RNAs and complex diseases: from experimental results to computational models. Brief. Bioinform, doi:10.1093/bib/bbw060 (2016). [DOI] [PMC free article] [PubMed]
- 39.Chen, X., Huang, Y., You, Z., Yan, G. & Wang, X. A novel approach based on KATZ measure to predict associations of human microbiota with non-infectious diseases. Bioinformatics, doi:10.1093/bioinformatics/btw715 (2016).
- 40.Chen X, You Z, Yan G, Gong D. IRWRLDA: improved random walk with restart for lncRNA-disease association prediction. Oncotarget. 2016;7:57919–57931. doi: 10.18632/oncotarget.11141. [DOI] [PMC free article] [PubMed] [Google Scholar]
- 41.Chen X, et al. HGIMDA: heterogeneous graph inference for miRNA-disease association prediction. Oncotarget. 2016;7:65257–65269. doi: 10.18632/oncotarget.11251. [DOI] [PMC free article] [PubMed] [Google Scholar]
- 42.Mario Negri Institute for Pharmacological Research (IRFMN). VEGA, Virtual models for evaluating the properties of chemicals within a global architecture, http://www.vega-qsar.eu/download.html (2016).
- 43.Cheng F, et al. admetSAR: a comprehensive source and free tool for assessment of chemical ADMET properties. J. Chem. Inf. Model. 2012;52:3099–3105. doi: 10.1021/ci300367a. [DOI] [PubMed] [Google Scholar]
- 44.Kang, Y. M. PreADMET Ver 2.0, https://preadmet.bmdrc.kr (2016).
- 45.IdeaConsult L. Toxtree - Toxic Hazard Estimation by decision tree approach, http://toxtree.sourceforge.net/ (2016).
- 46.Maunz A, et al. Lazar: a modular predictive toxicology framework. Front. Pharmacol. 2013;4:38. doi: 10.3389/fphar.2013.00038. [DOI] [PMC free article] [PubMed] [Google Scholar]
- 47.Friedman GD, Udaltsova N, Chan J, Quesenberry CP, Jr., Habel LA. Screening pharmaceuticals for possible carcinogenic effects: initial positive results for drugs not previously screened. Cancer Causes Control. 2009;20:1821–1835. doi: 10.1007/s10552-009-9375-2. [DOI] [PMC free article] [PubMed] [Google Scholar]
- 48.Wishart DS, et al. DrugBank: a comprehensive resource for in silico drug discovery and exploration. Nucleic Acids Res. 2006;34:D668–D672. doi: 10.1093/nar/gkj067. [DOI] [PMC free article] [PubMed] [Google Scholar]
- 49.Ashby J, Vogel E, Tinwell H, Callander R, Shuker D. Mutagenicity to Salmonella, Drosophila and the mouse bone marrow of the human antineoplastic agent fotemustine: prediction of carcinogenic potency. Mutat. Res. Fundam. Mol. Mech. Mutagen. 1993;286:101–109. doi: 10.1016/0027-5107(93)90005-Z. [DOI] [PubMed] [Google Scholar]
- 50.McCann J, Choi E, Yamasaki E, Ames BN. Detection of carcinogens as mutagens in the Salmonella/microsome test: assay of 300 chemicals. Proc. Natl. Acad. Sci. USA. 1975;72:5135–5139. doi: 10.1073/pnas.72.12.5135. [DOI] [PMC free article] [PubMed] [Google Scholar]
- 51.Fujikawa K, Fort FL, Samejima K, Sakamoto Y. Genotoxic potency in Drosophila melanogaster of selected aromatic amines and polycyclic aromatic hydrocarbons as assayed in the DNA repair test. Mutat. Res. Fundam. Mol. Mech. Mutagen. 1993;290:175–182. doi: 10.1016/0027-5107(93)90157-B. [DOI] [PubMed] [Google Scholar]
- 52.Brambilla G, Mattioli F, Robbiano L, Martelli A. Update of carcinogenicity studies in animals and humans of 535 marketed pharmaceuticals. Mutat. Res. Rev. Mutat. Res. 2012;750:1–51. doi: 10.1016/j.mrrev.2011.09.002. [DOI] [PubMed] [Google Scholar]
- 53.Gold LS, Manley NB, Slone TH, Rohrbach L, Garfinkel GB. Supplement to the Carcinogenic Potency Database (CPDB): results of animal bioassays published in the general literature through 1997 and by the National Toxicology Program in 1997–1998. Toxicol. Sci. 2005;85:747–808. doi: 10.1093/toxsci/kfi161. [DOI] [PubMed] [Google Scholar]
- 54.Huff J. Long-Term Chemical Carcinogenesis Bioassays Predict Human Cancer Hazards: Issues, Controversies, and Uncertainties. Ann. NY. Acad. Sci. 1999;895:56–79. doi: 10.1111/j.1749-6632.1999.tb08077.x. [DOI] [PubMed] [Google Scholar]
- 55.Fung VA, Barrett JC, Huff J. The carcinogenesis bioassay in perspective: application in identifying human cancer hazards. Environ. Health Persp. 1995;103:680–683. doi: 10.1289/ehp.95103680. [DOI] [PMC free article] [PubMed] [Google Scholar]
- 56.Benigni R, Bossa C, Richard AM, Yang C. A novel approach: chemical relational databases, and the role of the ISSCAN database on assessing chemical carcinogenicity. Ann. I. Super. Sanita. 2007;44:48–56. [PubMed] [Google Scholar]
- 57.Yap CW. PaDEL-descriptor: An open source software to calculate molecular descriptors and fingerprints. J. Comput. Chem. 2011;32:1466–1474. doi: 10.1002/jcc.21707. [DOI] [PubMed] [Google Scholar]
- 58.Kuhn M. Building Predictive Models in R Using the caret Package. J. Stat. Softw. 2008;28:1–26. doi: 10.18637/jss.v028.i05. [DOI] [Google Scholar]
- 59.Karatzoglou A, Smola A, Hornik K, Zeileis A. kernlab - an S4 package for kernel methods in R. J. Stat. Softw. 2004;11:1–20. doi: 10.18637/jss.v011.i09. [DOI] [Google Scholar]
- 60.Liaw A, Wiener M. Classification and regression by randomForest. R News. 2002;2:18–22. [Google Scholar]
- 61.Chen, T. & Guestrin, C. XGBoost: A Scalable Tree Boosting System. Proceedings of the 22nd ACM SIGKDD International Conference on Knowledge Discovery and Data Mining. 785–794 (ACM, San Francisco, California, USA 2016).
- 62.Bergstra J, Bengio Y. Random search for hyper-parameter optimization. J. Mach. Learn. Res. 2012;13:281–305. [Google Scholar]
- 63.Sheridan RP, Wang WM, Liaw A, Ma J, Gifford E. Extreme Gradient Boosting as a Method for Quantitative Structure-Activity Relationships. J. Chem. Inf. Model. 2016;56:2353–2360. doi: 10.1021/acs.jcim.6b00591. [DOI] [PubMed] [Google Scholar]
Associated Data
This section collects any data citations, data availability statements, or supplementary materials included in this article.