

Abstract
Dendrobium is one of the largest genera in Orchidaceae, comprising about 800–1500 species mainly distributed in tropical Asia, Australasia, and Australia. There are 74 species and two varieties of this genus in China. Because of their ornamental and commercial value, Dendrobium orchids have been studied at low taxonomic levels. However, structural changes and effective mutational hotspots of Dendrobium plastomes have rarely been documented. Here, 30 Dendrobium plastomes were compared, comprising 25 newly sequenced in this study and five previously published. Except for their differences in NDH genes, these plastomes shared identical gene content and order. Comparative analyses revealed that the variation in size of Dendroubium plastomes was associated with dramatically changed length of InDels. Furthermore, ten loci were identified as the top-ten mutational hotspots, whose sequence variability was almost unchanged with more than 10 plastomes sampled, suggesting that they may be powerful markers for Dendrobium species. In addition, primer pairs of 47 polymorphic microsatellites were developed. After assessing the mean BS values of all combinations derived from the top-ten hotspots, we recommend that the combination of five hotspots—trnT-trnL, rpl32-trnL, clpP-psbB, trnL intron, and rps16-trnQ—should be used in the phylogenetic and identification studies of Dendrobium.
Introduction
Dendrobium, a genus of the tribe Dendrobieae (Orchidaceae: Epidendroideae), is one of the largest genera in Orchidaceae with approximately 800–1500 species mainly distributed in tropical Asia, Australasia, and Australia1, 2. There are 74 species and two varieties of this genus in China3, some of which are well known as flowers of Father’s Day in many Asian countries. Dendrobium orchids are popular not only for their aesthetic appeal, primarily reflected in their unique flower characteristics, but also for their medicinal value. Owing to their strong health care effects, such as nourishing the kidney, benefiting the stomach, enhancing the body’s immunity, resisting cancer, and prolonging life, many species in this genus have been extensively used as Traditional Chinese Medicine (TCM) for hundreds of years4. However, many wild Dendrobium species are in extreme danger of extinction (IUCN Redlist of higher plants in China, http://www.zhb.gov.cn/gkml/hbb/bgg/201309/t20130912_260061.htm) due to their low germination rate, slow growing, habitat deterioration, and being over-exploited.
Because of their ornamental and commercial value, Dendrobium orchids have attracted intense attention of reseachers, leading to numerous taxonomic studies published, particularly in species identification3, 5, 6. However, Dendrobium species are notoriously difficult to identify. Traditional methods for identifying Dendrobium species are based on their morphological characteristics, while many species have overlapping morphological variations due to environmental factors and pollinator selection pressure2, 7, 8. Furthermore, after intensively processed, the shoots of Dendrobium species become more difficult to distinguish9. Therefore, it is urgent to develop a simple and accurate method for identification of Dendrobium species.
Recently, a variety of molecular markers have been developed for the studies of Dendrobium in terms of species identification, population genetics, and phylogeny. Microsatellite (SSR) markers have been employed to study population genetics of Dendrobium species and to investigate the species relationships10, 11. Random amplified polymorphic DNA (RAPD) and amplified fragment length polymorphism (AFLP) markers are also available for Dendrobium 12, 13. In addition, DNA barcode has been adopted to identify Dendrobium species, involving different loci or their combinations, e.g. ITS14, 15, ITS25, ITS + matK 6, and rbcL + matK 16. However, many of these studies resulted in inconsistent conclusions because of using limited number of DNA sequences.
The chloroplast is one of the essential organelles in plant cells, having its own genome called plastome. Plastomes are an ideal resource for selecting mutational hotspots in various lineages because of their maternal mode of inheritance, dense gene content, and slower evolutionary rates relative to those of nuclear and mitochondrial genomes17, 18. A number of hotspots, including rbcL, matK, and psbA-trnH, have been successfully applied to plant species identification and phylogenetic studies19–21. Recently, the comparative plastomic method has been available for mutational hotspot selection, which uses at least two complete plastomes within the study genus to screen for the most informative regions22, 23. For instance, the psbA-trnH and trnF-ndhJ regions in orchids were demonstrated to be the most useful markers for the phylogenetic analysis of Oncidium 24; and the noncoding loci rpl32-trnL, trnE-trnT, trnH-psbA, trnK-rps16, and trnT-trnL were shown to be effective in identifying species of Cymbidium 25. However, comprehensive plastome-wide investigation has not been conducted on more powerful loci, which, however, are important for low taxonomic level studies of Dendrobium species.
In this investigation, we compared 30 plastomes of important Dendrobium species that contents great medical worth, including the 25 newly sequenced. Our aims were: (1) to evaluate the evolution of Dendrobium plastomes; (2) to identify more powerful mutational hotspots for low taxonomic level studies of Dendrobium species on the basis of a wide range of sampling. To achieve these aims, the Maximum likelihood (ML) approach was adopted to evaluate potential hotspot combinations by assessing their mean bootstrap (BS) values.
Result
Genome features
The 25 newly sequenced Dendrobium plastomes ranged from 150,073 to 152,108 bp in length, with the smallest one belonging to D. parciflorum while the largest falling into D. fanjingshanense (Table 1). All plastomes possessed the ancestral angiosperm plastome organization that consisted of a LSC region of 84,273–84,990 bp, a SSC region of 13,821–14,514 bp, and a pair of IR regions of 26,175–26,309 bp each (Table 1, Figure S1a). Similar to other orchid plastomes, Dendrobium plastomes were also AT-rich (62.27–62.69%). Except for their differences in the total length and composition of retained NDH genes, all plastomes shared identical complements of coding genes, each containing 30 unique tRNA genes, four unique rRNA genes, and 68 unique protein-coding genes. The sequence of eleven NDH genes of Dendrobium species were compared to Cypripedium formosanum (NC_026772), which contains full set of functional NDH genes in orchids (Figure S1b). However, like other Epidendroideae species (e.g. Cymbidium, Oncidium, and Phalaenopsis), Dendrobium also experienced the loss of plastid NDH genes. Among them, only ndhB genes in IR regions were functional with full reading frames, whereas other ten plastid NDH genes were truncated or completely lost.
Table 1.
Characteristics of the 25 newly sequenced Dendrobium plastomes.
| Species Name | Plastome length (bp) | LSC region (bp) | SSC region (bp) | IR region (bp) | AT content (%) | Accession | No. vouchers specimen |
|---|---|---|---|---|---|---|---|
| Dendrobium aphyllum | 151524 | 84588 | 14320 | 26308 | 62.40% | LC192953 | NZT2015001 |
| Dendrobium brymerianum | 151830 | 84855 | 14377 | 26299 | 62.40% | LC192954 | NZT2015002 |
| Dendrobium chrysanthum | 151790 | 84757 | 14441 | 26296 | 62.44% | LC193514 | NZT2015003 |
| Dendrobium chrysotoxum | 151731 | 84785 | 14356 | 26295 | 62.37% | LC193517 | NZT2015004 |
| Dendrobium crepidatum | 151717 | 84811 | 14383 | 26262 | 62.43% | LC193509 | NZT2015005 |
| Dendrobium denneanum | 151565 | 84657 | 14344 | 26282 | 62.37% | LC192955 | NZT2015006 |
| Dendrobium devonianum | 151945 | 84966 | 14435 | 26272 | 62.45% | LC192956 | NZT2015007 |
| Dendrobium ellipsophyllum | 152026 | 84930 | 14488 | 26304 | 62.50% | LC193519 | NZT2015008 |
| Dendrobium exile | 151294 | 84363 | 14315 | 26308 | 62.32% | LC193522 | NZT2015009 |
| Dendrobium falconeri | 151890 | 84862 | 14448 | 26290 | 62.51% | LC192957 | NZT2015010 |
| Dendrobium fanjingshanense | 152108 | 84990 | 14514 | 26302 | 62.49% | LC193523 | NZT2015011 |
| Dendrobium fimbriatum | 151673 | 84763 | 14328 | 26291 | 62.40% | LC193521 | NZT2015012 |
| Dendrobium gratiosissimum | 151829 | 84890 | 14359 | 26290 | 62.43% | LC192958 | NZT2015013 |
| Dendrobium henryi | 151850 | 84878 | 14366 | 26303 | 62.44% | LC193513 | NZT2015014 |
| Dendrobium hercoglossum | 151939 | 84924 | 14397 | 26309 | 62.44% | LC192959 | NZT2015015 |
| Dendrobium jenkinsii | 151717 | 84734 | 14413 | 26285 | 62.40% | LC193515 | NZT2015016 |
| Dendrobium lohohense | 151812 | 84876 | 14352 | 26292 | 62.44% | LC193516 | NZT2015017 |
| Dendrobium parciflorum | 150073 | 83708 | 13821 | 26272 | 62.33% | LC193512 | NZT2015018 |
| Dendrobium parishii | 151689 | 84703 | 14396 | 26295 | 62.42% | LC193518 | NZT2015019 |
| Dendrobium primulinum | 150767 | 84442 | 13975 | 26175 | 62.27% | LC192810 | NZT2015020 |
| Dendrobium salaccense | 151104 | 84273 | 14315 | 26258 | 62.69% | LC193510 | NZT2015021 |
| Dendrobium spatella | 151829 | 84794 | 14419 | 26308 | 62.42% | LC193511 | NZT2015022 |
| Dendrobium wardianum | 151788 | 84835 | 14359 | 26297 | 62.43% | LC192961 | NZT2015023 |
| Dendrobium wilsonii | 152080 | 84988 | 14480 | 26306 | 62.49% | LC193508 | NZT2015024 |
| Dendrobium xichouense | 152052 | 84980 | 14486 | 26293 | 62.49% | LC193520 | NZT2015025 |
InDels coincide with the variation of plastome
Thirty plastomes of Dendrobium, including our newly sequenced 25, were complied for comparison. These plastomes experienced different degrees of NDH gene loss, in which the total length of retained NDH genes varied from 3,687–6,336 bp (Table S1). On the other side, the total length of retained NDH genes was uncorrelated with the plastome length (Spearman’s r = 0.163, P > 0.05). In addition, the changed lengths of LSC, SSC, IRs, and whole plastome were compared between each tested species and D. officinale. Our analysis indicated that the changed length of LSC, which retains only a few ndh residues, was strongly correlated with the changed length of plastome (Spearman’s r = 0.908, P < 0.01). Meanwhile, the changed lengths of SSC (retaining most of the NDH genes) and IRs (its expansion/contraction having a direct impact on plastome size) were medially correlated with the changed length of Dendrobium plastome (Spearman’s r = 0.634, 0. 721, P < 0.05). These results suggested that the changed length of LSC occupied an important position in the changes of plastome sizes.
InDel mutations in plastome were compared between each tested Dendrobium species and D. officinale (Fig. 1). As a result, a total of 123–352 InDels were identified among these plastomes, with 84–274 in LSC, 18–69 in SSC, and 10–47 in IRs. The InDels located in LSC region accounted for 65–82%; this proportion was significantly greater than those for the InDels situated in SSC and IRs (Mann-Whitney 2-sides, P < 0.05), indicating that the locations of InDels in plastome were nonrandom. In order to evaluate the relationship between the variation of Dendrobium plastome size and InDel changes, we determined the changed length of InDels based on the differences between insertions and deletions and divided them into two parts: NDH gene-related InDels change and NDH gene-unrelated InDels change (Table S2). The changed length of NDH gene-unrelated InDels was significantly larger than that of NDH gene-related InDels, which was caused by the loss of NDH genes (Mann-Whitney 2-sides, P < 0.05). Moreover, the changed length of NDH gene-unrelated InDels was strongly correlated with the variation of plastome size (Spearman’s r = 0.867, P < 0.01), suggesting that the variation of Dendrobium plastome size was largely due to the changed length of InDels.
Figure 1.
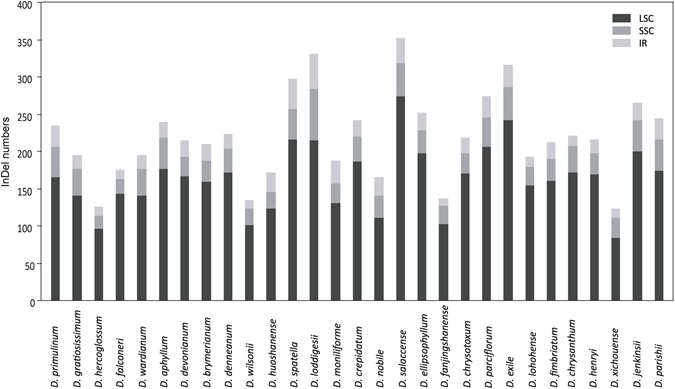
InDel distribution among different Dendrobium plastomes. The InDel mutations were determined based on the comparison between plastoms of each tested Dendrobium species and D. officinale. Histograms with different colors indicate the numbers of InDels in LSC, SSC, and IR regions.
Mutational hotspots in Dendrobium plastomes
We identified 92 syntenic intergenic and intronic loci, each longer than 150 bp. Three of them (matK, rbcL and psbA-trnH) had been widely used as DNA barcode owing to their high variability. Sequence variability (SV) was calculated for each of these loci (Fig. 2 and Table S3). It has been reported that plastomic mutational hotspots are accompanied by biased AT compositions. Consistently, our study showed that the SV of a locus was negatively correlated with its GC content (Spearman’s r = −0.809, P < 0.01).
Figure 2.
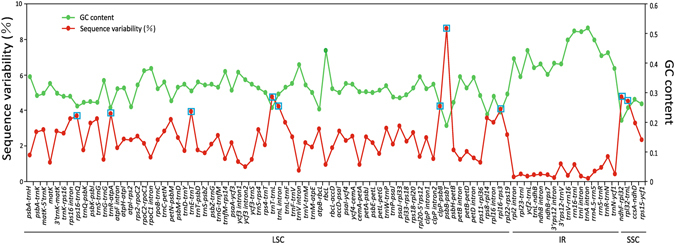
The sequence variability (%) and GC content among the 92 syntenic intergenic and intronic loci from Dendrobium plastomes. The red and green lines represent the sequence variability (%) and GC content of each locus, respectively. These syntenic loci are oriented according to their locations in the plastome. The top-ten syntenic intergenic and intronic loci with the highest sequence variability (%) in the tested Dendrobium plastomes were indicated with blue box.
Figure 3 shows the SV of the top-ten mutational hotspots from the 25 newly sequenced plastomes. All of these hotspots except trnL intron were intergenic spacers. To examine whether the SV of these hotspots changes with increasing number of sampled plastomes, we evaluated their SV rankings among six groups that were randomly composed of different numbers of Dendrobium plastomes (Table 2). Only five to six of these mutational spots ranked in the top ten hotspots when sampled plastomes were fewer than ten. However, when more than ten plastomes were sampled, these mutational spots consistently ranked in the top ten.These results indicated that the consistency of the SV of these mutational spots rose with increasing number of sampled plastomes. Therefore, the top ten hotspots (Fig. 2) could be powerful markers for phylogenetic and identification studies of Dendrobium species.
Figure 3.
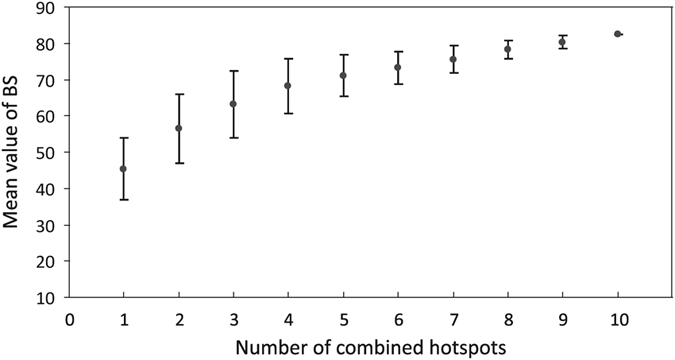
Relation between the number of combined hotspots and the mean value of bootstrap (BS). The mean (±SD) BS values were calculated based on different numbers of combined hotspots. Regression analysis: R2 = 0.904, y = 3.64x + 49.38. The plateau of the mean BS value reached 71% when five hotspots were combined.
Table 2.
SV rankings of the top-ten mutational hotspots in six groups.
| Group A (2 species) | Group B (5 species) | Group C (10 species) | Group D (15 species) | Group E (20 species) | Group F (25 species) | |
|---|---|---|---|---|---|---|
| psbB-psbT | 1 | 1 | 1 | 1 | 1 | 1 |
| ndhF-rpl32 | — | 3 | 3 | 2 | 2 | 2 |
| trnT-trnL | 3 | 2 | 2 | 3 | 3 | 3 |
| rpl32-trnL | — | — | 6 | 4 | 4 | 4 |
| clpP-psbB | — | — | — | 6 | 5 | 5 |
| trnL intron | 4 | 4 | 4 | 5 | 6 | 6 |
| rpl16-rps3 | — | — | 5 | 7 | 7 | 7 |
| trnE-trnT | 9 | — | 7 | 9 | 8 | 8 |
| trnR-atpA | 6 | — | — | — | 9 | 9 |
| rps16-trnQ | 7 | 9 | 9 | 10 | 10 | 10 |
“—” Means this locus ranked outside of the top-ten mutational hotspots.
Group A: D. primulinum, D. gratiosissimum.
Group B: D. primulinum, D. gratiosissimum, D. hercoglossum, D. falconeri, D. wardianum.
Group C: D. primulinum, D. gratiosissimum, D. hercoglossum, D. falconeri, D. wardianum, D. aphyllum, D. devonianum, D. brymerianum, D. denneanum, D. wilsonii.
Group D: D. primulinum, D. gratiosissimum, D. hercoglossum, D. falconeri, D. wardianum, D. aphyllum, D. devonianum, D. brymerianum, D. denneanum, D. wilsonii D. spatella, D. crepidatum, D. salaccense, D. ellipsophyllum, D. fanjingshanense.
Group E: D. primulinum, D. gratiosissimum, D. hercoglossum, D. falconeri, D. wardianum, D. aphyllum, D. devonianum, D. brymerianum, D. denneanum, D. wilsonii D. spatella, D. crepidatum, D. salaccense, D. ellipsophyllum, D. fanjingshanense, D. chrysotoxum, D. parciflorum, D. exile, D. lohohense, D. fimbriatum.
Group F: D. primulinum, D. gratiosissimum, D. hercoglossum, D. falconeri, D. wardianum, D. aphyllum, D. devonianum, D. brymerianum, D. denneanum, D. wilsonii D. spatella, D. crepidatum, D. salaccense, D. ellipsophyllum, D. fanjingshanense, D. chrysotoxum, D. parciflorum, D. exile, D. lohohense, D. fimbriatum, D. chrysanthum, D. henryi, D. xichouense, D. jenkinsii, D. parishii.
Microsatellites
We totally retrieved 47 polymorphic SSRs, which are present in at least 15 species, from 92 syntenic intergenic and intronic loci (Table 3). These SSRs consisted of two types: mononucleotide SSRs (44 A/T type and one C/G type), ranging from 8 to 16 nucleotide repetitions; and dinucleotide SSRs (TA)6. Six of them (trnT-trnL, trnL intron, trnE-trnT, trnR-atpA, and rps16-trnQ) were among the top ten hotspots. The SSRs were mainly distributed in LSC, while only one was located in SSC and three in IRs. This signified that the distribution of SSRs was dependent on their locations in plastomes. Our result also revealed that 37 SSRs were located in intergenic spacer regions and 10 SSRs in introns. Primer pairs were developed for all the SSRs (Table 3), which could be used in the amplification of SSRs in Dendrobium species for future studies.
Table 3.
Polymorphic SSRs identified in the comparative analysis of Dendrobium plastomes.
| NO. | Primer name | Position | Region | Location | SSR Type | Primer sequence (5′-3′) | Length | Tm |
|---|---|---|---|---|---|---|---|---|
| 1 | Den ptssr1 | trnT-trnL | LSC | spacer | AT × 6 | AGAAATTCAATTCCATATTCA | 232 | 51 |
| CATTGATGTATCCGCAATAT | ||||||||
| 2 | Den ptssr2 | trnT-trnL | LSC | spacer | AT × 6 | CTAAATAGAAATTCAATTCCT | 185 | 53 |
| CCTTTACCCCTCCTTCCTAA | ||||||||
| 3 | Den ptssr3 | trnL intron | LSC | intron | T × (8–14) | TGGATTGAGCCTTGGTATA | 231 | 50 |
| TCCTTTCTGTCATTTCGATT | ||||||||
| 4 | Den ptssr4 | trnE-trnT | LSC | spacer | A × (8–10) | AATATGAATCTTACCCACTTCC | 180 | 52 |
| TGAACCGATGACTTACGCAA | ||||||||
| 5 | Den ptssr5 | trnR-atpA | LSC | spacer | A × 9 | TTGGACGCATTTATTTCTAC | 250 | 52 |
| CGAAGAAGCTGAAACCCTT | ||||||||
| 6 | Den ptssr6 | rps16-trnQ | LSC | spacer | A × (8–13) | AAAGTCTCGTGTAAGGTAT | 225 | 53 |
| ATGTTGGATACACTGAATA | ||||||||
| 7 | Den ptssr7 | rps16 intron | LSC | intron | T × (8–11) | CTCTTTCTATCATCCTTCCAT | 225 | 51 |
| CCCACTATAAACTTAGTAACTAT | ||||||||
| 8 | Den ptssr8 | petN-psbM | LSC | spacer | A × (8–10) | TTCACTTGTAGTATGGGGAAG | 232 | 50 |
| GAGGATTAAATAGAAGAATCT | ||||||||
| 9 | Den ptssr9 | trnL-trnF | LSC | spacer | T × (8–15) | TTCCTCGCTCTTTATTTATCC | 209 | 54 |
| CAATAACGGAGATTCCTTGAA | ||||||||
| 10 | Den ptssr10 | rps8-rpl14 | LSC | spacer | T × (8–11) | TAGTTATTGGTGTCTCCTCAT | 160 | 51 |
| TATCTGAAATAGATCCGATTA | ||||||||
| 11 | Den ptssr11 | psbK-psbI | LSC | spacer | A × (8–10) | AAGGAAATCTCGATTCAATTC | 241 | 53 |
| AAAGGAAAGGTCAGAACAAAA | ||||||||
| 12 | Den ptssr12 | psbK-psbI | LSC | spacer | A × (8–10) | CTTTAATCAGCTAATCAACTT | 225 | 50 |
| CTATTTGATATGAAGCTCTAA | ||||||||
| 13 | Den ptssr13 | psbK-psbI | LSC | spacer | A × (8–10) | AGATATGGATATGGCAAGAAA | 217 | 52 |
| TACAAATCTCCAAGATAAGAT | ||||||||
| 14 | Den ptssr14 | ccsA-ndhD | SSC | spacer | T × (8–11) | AAATCGTCTGATACGCAATGC | 174 | 56 |
| TTGACTTTCATATTTTCACGA | ||||||||
| 15 | Den ptssr15 | rps16 intron | LSC | intron | T × (8–11) | AACTCAAGTTGGGTAGTTTTG | 224 | 51 |
| TAAGGATCACCGAAGTAATGT | ||||||||
| 16 | Den ptssr16 | psbA-trnK | LSC | spacer | T × (8–14) | CTATGCCAATGTCAACCAATC | 246 | 55 |
| CTTTCTTTAATCTTCCTCCAA | ||||||||
| 17 | Den ptssr17 | matK-5′trnK | LSC | intron | A × (8–10) | AATCACTCTTTTGACTTTGGAA | 214 | 54 |
| AATTTGAATGATTACCCGTAC | ||||||||
| 18 | Den ptssr18 | matK-5′trnK | LSC | intron | A × (8–10) | CTTACTCGAATTGGAGCCATA | 216 | 55 |
| CCGCGACTGATCCTGAAAGGT | ||||||||
| 19 | Den ptssr19 | atpB-rbcL | LSC | spacer | T × (8–14) | ATAGCAAGTTGATCGGTTAAT | 224 | 51 |
| CTAGATGTGAAAAGAGGCATA | ||||||||
| 20 | Den ptssr20 | atpB-rbcL | LSC | spacer | T × (8–14) | TTCTATCTTTATCTTTACTTTCG | 262 | 50 |
| GAGTATGAAGAATAATGAATATGA | ||||||||
| 21 | Den ptssr21 | atpB-rbcL | LSC | spacer | T × (8–14) | CTATCTTTATCTTTACTTTCG | 255 | 50 |
| GAAGAATAATGAATATGATAGA | ||||||||
| 22 | Den ptssr22 | trnC-petN | LSC | spacer | A × (8–12) | ATCCTGTTGATCGAACTTGAC | 216 | 54 |
| CAATTCAGAATAGCCCAAACC | ||||||||
| 23 | Den ptssr23 | trnC-petN | LSC | spacer | A × (8–12) | ACTGATTTGTATCCAGACTCA | 218 | 50 |
| TCTTACTTACGGCTCTTTATG | ||||||||
| 24 | Den ptssr24 | trnC-petN | LSC | spacer | A × (8–12) | ACTAGAGGCTCTGAGTGCTGC | 235 | 55 |
| TCATAGTGGAATGAATGGTGC | ||||||||
| 25 | Den ptssr25 | rps18-rpl20 | LSC | spacer | A × 8 | AAACTCCAATAGGAAATCAAG | 213 | 52 |
| ACAAGAATGATTGAAACAGGA | ||||||||
| 26 | Den ptssr26 | petA-psbJ | LSC | spacer | T × (8–14) | AATAAAGTTGGTAAAAGTGCC | 189 | 51 |
| TCCTTTGTATTTGTATGCTTC | ||||||||
| 27 | Den ptssr27 | ycf4-cemA | LSC | spacer | T × (8–14) | AGGAAGAAAAGAAGAGGAAATC | 217 | 54 |
| CCTATAACTCTAACAAGAACAA | ||||||||
| 28 | Den ptssr28 | rps2-rpoC2 | LSC | spacer | T × (9–13) | CCATTTATTAGTACCATGACCA | 207 | 55 |
| CTAATACCTAAAGCATTAGTTA | ||||||||
| 29 | Den ptssr29 | trnF-trnV | LSC | spacer | A × (8–9) | ATTGAGACGGATCGGGATAGA | 229 | 56 |
| GCAAAATGATAAGAATCGGAG | ||||||||
| 30 | Den ptssr30 | atpI-rps2 | LSC | spacer | A × (8–10) | ATTATTTTGATTCAACCATCTC | 189 | 51 |
| GATTGTTACTCTTTTGGTTTG | ||||||||
| 31 | Den ptssr31 | psbZ-trnG | LSC | spacer | A × (8–10) | CCGATCCAAATAATCCTTCTA | 264 | 54 |
| TTTTCTTCGTTCCTGATACGT | ||||||||
| 32 | Den ptssr32 | psaA-ycf3 | LSC | spacer | A × (8–11) | ATGAGATACCGTAGAAAATGT | 240 | 51 |
| CTGCTGAGTATTGGAAACAAG | ||||||||
| 33 | Den ptssr33 | psbE-petL | LSC | spacer | T × (8–13) | GCTCCACAAATTCTTGTATGT | 203 | 53 |
| AATTTCCTTTCGGTAATGATC | ||||||||
| 34 | Den ptssr34 | psbE-petL | LSC | spacer | T × (8–13) | ATTAGTGGCTTCATCATAGTAAT | 244 | 50 |
| CAAAGTGAAATAGTGTATTAGCAT | ||||||||
| 35 | Den ptssr35 | psbE-petL | LSC | spacer | T × (8–13) | ACTTTGAAATTAGAAACTGAAGCTA | 232 | 54 |
| ACAACAGTTGCATCACGAATA | ||||||||
| 36 | Den ptssr36 | psbE-petL | LSC | spacer | T × (8–13) | TTCTTTTGAATCGAGTTGGTCC | 207 | 56 |
| TTTCAATCCAGATACGACGGT | ||||||||
| 37 | Den ptssr37 | trnF-ndhJ | LSC | spacer | A × (8–9) | TTCATTGAGACGGATCGGGATA | 231 | 55 |
| CAAAATGATAAGAATCGGAGTT | ||||||||
| 38 | Den ptssr38 | trnD-trnY | LSC | spacer | T × (8–10) | TTTCAGAAGAGCATTCTATTT | 249 | 50 |
| CTCCATGAAGAAGATCTAAAG | ||||||||
| 39 | Den ptssr39 | trnS-psbZ | LSC | spacer | A × (8–10) | GCTATCAACCACTCAGCCATC | 247 | 55 |
| TCCTCCAAACTACCAACAAAT | ||||||||
| 40 | Den ptssr40 | rpoC1 intron | LSC | intron | T × (8–15) | CTACTCTTTACTCAAGTTCCCAA | 202 | 55 |
| AAATCCTTTACGAGTCCCACA | ||||||||
| 41 | Den ptssr41 | petB intron | LSC | intron | A × (8–11) | AACCTTTGAGTTTAGCTTTGG | 185 | 53 |
| TACAATCTCAAGTTGGCTCAT | ||||||||
| 42 | Den ptssr42 | clpP intron2 | LSC | intron | A × (8–11) | GTTTGTGACGCTGAAATTGAC | 200 | 55 |
| TACTATGCCTTCGCTGTATCG | ||||||||
| 43 | Den ptssr43 | clpP intron2 | LSC | intron | A × (8–11) | TCAAATTGGGAATAACTCTTC | 228 | 51 |
| AATTACCAAACGTCTAGCATT | ||||||||
| 44 | Den ptssr44 | ycf3 intron1 | LSC | intron | A × (8–11) | ATAGATGTAACCTTTTGCTCA | 241 | 50 |
| AGGCATTTACCTATTACAGAG | ||||||||
| 45 | Den ptssr45 | 3′rps12-trnV | IR | spacer | T × (9–16) | CTTTGCCCCTCATTCTTCGAG | 236 | 56 |
| ATGGGTCAGATTCTACAGGATCAAC | ||||||||
| 46 | Den ptssr46 | 3′rps12-trnV | IR | spacer | T × (9–16) | AGTAGTTAATGGTGGGGTTAC | 248 | 52 |
| GCTCTATTCGAGACTGGTAGG | ||||||||
| 47 | Den ptssr47 | trnI intron | IR | intron | G × (8–10) | TTCTCCTCAGGAGGATAGATG | 223 | 53 |
| TCTGTGAAGATGCTGTGTTAG |
Multi-hotspot combination anaylsis
The top ten hotspots were retrieved from 30 Dendrobium plastomes, constituting 1,023 combinations (Table S4). To determine the optimal number of hotspots used for phylogenetic and identification studies of Dendrobium, we calculated the mean BS value of each ML tree based on these combinations. Correlation analyses indicated that the mean BS value was positively correlated to the SV and sequence length of hotspot combinations (Spearman’s r = 0.505, 0.6, P < 0.01). The mean BS values of ML trees climbed with increasing number of hotspots in a combination. On the other side, the variance among combinations declined with increasing number of hotspots in a combination; the greatest variations existed among the three combinations comprising one, two, and three hotspots (Fig. 3). The plateau of mean BS value reached 71% when five hotspots were combined, then rising slightly with further increasing number of hotspots in a combination. The top ten combinations that yielded highest BS values are shown in Table S5, of which only the fourth combination consisted of five hotspots (trnT-trnL, rpl32-trnL, clpP-psbB, trnL intron, and rps16-trnQ). Additionally, we also performed the phylogenetic analyses based on rbcL, matK, psbA-trnH and their combinations. Our results showed that the phylogenetic relationships based on the combination of trnT-trnL, rpl32-trnL, clpP-psbB, trnL intron, and rps16-trnQ had a better resolution than other plastid DNA data (Fig. 4).
Figure 4.
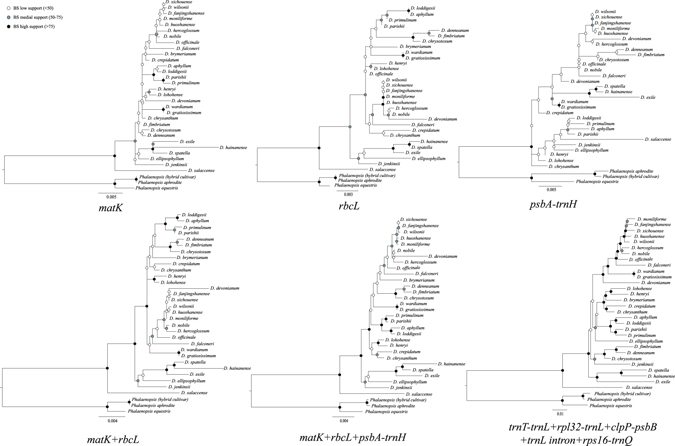
Maximum likelihood trees based on different plastid DNA data.
Discussion
In orchids, plastid NDH genes experienced independent loss26, 27. The dramatic NDH gene loss/retention has facilitated comparative plastome studies of orchid species24, 26–29. Recently, Kim et al.27 proposed that the loss of NDH genes led to the expansion/contraction of IRs27. It has been documented that independent loss/retention of NDH genes and expansion/contraction of IRs are largely responsible for the variation of plastomes in different orchid genera26, 27 and many other species, such as gnetophytes30–32, pines30, 33, slender naiad34, and saguaro35. However, our study demonstrated that neither NDH genes loss/retention nor the expansion/contraction of IRs accounted for the most important role in the variation of Dendrobium plastome sizes (Table S1).
Comparative analyses have shown that InDels commonly occur in plastomes. It is known that InDels are very useful for resolving phylogenetic relationship and can serve as biomarkers. For example, in the Pinaceae plastomes, nine InDels are able to resolve the phylogenetic relationships among different Pinaceae subfamilies36. In an investigation of the Fagopyrum plastomes, a number of InDel markers were identified and demonstrated to be effective in distinguishing raw or processed buckwheat products37. On the other side, few studies have given attention to the relationship between InDels and the variation of plastome size. In the present study, a strong correlation existed between the changed lengths of InDels and plastomes (Fig. 1, Table S2), demonstrating that the variation in size of Dendroubium plastomes was due to dramatical changes in lengths of InDels. However, the changed lengths of InDels is not secure to measure the phylogenetic relationship between the Dendrobium plastomes. In addition, according to Ahmed et al.38, the distribution of InDel events is dependent on their locations in plastomes38, e.g., associated with low GC content, high rate of nucleotide substitutions, or high frequency of SSRs; in line with this, the current research also revealed a nonrandom distribution of InDels (Fig. 1). Nevertheless, the dynamic distribution of the InDels in Dendrobium plastomes is worthy of further investigations.
Recently, the taxonomic study of Dendrobium has become a global concern of biological systematics and been regarded as one of the enormous challenges in Orchidaceae. Numerous studies have focused on searching the most appropriate DNA loci for low taxonomic level studies of Dendrobium species5, 6, 16. However, due to limited loci or taxes sampled, some conclusions made in these studies are inconsistent. The mutational hotspots from plastid genome are the most commonly used tool for low-level phylogeographic and phylogenetic studies of plants38–40. Although in many Dendrobium studies, they are supplemented with nrDNA ITS sequences, it is still difficult to obtain sufficient informative sites. Their unavailability makes it very challenging to resolve the phylogenetic relationships among several unplaced species (i.e., D. capillipes, D. trigonopus) and closely related species3, 41, and to identify these species. Moreover, the most variable loci in one lineage may not be phylogenetically informative in other lineages. For instance, the loci matK, rbcL 19, and psbA-trnH 20, 21 are highly variable in angiosperms and have been proposed for DNA barcoding, yet they only showed moderate sequence divergences among all syntenic loci of Dendrobium plastomes tested in this study (Fig. 2, Table S3). Therefore, it is necessary to make a cautious evaluation of specific genetic markers for Dendrobium species.
By comparing 92 syntenic intergenic and intronic loci from 25 Dendrobium plastomes, our analyses revealed that the top ten hotspots listed in Fig. 2 were the fastest evolving loci, which may be used for the phylogenetic study and identification of Dendrobium species. Among these top ten loci, four (psbB-psbT, rpl16-rps3, trnR-atpA, and trnL intron) are reported as mutational hotspots for the first time in this study. The other six loci have been documented in previous studies, of which four (ndhF-rpl32, rpl32-trnL, rps16-trnQ, and trnE-trnT) are located in three most variable plastome regions—ccsA to ndhF, matK to 3′ trnG, and rpoB to psbD 42—and the rest two (trnT-trnL and clpB-psbB) also have been considered hotspots for orchid species within Cymbidium and Phalaenopsis genera25, 42. This finding is in good agreement with the view proposed by Shaw et al.42 that although the top mutational hotspots are diversified in different lineages, some highly variable loci might remain unchanged in all angiosperm lineages.
Regarding 17 plastid introns, all except trnL-UAA intron belong to self-splicing group II introns31; none of them ranked in the top-ten mutational hotspots in our study. Compared to intergenic spacers, the group II introns had lower evolving rates, which could be explained by that their mutations may be constrained by their function in maintaining their secondary structural features, which are important for a proper splicing43–45. However, eight of these introns contain polymorphic SSRs (Table 3). Considering the functional importance of their secondary structural features, we surmise that the polymorphic SSRs might play a role in maintaining the secondary structures of group II introns.
The subject—“which hotspot and how many hotspots should be used”—has been debated for a long time46–49. Multiple solutions have been put forth in terms of the hotspot region and the number of hotspots in the combination, but no clear consensus result has yet emerged. For example, in Dendrobium, Singh et al.50 found that the DNA barcode based on three loci, matK, rpoB, and rpoC1 could indentify the maximum number of Dendrobium species50; Xu et al.6 recommended utilizing the combination of ITS + matK as a core DNA barcode6; and ITS, rbcL, matK, trnH-psbA, and trnL intron/trnL-trnF were used to resolve the phylogenetic relationship of Dendrobium in the studies of Xiang et al.3, 41. More recently, Shaw et al.42 concluded that at least four and up to eight of the most variable hotspots will likely access the majority of the low-level discriminating power of the plastome depending on the lineage of interest42. Based on the results of the current research, we recommend that the combination of five hotspots—trnT-trnL, rpl32-trnL, clpP-psbB, trnL intron, and rps16-trnQ—should be used in Dendrobium studies due to three reasons. Firstly, the phylogenetic tree based on this combination showed a strong discriminating ability (nearly all nodes BS value >75%) for Dendrobium species (Fig. 4). Secondly, five hotspots are necessary to capture the species resolution power of Dendrobium plastome. Empirical data analyses have revealed that greatly increasing the number of hotspots will not improve species-level discrimination because of a “performance plateau”49. This “performance plateau” was also observed in our study, as manifested by that the mean BS value only slightly increased with more than five hotspots combined. Thirdly, the combination of trnT-trnL, rpl32-trnL, clpP-psbB, trnL intron, and rps16-trnQ contains the lowest number of hotspots while ranking among the top ten combinations that yielded highest BS values (Table S5); hence, it is cost effective to apply this hotspot combination to the phylogenetic and identification studies of Dendrobium.
Methods
Plant materials and DNA extraction
Two grams of fresh leaves were harvested from an individual plant of each tested Dendrobium species (Table 1) grown in the greenhouse of Nanjing Normal University. Total genomic DNA was isolated from the leaves using the DNeasy Plant Mini Kit (Qiagen, Germany) according to the manufacturer’s instructions. The DNA quality was examined by using a NanoDrop 8000 Spectrophotometer (Thermo Scientific, Wilmington, DE). DNA samples with concentration >300 ng/μl, A260/A280 = 1.8–2.0, and A260/A230 >1.7 were used for sequencing.
Plastome sequencing, assembly, and annotation
The total DNA of each tested Dendrobium species was sequenced with an Illumina Hiseq4000 sequencer at 1 Gene, Hangzhou (Hangzhou, China). Approximately 8.75 Gb of 150 bp pair-end reads was yielded for each species; the raw reads were trimmed under the threshold with an error probability <0.05 and then de-novo assembled on CLC Genomics Workbench 6.0.1 (CLC Bio, Aarhus, Denmark). Contigs >30× sequencing depths were collected for reference-based assembly. The plastome of D. officinale (NC_024019) served as a reference sequence. The four junctions between LSC/SSC and IRs were confirmed by PCR amplification using specific primers. Plastome annotation was performed using DOGMA51 and tRNAscan-SE 1.2152. The exact boundaries of annotated genes were confirmed by aligning them with the corresponding orthologs from other Dendrobium species.
Identification of InDels
Sequences of large single copy (LSC), small single copy (SSC), inverted repeat (IR) regions, and retained NDH gene residues from each tested Dendrobium plastome were aligned with reference sequences from the plastome of D. officinale according to the MAFFT program53. InDel events and lengths were counted and determined with DnaSP v554.
Estimates of sequence variability
To assess sequence variability (SV) among plastomes of Dendrobium species, firstly, we retrieved the sequences of intergenic and intronic loci from 25 newly sequenced plastomes. The loci that are flanked by the same genes/exons were identified as syntenic, while the loci smaller than 150 bp were discarded. Secondly, we complied 325 pairs of the 25 Dendrobium plastomes, and aligned the sequences of the syntenic loci for each pair by using MUSCLE55 with the “Refining” option implemented in Mega 5.256. The gaps located at the 5′- and 3′-ends of alignments were excluded. DnaSP v5 was employed to count the numbers of pairwise mutations and InDel events. SV was calculated according to the method of Shaw et al.42: SV = (The number of nucleotide mutations + the number of InDel events)/(the number of conserved sites + the number of nucleotide mutations + the number of InDel events) × 100%. Finally, we calculated the average SV of each syntenic locus.
Counts of SSR elements
SSR (simple sequence repeat) elements located in the syntenic loci were detected using GMATo according to the criteria that the “Mini-length” for mono-nucleotide and multi-nucleotide SSRs were set to be 8 and 5 units, respectively57.
Phylogenetic analysis
The sequences of top ten hotspots (psbB-psbT, ndhF-rpl32, trnT-trnL, rpl32-trnL, clpB-psbB, trnL intron, rpl16-rps3, trnE-trnT, trnR-atpA, and rps16-trnQ) were retrieved from plastomes of 30 Dendrobium species. Sequence alignments of these loci were separately performed using MUSCLE, and then concatenated into 1023 combinations using SequenceMatrix 1.858 (Table S4). ML trees were constructed using RAxML 8.0.259, with Phalaenopsis aphrodite (NC_007499), Phalaenopsis equestris (NC_017609), and Phalaenopsis (hybrid cultivar) (NC_025593) designated as outgroups. For the maximum likelihood tree analysis, a GTRGAMMA model was employed, and supporting values of tree nodes were estimated from 1,000 bootstrap replicates.
Statistical analyses
Statistical analyses were performed by using SPSS Statistics 20.0.
Electronic supplementary material
Acknowledgements
This work was supported by the National Natural Science Foundation of China (Grant No. 31170300 and No. 31670330) and the Priority Academic Program Development of Jiangsu Higher Education Institutions to X.Y.D.
Author Contributions
D.X.Y. designed the study topic. N.Z.T., Z.S.Y. and P.J.J. performed the experiments. N.Z.T., P.J.J., L.L.D. and S.J. analyzed data. N.Z.T. wrote the manuscript.
Competing Interests
The authors declare that they have no competing interests.
Footnotes
Electronic supplementary material
Supplementary information accompanies this paper at doi:10.1038/s41598-017-02252-8
Publisher's note: Springer Nature remains neutral with regard to jurisdictional claims in published maps and institutional affiliations.
References
- 1.Wood, H. P. The Dendrobiums (Timber Press, 2006).
- 2.Adams P. Systematics of Dendrobiinae (Orchidaceae), with special reference to Australian taxa. Botanical Journal of the Linnean Society. 2011;166:105–126. doi: 10.1111/j.1095-8339.2011.01141.x. [DOI] [Google Scholar]
- 3.Xiang XG, et al. Molecular systematics of Dendrobium (Orchidaceae, Dendrobieae) from mainland Asia based on plastid and nuclear sequences. Molecular Phylogenetics and Evolution. 2013;69:950–960. doi: 10.1016/j.ympev.2013.06.009. [DOI] [PubMed] [Google Scholar]
- 4.The State Pharmacopoeia Commission of P. R. China. Pharmacopoeia of the People’s Republic of China 2010, Set of 3 (China Medical Science and Technology Press, 2010).
- 5.Feng S, et al. Molecular identification of Dendrobium species (Orchidaceae) based on the DNA barcode ITS2 region and its application for phylogenetic study. International Journal of Molecular Sciences. 2014;16:21975–21988. doi: 10.3390/ijms160921975. [DOI] [PMC free article] [PubMed] [Google Scholar]
- 6.Xu S, et al. Evaluation of the DNA barcodes in Dendrobium (Orchidaceae) from mainland Asia. PLoS ONE. 2015;10:e0115168. doi: 10.1371/journal.pone.0115168. [DOI] [PMC free article] [PubMed] [Google Scholar]
- 7.Morris MW, Steen WL, Judd WS. Vegetative anatomy and systematics of subtribe Dendrobiinae (Orchidaceae) Botanical Journal of the Linnean Society. 1996;120:89–144. doi: 10.1111/j.1095-8339.1996.tb00483.x. [DOI] [Google Scholar]
- 8.Yukawa T, Uehara K. Vegetative diversification and radiation in subtribe Dendrobiinae (Orchidaceae): evidence from chloroplast DNA phylogeny and anatomical characters. Plant Systematics and Evolution. 1996;201:1–14. doi: 10.1007/BF00989048. [DOI] [Google Scholar]
- 9.Xu H, et al. Detecting adulteration of Dendrobium officinale by real-time PCR coupled with ARMS. International Journal of Food Science and Technology. 2012;47:1695–1700. doi: 10.1111/j.1365-2621.2012.03023.x. [DOI] [Google Scholar]
- 10.How BW, et al. Genetic diversity assessment and ex situ conservation strategy of the endangered Dendrobium officinale (Orchidaceae) using new trinucleotide microsatellite markers. Plant Systematics and Evolution. 2012;298:1483–1491. doi: 10.1007/s00606-012-0651-3. [DOI] [Google Scholar]
- 11.Kang JY, et al. Dendrobium SSR markers play a good role in genetic diversity and phylogenetic analysis of Orchidaceae species. Scientia Horticulturae. 2015;183:160–166. doi: 10.1016/j.scienta.2014.12.018. [DOI] [Google Scholar]
- 12.Li X, et al. Genetic diversity analysis and conservation of the endangered Chinese endemic herb Dendrobium officinale Kimura et Migo (Orchidaceae) based on AFLP. Genetica. 2008;133:159–166. doi: 10.1007/s10709-007-9196-8. [DOI] [PubMed] [Google Scholar]
- 13.Ding G, Li X, Ding X, Qian L. Genetic diversity across natural populations of Dendrobium officinale, the endangered medicinal herb endemic to China, revealed by ISSR and RAPD markers. Genetika. 2009;45:375–382. [PubMed] [Google Scholar]
- 14.Lau DTW, Shaw PC, Wang J, But PPH. Authentication of medicinal Dendrobium species by the internal transcribed spacer of ribosomal DNA. Planta Medica. 2001;67:456–460. doi: 10.1055/s-2001-15818. [DOI] [PubMed] [Google Scholar]
- 15.Xu H, Wang ZT, Ding XY, Zhou KY, Xu LS. Differentiation of Dendrobium species used as Huangcao shihu by rDNA sequence analysis. Planta Medica. 2005;71:1–3. doi: 10.1055/s-2005-916228. [DOI] [PubMed] [Google Scholar]
- 16.Asahina H, Shinozaki J, Masuda K, Morimitsu Y, Satake M. Identification of medicinal Dendrobium species by phylogenetic analyses using matK and rbcL sequences. Journal of Natural Medicines. 2010;64:133–138. doi: 10.1007/s11418-009-0379-8. [DOI] [PubMed] [Google Scholar]
- 17.Wolfe KH, Li WH, Sharp PM. Rates of nucleotide substitution vary greatly among plant mitochondrial, chloroplast, and nuclear DNAs. Proceedings of the National Academy of Sciences of the United States of America. 1987;84:9054–9058. doi: 10.1073/pnas.84.24.9054. [DOI] [PMC free article] [PubMed] [Google Scholar]
- 18.Drouin G, Daoud H, Xia J. Relative rates of synonymous substitutions in the mitochondrial, chloroplast and nuclear genomes of seed plants. Molecular Phylogenetics and Evolution. 2008;49:827–831. doi: 10.1016/j.ympev.2008.09.009. [DOI] [PubMed] [Google Scholar]
- 19.CBOL Plant Working Group. A. DNA barcode for land plants. Proceedings of the National Academy of Sciences of the United States of America. 2009;106:12794–12797. doi: 10.1073/pnas.0905845106. [DOI] [PMC free article] [PubMed] [Google Scholar]
- 20.Kress WJ, Wurdack KJ, Zimmer EA, Weigt LA, Janzen DH. Use of DNA barcodes to identify flowering plants. Proceedings of the National Academy of Sciences of the United States of America. 2005;102:8369–8374. doi: 10.1073/pnas.0503123102. [DOI] [PMC free article] [PubMed] [Google Scholar]
- 21.Kress WJ, Erickson DL. A two-locus global DNA barcode for land plants: the coding rbcL gene complements the non-coding trnH-psbA spacer region. PLoS ONE. 2007;2:e508. doi: 10.1371/journal.pone.0000508. [DOI] [PMC free article] [PubMed] [Google Scholar]
- 22.Ahmed I, et al. Identification of chloroplast genome loci suitable for high-resolution phylogeographic studies of Colocasia esculenta (L.) schott (Araceae) and closely related taxa. Molecular Ecology Resources. 2013;13:929–937. doi: 10.1111/1755-0998.12128. [DOI] [PubMed] [Google Scholar]
- 23.Luo J, et al. Comparative chloroplast genomes of photosynthetic orchids: insights into evolution of the Orchidaceae and development of molecular markers for phylogenetic applications. PLoS ONE. 2014;9:e99016. doi: 10.1371/journal.pone.0099016. [DOI] [PMC free article] [PubMed] [Google Scholar]
- 24.Pan IC, et al. Complete chloroplast genome sequence of an orchid model plant candidate: Erycina pusilla apply in tropical Oncidium breeding. PLoS ONE. 2012;7:e34738. doi: 10.1371/journal.pone.0034738. [DOI] [PMC free article] [PubMed] [Google Scholar]
- 25.Yang JB, Tang M, Li HT, Zhang ZR, Li DZ. Complete chloroplast genome of the genus Cymbidium: lights into the species identification, phylogenetic implications and population genetic analyses. BMC Evolutionary Biology. 2013;13:202–207. doi: 10.1186/1471-2148-13-202. [DOI] [PMC free article] [PubMed] [Google Scholar]
- 26.Lin CS, et al. The location and translocation of ndh genes of chloroplast origin in the Orchidaceae family. Scientific Reports. 2015;5:9040. doi: 10.1038/srep09040. [DOI] [PMC free article] [PubMed] [Google Scholar]
- 27.Kim HT, et al. Seven new complete plastome sequences reveal rampant independent loss of the ndh gene family across orchids and associated instability of the inverted repeat/small single-copy region boundaries. PLoS ONE. 2015;10:e0142215. doi: 10.1371/journal.pone.0142215. [DOI] [PMC free article] [PubMed] [Google Scholar]
- 28.Chang CC, et al. The chloroplast genome of Phalaenopsis aphrodite (Orchidaceae): comparative analysis of evolutionary rate with that of grasses and its phylogenetic implications. Molecular Biology and Evolution. 2006;23:279–291. doi: 10.1093/molbev/msj029. [DOI] [PubMed] [Google Scholar]
- 29.Wu FH, et al. Complete chloroplast genome of Oncidium Gower Ramsey and evaluation of molecular markers for identification and breeding in Oncidiinae. BMC Plant Biology. 2010;10:1–12. doi: 10.1186/1471-2229-10-1. [DOI] [PMC free article] [PubMed] [Google Scholar]
- 30.Braukmann TW, Kuzmina M, Stefanović S. Loss of all plastid ndh genes in Gnetales and conifers: extent and evolutionary significance for the seed plant phylogeny. Current Genetics. 2009;55:323–337. doi: 10.1007/s00294-009-0249-7. [DOI] [PubMed] [Google Scholar]
- 31.Wu CS, Lai YT, Lin CP, Wang YN, Chaw SM. Evolution of reduced and compact chloroplast genomes (cpDNAs) in gnetophytes: selection toward a lower-cost strategy. Molecular Phylogenetics and Evolution. 2009;52:115–124. doi: 10.1016/j.ympev.2008.12.026. [DOI] [PubMed] [Google Scholar]
- 32.Wu CS, Wang YN, Hsu CY, Lin CP, Chaw SM. Loss of different inverted repeat copies from the chloroplast genomes of Pinaceae and Cupressophytes and influence of heterotachy on the evaluation of gymnosperm phylogeny. Genome Biology and Evolution. 2011;3:1284–1295. doi: 10.1093/gbe/evr095. [DOI] [PMC free article] [PubMed] [Google Scholar]
- 33.Wu CS, Chaw SM, Huang YY. Chloroplast phylogenomics indicates that Ginkgo biloba is sister to cycads. Genome Biology and Evolution. 2013;5:243–254. doi: 10.1093/gbe/evt001. [DOI] [PMC free article] [PubMed] [Google Scholar]
- 34.Peredo EL, King UM, Les DH. The plastid genome of Najas flexilis: adaptation to submersed environments is accompanied by the complete loss of the NDH complex in an aquatic angiosperm. PLoS ONE. 2013;8:e68591. doi: 10.1371/journal.pone.0068591. [DOI] [PMC free article] [PubMed] [Google Scholar]
- 35.Sanderson MJ, et al. Exceptional reduction of the plastid genome of saguaro cactus (Carnegiea gigantea): Loss of the ndh gene suite and inverted repeat. American Journal of Botany. 2015;102:1115–1127. doi: 10.3732/ajb.1500184. [DOI] [PubMed] [Google Scholar]
- 36.Lin CP, Huang JP, Wu CS, Hsu CY, Chaw SM. Comparative chloroplast genomics reveals the evolution of Pinaceae genera and subfamilies. Genome Biology and Evolution. 2010;2:504–517. doi: 10.1093/gbe/evq036. [DOI] [PMC free article] [PubMed] [Google Scholar]
- 37.Cho KS, et al. Complete chloroplast genome sequence of tartary Buckwheat (Fagopyrum tataricum) and comparative analysis with common Buckwheat (F. esculentum) PLoS ONE. 2015;10:e0125332. doi: 10.1371/journal.pone.0125332. [DOI] [PMC free article] [PubMed] [Google Scholar]
- 38.Ahmed I, et al. Mutational dynamics of Aroid chloroplast genomes. Genome Biology and Evolution. 2012;4:1316–1323. doi: 10.1093/gbe/evs110. [DOI] [PMC free article] [PubMed] [Google Scholar]
- 39.Kelchner SA. The evolution of non-coding chloroplast DNA and its application in plant systematics. Annals of the Missouri Botanical Garden. 2000;87:482–498. doi: 10.2307/2666142. [DOI] [Google Scholar]
- 40.Downie SR, Jansen RK. A comparative analysis of whole plastid genomes from the Apiales: expansion and contraction of the inverted repeat, mitochondrial to plastid transfer of DNA, and identification of highly divergent noncoding regions. Systematic Botany. 2015;40:336–351. doi: 10.1600/036364415X686620. [DOI] [Google Scholar]
- 41.Xiang XG, et al. Biogeographical diversification of mainland Asian Dendrobium (Orchidaceae) and its implications for the historical dynamics of evergreen broad-leaved forests. Journal of Biogeography. 2016;43:1310–1323. doi: 10.1111/jbi.12726. [DOI] [Google Scholar]
- 42.Shaw J, et al. Chloroplast DNA sequence utility for the lowest phylogenetic and phylogeographic inferences in angiosperms: the tortoise and the hare IV. American Journal of Botany. 2014;101:1987–2004. doi: 10.3732/ajb.1400398. [DOI] [PubMed] [Google Scholar]
- 43.Downie SR, Katz-Downie DS, Cho KJ. Phylogenetic analysis of Apiaceae subfamily Apioideae using nucleotide sequences from the chloroplast rpoC1 intron. Molecular Phylogenetics and Evolution. 1996;6:1–18. doi: 10.1006/mpev.1996.0053. [DOI] [PubMed] [Google Scholar]
- 44.Downie SR, Katz-Downie DS, Watson MF. A phylogeny of the flowering plant family Apiaceae based on chloroplast DNA rpl16 and rpoC1 intron sequences: towards a suprageneric classification of subfamily Apioideae. American Journal of Botany. 2000;87:273–292. doi: 10.2307/2656915. [DOI] [PubMed] [Google Scholar]
- 45.Kelchner SA. Group II introns as phylogenetic tools: structure, function, and evolutionary constraints. American Journal of Botany. 2002;89:1651–1669. doi: 10.3732/ajb.89.10.1651. [DOI] [PubMed] [Google Scholar]
- 46.Pennisi EW. A barcode for plants. Science. 2007;318:190–191. doi: 10.1126/science.318.5848.190. [DOI] [PubMed] [Google Scholar]
- 47.Kress J, Erickson DL. DNA barcodes: Genes, genomics, and bioinformatics. Proceedings of the National Academy of Sciences of the United States of America. 2008;105:2761–2762. doi: 10.1073/pnas.0800476105. [DOI] [PMC free article] [PubMed] [Google Scholar]
- 48.Lahaye R, et al. DNA barcoding the floras of biodiversity hotspots. Proceedings of the National Academy of Sciences of the United States of America. 2008;105:2923–2928. doi: 10.1073/pnas.0709936105. [DOI] [PMC free article] [PubMed] [Google Scholar]
- 49.Fazekas AJ, et al. Multiple multilocus DNA barcodes from the plastid genome discriminate plant species equally well. PLoS ONE. 2008;3:e2802. doi: 10.1371/journal.pone.0002802. [DOI] [PMC free article] [PubMed] [Google Scholar]
- 50.Singh HK, Parveen I, Raghuvanshi S, Babbar SB. The loci recommended as universal barcodes for plants on the basis of floristic studies may not work with congeneric species as exemplified by DNA barcoding of Dendrobium species. BMC Research Notes. 2012;5:42. doi: 10.1186/1756-0500-5-42. [DOI] [PMC free article] [PubMed] [Google Scholar]
- 51.Wyman SK, Jansen RK, Boore JL. Automatic annotation of organellar genomes with DOGMA. Bioinformatics. 2004;20:3252–3255. doi: 10.1093/bioinformatics/bth352. [DOI] [PubMed] [Google Scholar]
- 52.Schattner P, Brooks AN, Lowe TM. The tRNAscan-SE, snoscan and snoGPS web servers for the detection of tRNAs and snoRNAs. Nucleic Acids Research. 2005;33:W686–689. doi: 10.1093/nar/gki366. [DOI] [PMC free article] [PubMed] [Google Scholar]
- 53.Katoh K, Kuma K, Toh H, Miyata T. MAFFT version 5: improvement in accuracy of multiple sequence alignment. Nucleic Acids Research. 2005;33:511–518. doi: 10.1093/nar/gki198. [DOI] [PMC free article] [PubMed] [Google Scholar]
- 54.Librado P, Rozas J. DnaSP v5: a software for comprehensive analysis of DNA polymorphism data. Bioinformatics. 2009;25:1451–1452. doi: 10.1093/bioinformatics/btp187. [DOI] [PubMed] [Google Scholar]
- 55.Edgar RC. MUSCLE: multiple sequence alignment with high accuracy and high throughput. Nucleic Acids Research. 2004;32:1792–1797. doi: 10.1093/nar/gkh340. [DOI] [PMC free article] [PubMed] [Google Scholar]
- 56.Tamura K. MEGA5: molecular evolutionary genetics analysis using maximum likelihood, evolutionary distance, and maximum parsimony methods. Molecular Biology and Evolution. 2011;28:2731–2739. doi: 10.1093/molbev/msr121. [DOI] [PMC free article] [PubMed] [Google Scholar]
- 57.Wang X, Lu P, Luo Z. GMATo: A novel tool for the identification and analysis of microsatellites in large genomes. Bioinformation. 2013;9:541–544. doi: 10.6026/97320630009541. [DOI] [PMC free article] [PubMed] [Google Scholar]
- 58.Vaidya G, Lohman DJ, Meier R. SequenceMatrix: concatenation software for the fast assembly of multi-gene datasets with character set and codon information. Cladistics. 2011;27:171–180. doi: 10.1111/j.1096-0031.2010.00329.x. [DOI] [PubMed] [Google Scholar]
- 59.Stamatakis A. RAxML version 8: a tool for phylogenetic analysis and post-analysis of large phylogenies. Bioinformatics. 2014;30:1312–1313. doi: 10.1093/bioinformatics/btu033. [DOI] [PMC free article] [PubMed] [Google Scholar]
Associated Data
This section collects any data citations, data availability statements, or supplementary materials included in this article.