

Abstract
AIM
To estimate the overall prevalence of diabetic retinopathy (DR) in Iran by a systematic review and Meta-analysis.
METHODS
We conducted a search of all published literature on diabetic patients for the prevalence of DR using Web of Sciences, PubMed, Scopus, Google Scholar, and national electronic databases SID, Magiran, and Iranmedex from their inception until September 2016 with standard keywords. Pooled estimates of the DR prevalence and the corresponding 95% confidence intervals (CI) were calculated using random effects models.
RESULTS
Thirty-one studies involving 23 729 patients with type I and II diabetes were included. The publication bias assumption for prevalence of DR was rejected by Begg and Egger tests (P=0.825, P=0.057, respectively). The results of Cochran test and I2 statistics showed considerable heterogeneity for prevalence of DR (Q=1278.21, d.f.=30, P<0.001 and I2=97.7%). The prevalence of DR, non-proliferative diabetic retinopathy (NPDR) and proliferative diabetic retinopathy (PDR) in Iranian diabetic patients were 41.9% (95% CI: 35.6-48.2), 32.2% (95% CI: 28.7-35.8), and 13.2% (95% CI: 8.3-18.1), respectively.
CONCLUSION
The prevalence of DR in Iran appears a little high. NPDR was more common. This study highlights the necessity for DR screening and management in diabetic patients in Iran.
Keywords: diabetic retinopathy, Iran, prevalence, Meta-analysis, systematic review
INTRODUCTION
Diabetic retinopathy (DR) is a major cause of visual impairment and blindness among working aged adults worldwide[1]. As the prevalence of diabetes in adults of working-age increases[2], a parallel increase in DR as common complication of diabetes might be expected. There are two types of diabetic retinopathy: non-proliferative diabetic retinopathy (NPDR) and proliferative diabetic retinopathy (PDR). NPDR, also known as background retinopathy, is the early stage of the disease in which symptoms will be mild or non-existent. PDR is the more advanced form of the DR and mainly occurs when abnormal new blood vessels grow on the surface of the retina[1],[3]. The known risk factors for DR are duration of diabetes, hyperglycemia, hypertension and dyslipidemia[1],[3]–[4]. Previous research indicated that the risk of vision loss due to DR could be reduced by tight control of serum glucose and blood pressure[4].
A recent systematic review of 35 population-based studies around the world showed that the prevalence of DR and PDR among people with diabetes was 34.6% and 7.0%, respectively[5]. Moreover, both DR and PDR prevalence were higher in people with type I compared with type II diabetes[5]. Despite the importance of this issue, and its significant impact on the health care systems and the rising prevalence of diabetes notably in working-age adults, there are no overall precise estimates of the DR prevalence in Iran, particularly based on the two main type of DR (i.e. NPDR and PDR). Previous individual researches have shown considerable variability in DR prevalence estimates among adults with both type I and II diabetes, with rates ranging from 10.4% to 76.4%[6]–[36].
Due to the considerable heterogeneity among the reported prevalence rate of DR in previous individual studies and significant impact of DR on the health-care systems, the broader and more precise estimate of the prevalence of DR is necessary for strategic plan and health policy. We therefore performed a systematic review and Meta-analysis of all published studies to estimate the overall prevalence rate of DR as well as NPDR and PDR among adult diabetic persons in Iran.
MATERIALS AND METHODS
Search Strategy
This Meta-analysis was conducted according to PRISMA (Preferred Reporting Items for Systematic Reviews and Meta-Analyses) checklist[37]. We conducted a literature search of published papers in September 2016 using international and national electronic databases Web of Science, PubMed, Scopus, Google Scholar, Magiran, SID, and Iranmedex. Key words included “diabetic retinopathy”, “prevalence” and “Iran”. We also checked the reference lists of the included article for further relevant articles. No language or time restriction was applied to the searches.
Inclusion and Exclusion Criteria
The following inclusion criteria were used to select studies for the Meta-analysis: 1) studies with prevalence estimates of DR, 2) studies of any language and time. We excluded the following studies: 1) intervention or treatment studies, 2) studies in newly diagnosed diabetic patients, 3) repeated or overlapping studies, and 4) no usable data reported.
Data Extraction and Quality Assessment
Two authors (Maroufizadeh S and Almasi-Hashiani A) independently extracted the following data from the included studies: first author's name, year of publication, location, year of study, sample size, type of diabetes, sex ratio, age, duration of diabetes and prevalence estimate of DR, NPDR and PDR. Two reviewers (Maroufizadeh S and Hosseini M) independently performed the quality assessment based on the Strengthening the Reporting of Observational Studies in Epidemiology (STROBE) checklist.
Statistical Analysis
All statistical analyses were performed using STATA version 13.0 (Stata Corp, College Station, TX, USA). Statistical heterogeneity among the studies was assessed by the Cochrane Q test and I2 statistic[38]. For the Cochrane Q test, P<0.10 was considered statistically significant for heterogeneity. The I2 statistic indicates the percentage of total variation across studies due to heterogeneity rather than chance. I2 values of 25%, 50% and 75% correspond to low, moderate and high heterogeneity, respectively[38]. The Meta-analysis was performed with a random effect model, considering the remarkable heterogeneity among studies. Meta regression was conducted to explore the sources of between-study heterogeneity, including year of study and sample size. We conducted sensitivity analyses by excluding each study at a time from the Meta-analysis, in order to examine its influence on the pooled estimate. The Galbraith plot was also used to detect the potential sources of heterogeneity[39]. The Funnel plot and Begg's rank correlation and Egger's weighted regression tests were used to assess publication bias[40]–[41]. Finally, cumulative Meta-analysis was also conducted to investigate whether the magnitude of prevalence rate changes markedly with time of study.
RESULTS
Study Selection
Figure 1 shows the results of the literature search and selection process based on the PRISMA flow chart for systematic reviews[37]. A total of 225 potentially relevant articles were identified from the initial searches. After removing duplicates, 112 articles remained. We excluded 69 articles by screening titles and abstracts, and retrieved the full texts of 43 remaining articles. Finally, 31 studies met the inclusion criteria and were included in this Meta-analysis (Figure 1).
Figure 1. Flow diagram of the literature search for studies included in Meta-analysis.

Study Characteristics
The characteristics of included studies are presented in Table 1. These studies were published between 2003 (Janghorbani et al[6]) and 2016 (Eslami et al[36]). The sample size of included articles varied from 46 (Soleymanian et al[33]) to 3734 (Hosseini et al[21]), with a total of 23 729 cases.
Table 1. Description of the studies included in the Meta-analysis.
| Author | Location | Year | Sample size | Prevalence |
Age (a) | Duration of disease (a) | ||
| DR | NPDR | PDR | ||||||
| Janghorbani et al (2003)[6] | Isfahan | 1992-2001 | 549 | 45.3 | - | - | 44.6 (9.3) | 5.9 (5.7) |
| Manaviat et al (2004)[7] | Yazd | 2000-2001 | 590 | 39.3 | 33.9 | 5.4 | 54.9 (10.2) | 10.2 (6.6) |
| Aghadoost et al (2005)[8] | Kashan | 2002-2003 | 200 | 36.0 | 31.0 | 5.0 | 51.2 (-) | 12.0 (-) |
| Ghasemi et al (2005)[9] | Tehran | 1998-2002 | 253 | 69.6 | 48.6 | 21.0 | 60.8 (11.6) | 11.1 (7.8) |
| Mazarei et al (2005)[10] | Ghazvin | 2000-2001 | 94 | 52.1 | 34.0 | 18.1 | 55.0 (15.8) | 7.5 (3.4) |
| Faghih-Imani et al (2005)[11] | Isfahan | 2004 | 500 | 76.4 | - | - | 49.6 (-) | - |
| Ramezani et al (2006)[12] | Tehran | 1998-2002 | 288 | 56.6 | 29.9 | 26.7 | 53 (15.9) | 11.2 (8.0) |
| Akbarzadeh et al (2006)[13] | Hamadan | 1999 | 2000 | 13.1 | - | - | <40: 28.3% | <10: 51.6% |
| Abdollahi et al (2007)[14] | Tehran | 12007 | 181 | 37.6 | - | - | 55.5 (11.7) | 9.9 (6.7) |
| Naseripoor et al (2006)[15] | Kermanshah | 1993-1999 | 610 | 32.9 | - | - | 47.2 (15.7) | 6.1 (5.2) |
| Shafiepour et al (2006)[16] | Sari | 2005 | 540 | 34.2 | 31.8 | 2.4 | 52.66 (11.5) | 8.4 (6.3) |
| Shahbazian et al (2006)[17] | Ahvaz | 2004 | 200 | 43.5 | 31.0 | 12.5 | 51.8 (5.8) | 9.6 (6.9) |
| Esteghamati et al (2007)[18] | Tehran | 12007 | 66 | 36.4 | - | - | 57.0 (9.5) | 14.44 (6.8) |
| Davari et al (2008)[19] | Birjand | 2006-2007 | 359 | 37.3 | 26.7 | 10.6 | 51.2 (15.2) | <5: 66.6% |
| Manaviat et al (2008)[20] | Yazd | 12008 | 199 | 70.3 | 45.2 | 25.1 | 54.2 (11.0) | 10.3 (6. 9) |
| Hosseini et al (2009)[21] | Isfahan | 2009 | 3734 | 54.0 | - | - | 52.2 (10.5) | 7.00 (6.00) |
| Javadi et al (2009)[22] | Tehran | 2007 | 634 | 37.8 | 27.6 | 10.2 | 59.3 (12.0) | <10: 67.7% |
| Hosseini et al (2012)[23] | Qom | 2005-2006 | 261 | 39.1 | 27.6 | 11.5 | 52.2 (11.5) | 9.1 (7.1) |
| Salehi et al (2012)[24] | Tehran | 2005 | 367 | 32.7 | - | - | 57.5 (9.8) | 7.3 (6.1) |
| Dehghan et al (2013)[25] | Yazd | 2011 | 529 | 30.0 | - | - | 57.0 (9.8) | 6.4 (6.3) |
| Kohian et al (2013)[26] | Shahroud | 1999-2002 | 625 | 29.3 | 23.4 | 5.9 | 47.9 (11.7) | <6: 74.6 |
| Mahmoudi et al (2013)[27] | Saqqez | 2011 | 1563 | 12.1 | - | - | 53.6 (11.8) | - |
| Tazhibi et al (2014)[28] | Isfahan | 2003 | 3535 | 53.4 | - | - | 52.57 (10.3) | 7.1 (6.7) |
| Yaghoubi et al (2014)[29] | Mashhad | 2011 | 342 | 30.4 | 22.2 | 8.2 | 55.05 (9.1) | <10: 47.4% |
| Ghodsi et al (2014)[30] | Fasa | 2009-2013 | 978 | 10.4 | - | - | 51.8 (12.9) | 9.3 (6.0) |
| Azizi-Soleiman et al (2015)[31] | Isfahan | 12015 | 1782 | 57.2 | - | - | 50.3 (9.6) | 5.8 (5.9) |
| Rasoulinejad et al (2015)[32] | Babol | 2006-2010 | 1562 | 63.4 | 36.9 | 26.5 | 54.6 (10.6) | 10.6 (7.3) |
| Soleymanian et al (2015)[33] | Tehran | 2008-2011 | 46 | 39.1 | - | - | 48.9 (11.9) | 7.2 (5.6) |
| Bonakdaran et al (2015)[34] | Mashhad | 12015 | 235 | 35.0 | 27.2 | 7.7 | 54.8 (9.4) | 7.5 (6.1) |
| Vahabi et al (2015)[35] | Tehran | 12015 | 623 | 37.9 | - | - | 59.9 (11.5) | 7.2 (6.0) |
| Eslami et al (2016)[36] | Hamadan | 2013-2014 | 284 | 54.2 | 39.1 | 15.1 | - | <10: 35.6% |
DR: Diabetic retinopathy; NPDR: Non-proliferative diabetic retinopathy; PDR: Proliferative diabetic retinopathy. 1Year of publication.
mean (%)
Evaluation of Heterogeneity and Meta-analysis
The results of Cochran's Q test and I2 statistics indicated substantial heterogeneity among the included studies for DR (Q=1278.21, d.f.=30, P<0.001 and I2=97.7%), PDR (Q=65.63, d.f.=15, P<0.001 and I2=77.1%) and NPDR (Q=42.95, d.f.=15, P<0.001 and I2=65.1%), and thus random effects model was used for analysis. The pooled prevalence of DR was 41.9% (95% CI: 35.6-48.2). As seen in Figure 2, the lowest and highest prevalence of DR was reported by Ghodsi et al[30] in Fasa (southern of Iran) (10.4%, 95% CI: 4.5-16.3) and Faghih-Imani et al[11] in Isfahan (center of Iran) (76.4%, 95% CI: 72.1-80.7), respectively. In addition, the pooled prevalence rates of NPDR (Figure 3) and PDR (Figure 4) were 32.2% (95% CI: 28.7-35.8), 13.2% (95% CI: 8.3-18.1), respectively.
Figure 2. Forest plot showing prevalence of diabetic retinopathy among diabetic patients in Iran.

Figure 3. Forest plot showing prevalence of non-proliferative diabetic retinopathy among diabetic patients in Iran.

Figure 4. Forest plot showing prevalence of proliferative diabetic retinopathy among diabetic patients in Iran.

Meta Regression
Meta regression was used to explore the sources of between-study heterogeneity, including year of study and sample size. According to the results, prevalence of DR, PDR and NPDR was not related to year of study (all P>0.05) and sample size (all P>0.05).
Publication Bias
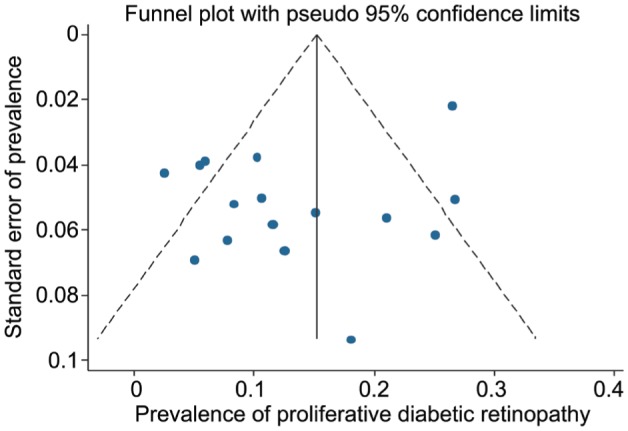
As seen in Figures 5, 6 and 7, the funnel plots showed symmetry, demonstrating the absence of publication bias among the included studies. The Begg's and Egger's tests also confirmed the absence of publication bias among the included studies for prevalence of DR (P=0.825 and P=0.075, respectively), PDR (P=0.471 and P=0.103, respectively) and NPDR (P=0.964 and P=0.527, respectively).
Figure 5. Funnel plot for assessing publication bias in Meta-analysis for diabetic retinopathy.
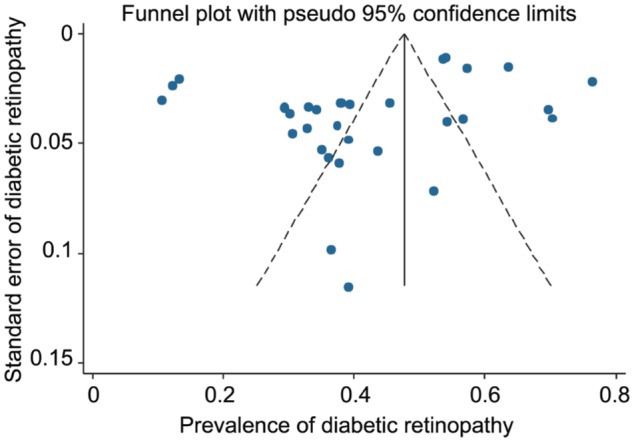
Figure 6. Funnel plot for assessing publication bias in Meta-analysis for non-proliferative diabetic retinopathy.
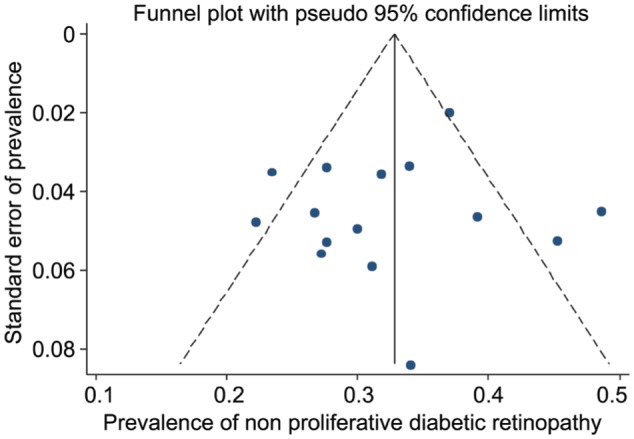
Figure 7. Funnel plot for assessing publication bias in Meta-analysis for proliferative diabetic retinopathy.
Sensitivity Analysis
To evaluate the influence of each individual study, we performed sensitivity analyses by excluding each study from the Meta-analyses and comparing the point estimates before and after excluding each specific individual study. Based on the sensitivity analysis, exclusion of individual studies did not change the results substantially, with pooled prevalence of DR ranging from 40.7% (when excluding Faghih-Imani et al[11]) and 43.01% (when excluding Ghodsi et al[30]). And also, after sensitivity analysis, pooled prevalence of PDR ranging from 12.27% (when excluding Ramezani et al[12]) to 14.02% (when excluding Shafiepour et al[16]) and the pooled prevalence of NPDR ranging from 31.17% (when excluding Ghasemi et al[9]) to 32.9% (when excluding Davari et al[19]).
Cumulative Meta-analysis
Cumulative Meta-analysis was also performed by sorting the studies based on publication time. As shown in Figures 8, 9 and 10, cumulative Meta-analysis of DR prevalence revealed that the overall prevalence estimates were stable and that the 95% CIs narrowed with accumulation of data over time.
Figure 8. Cumulative Meta-analysis of diabetic retinopathy by sorting the studies based on publication time.

Figure 9. Cumulative Meta-analysis of non-proliferative diabetic retinopathy by sorting the studies based on publication time.

Figure 10. Cumulative Meta-analysis of proliferative diabetic retinopathy by sorting the studies based on publication time.

DISCUSSION
It is very important to estimate the prevalence of DR as it is a key indicator of systemic diabetic microvascular complications, which, in turn, is a crucial indicator of the impact of diabetes on patients. Furthermore, it is adequately essential to create an extensive and more accurate estimate of the prevalence of DR, particularly for its two main type (i.e. NPDR and PDR), so it can be used for guiding public health education and managing the clinical aspects of this disease in a favorable way. The better management of DR and diabetes, and overall increased screening for diabetes, may have caused the incidence and prevalence DR to decline over time[42].
With the expected increased prevalence of type 2 diabetes in the population, in part due to increasing rates of obesity and decreasing physical activity, the burden of diabetic retinopathy might be expected to increase as well[5],[43]. However, improved access to screening tools and treatment of diabetic retinopathy may reduce the burden of diabetes-related vision loss.
To the best of our knowledge, this is the first systematic review and Meta-analysis of DR prevalence in Iran. In this Meta-analysis, a total of 31 studies with 23 729 people with diabetes were included. In the present study, the overall prevalence of DR using the random effect model was 41.9%, which is higher than what was reported in United Arab Emirates (19.0%)[44], India (21.7%)[45], Mainland China (23.0%)[46], Peru (23.1%)[47], Puerto Rico (37.7%)[48], but lower than what was reported in adult Latinos (46.9%)[49].
As indicated in the findings, there was considerable heterogeneity among included studies. Some of these differences between individual studies regarding DR prevalence, may be due to the differences in time periods of the studies. Also, in this Meta-analysis, it is possible that the prevalence rates of DR have been affected by the dissimilarity of studies concerning the ophthalmologic definitions and examination methodologies. However, the pooled prevalence rates of DR were also estimated by random-effects model. Furthermore, DR susceptibility may also vary among different ethnic groups[5]. Although the prevalence of DR in this Meta-analysis is higher than the previously reported global estimates of 34.6% reported by Yau et al[5], several factors make it difficult to compare the estimates.
The present study has several strengths that should be mentioned. The major strengths of our study were the large sample size of diabetic patients, which enabled us to estimate the overall prevalence of DR from different prevalence studies. Second, the funnel plot and the Begg and Egger's tests did not support the presence of publication bias, providing further indication of the robustness of our results. Nevertheless, our study has some limitations that should be noted when interpreting the findings. First, considerable heterogeneity was observed among studies. Therefore, even if we used random effects model to take heterogeneity into account, our overall estimates should be interpreted with caution. Second, we could not conduct Meta-regression for other sources of between-study heterogeneity-hyperglycemia, hypertension and dyslipidemia-since we did not have data on these risk factors. These factors have been found to be related to DR. Finally, the absence of studies from the South, South East, and North West of Iran could also affect the generalizability of our findings.
In Iran, the prevalence of DR, especially PDR, appeared a little high. Furthermore, with the aging of the population and the increasing prevalence of diabetes among working-aged adults, the number of individuals of DR will likely increase. Our data provide policy makers updated information for use in effective screening of DR, planning eye care services, management of DR risk factors and rehabilitation.
Acknowledgments
Authors' Contributions: Maroufizadeh S, Almasi-Hashiani A and Omani Samani R contributed to conceive and design of the study. Maroufizadeh S and Almasi-Hashiani A performed the literature search, data extraction and quality assessment. Maroufizadeh S, Almasi-Hashiani A and Hosseini M performed data analysis and interpretation. Maroufizadeh S, Almasi-Hashiani A and Hosseini M were responsible for data extraction and the accuracy of the data analysis. Maroufizadeh S, Almasi-Hashiani A, Hosseini M and Sepidarkish M drafted the manuscript and Omani Samani R reviewed it.
Conflicts of Interest: Maroufizadeh S, None; Almasi-Hashiani A, None; Hosseini M, None; Sepidarkish M, None; Omani Samani R, None.
REFERENCES
- 1.Cheung N, Mitchell P, Wong TY. Diabetic retinopathy. Lancet. 2010;376(9735):124–136. doi: 10.1016/S0140-6736(09)62124-3. [DOI] [PubMed] [Google Scholar]
- 2.Wild S, Roglic G, Green A, Sicree R, King H. Global prevalence of diabetes estimates for the year 2000 and projections for 2030. Diabetes Care. 2004;27(5):1047–1053. doi: 10.2337/diacare.27.5.1047. [DOI] [PubMed] [Google Scholar]
- 3.Kobrin Klein BE. Overview of epidemiologic studies of diabetic retinopathy. Ophthalmic Epidemiol. 2007;14(4):179–183. doi: 10.1080/09286580701396720. [DOI] [PubMed] [Google Scholar]
- 4.Lee R, Wong TY, Sabanayagam C. Epidemiology of diabetic retinopathy, diabetic macular edema and related vision loss. Eye Vis (Lond) 2015;2(1):1. doi: 10.1186/s40662-015-0026-2. [DOI] [PMC free article] [PubMed] [Google Scholar]
- 5.Yau JW, Rogers SL, Kawasaki R, et al. Global prevalence and major risk factors of diabetic retinopathy. Diabetes Care. 2012;35(3):556–564. doi: 10.2337/dc11-1909. [DOI] [PMC free article] [PubMed] [Google Scholar]
- 6.Janghorbani M, Amini M, Ghanbari H, Safaiee H. Incidence of and risk factors for diabetic retinopathy in Isfahan, Iran. Ophthalmic Epidemiol. 2003;10(2):81–95. doi: 10.1076/opep.10.2.81.13893. [DOI] [PubMed] [Google Scholar]
- 7.Manaviat MR, Afkhami M, Shoja MR. Retinopathy and microal-buminuria in type II diabetic patients. BMC Ophthalmol. 2004;4(1):1. doi: 10.1186/1471-2415-4-9. [DOI] [PMC free article] [PubMed] [Google Scholar]
- 8.Aghadoost D, Sadr SF. Prevalence and risk factors for diabetic retinopathy in diabetic patients of Kashan Diabetic Center in 2002-2003. Feyz. 2005;9(1):62–65. [Google Scholar]
- 9.Ghasemi H, Afshar R, Pourfarzam S. Frequency of diabetic retinopathy and related factors in ophthalmologic consults in Shahid Mostafa Khomeini Hospital between 1998-2002. Ann Mil Health Sci Res. 2005;3(2):579–584. [Google Scholar]
- 10.Mazarei M. Risk factors of diabetic retinopathy in patients referred to Bouali eye center. J Qazvin Univ Med Sci. 2005;9(3):34–39. [Google Scholar]
- 11.Faghih-Imani E, Amini M, Adibi P. Silent ischemia in type I diabetic patients: a study of EKG changes. ARYA J. 2005;1(2):89–93. [Google Scholar]
- 12.Ramezani M, Karimi AA. Prevalence of retinopathy and related factors in hospital diabetic patience patients in Bagiyatallah hospital in Tehran (1377-1381) Yafteh. 2006;7(1):29–36. [Google Scholar]
- 13.Akbarzadeh S, Mani-Kashani K. Evaluation of types of diabetic retinopathies and associated factors in diabetic patients. Med J Tabriz Univ Med Sci. 2006;28(2):15–18. [Google Scholar]
- 14.Abdollahi A, Daneshpazhooh M, Amirchaghmaghi E, Sheikhi S, Eshrati B, Bastanhagh MH. Dermopathy and retinopathy in diabetes: is there an association? Dermatology. 2007;214(2):133–136. doi: 10.1159/000098572. [DOI] [PubMed] [Google Scholar]
- 15.Naseripoor M, Ansari M, Sheikhi F, Danesghgar F, Omidian J, Ghaderi E. Retinopathy prevalence and its risk factors in diabetics at Kermanshah Diabetes Research Centre (1994-2000) J Kermanshah Univ Med Sci. 2006;9(4):44–51. [Google Scholar]
- 16.Shafiepour L, Ahmadzadeh A, Shafiepour V, Khalilian AR. The prevalence of diabetic retinopathy and risk factors among diabetic patients attending to Imam Khomeini hospital in Sari. J Mazandaran Univ Med Sci. 2006;16(55):125–130. [Google Scholar]
- 17.Shahbazian H, Feghhi M, Shahbazian H, Sadeghi A, Karimi Moghaddam A, Ahmadzadeh A, Latifi M, Amani R. Evaluation of relationship between prevalence and intensity of diabetic retinopathy and nephropathy among type 2 diabetic patients referred to Golestan Hospital diabetes clinic. Jundishapur Sci Med J. 2006;5(3):600–606. [Google Scholar]
- 18.Esteghamati A, Rashidi A, Nikfallah A, Yousefizadeh A. The association between urodynamic findings and microvascular complications in patients with long-term type 2 diabetes but without voiding symptoms. Diabetes Res Clin Pract. 2007;78(1):42–50. doi: 10.1016/j.diabres.2007.02.011. [DOI] [PubMed] [Google Scholar]
- 19.Davari M, Kalbasi S, Yaghoobi G, Sharifzadeh G, Khodashenas M. Risk factors for diabetic retinopathy in type II diabetes mellitus. Bina J Ophthalmol. 2008;14(1):10–15. [Google Scholar]
- 20.Manaviat MR, Rashidi M, Afkhami-Ardekani M, Shoja MR. Prevalence of dry eye syndrome and diabetic retinopathy in type 2 diabetic patients. BMC Ophthalmol. 2008;8(1):10. doi: 10.1186/1471-2415-8-10. [DOI] [PMC free article] [PubMed] [Google Scholar]
- 21.Hosseini SM, Maracy MR, Amini M. A risk score development for diabetic retinopathy screening in Isfahan-Iran. J Res Med Sci. 2009;14(2):105–110. [PMC free article] [PubMed] [Google Scholar]
- 22.Javadi MA, Katibeh M, Rafati N, Dehghan MH, Zayeri F, Yaseri M, Sehat M, Ahmadieh H. Prevalence of diabetic retinopathy in Tehran province: a population-based study. BMC Ophthalmol. 2009;9:12. doi: 10.1186/1471-2415-9-12. [DOI] [PMC free article] [PubMed] [Google Scholar]
- 23.Hosseini R, Davoodabadi Farahani A. Prevalence and risk factors of diabetic retinopathy in patients referred to diabetes clinic of Kamkar Hospital in Qom. Qom Univ Med Sci J. 2012;5(4):40–46. [Google Scholar]
- 24.Salehi M, Vazirinasab H, Khoshgam M, Rafati N. Application of the generalized additive model in determination of the retinopathy risk factors relation types for Tehran diabetic patients. Razi J Med Sci. 2012;19(97):1–9. [Google Scholar]
- 25.Dehghan M, Katibeh M, Ahmadieh H, Ramezani A, Moradian S, Noorinia R, Ziaei H, Mahdavi A, Yaseri M, Naghib J, Toosi A, Azarmina M, Roohi K, Javadi M. Prevalence and risk factors of diabetic retinopathy in Yazd Province. Bina J Ophthalmol. 2013;18(4):375–391. [Google Scholar]
- 26.Kohian H, Sohrabi M, Zolfaghari P, Shaker S, Farsad R, Yahyaei E. The Prevalence and related factors of diabetic retinopathy in Shahroud. Knowledge Health. 2013;7(4):179–184. [Google Scholar]
- 27.Mahmoudi H, Javadi F, Javaheri M, Mohammadi Y, Kashani A, Safipour Afshar A, Daneshi Maskooni M. Examining the relation between health literacy and outcomes of diabetes in patients with type 2 diabetes in Saqez, western Iran. Intl Res J Appl Basic Sci. 2013;7(10):648–652. [Google Scholar]
- 28.Tazhibi M, Sarrafzade S, Amini M. Retinopathy risk factors in type II diabetic patients using factor analysis and discriminant analysis. J Educ Health Promot. 2014;3:85. doi: 10.4103/2277-9531.139251. [DOI] [PMC free article] [PubMed] [Google Scholar]
- 29.Yaghoubi MA, Bonakdaran S, Shoeibi N, Nabavi A. Relationship between hsCRP levels with the presence and severity of diabetic retinopathy. Med J Mashhad Univ Med Sci. 2014;57(6):756–761. [Google Scholar]
- 30.Ghodsi R, Hamayeli Meharbani H, Avand AQ, Bordbar A, Ahmadzadeh S. A study on the prevalence of diabetic complications in Fasa Diabetes Clinic. Asian J Med Pharm Res. 2014;4(1):68–72. [Google Scholar]
- 31.Azizi-Soleiman F, Heidari-Beni M, Ambler G, Omar R, Amini M, Hosseini SM. Iranian risk model as a predictive tool for retinopathy in patients with type 2 diabetes. Can J Diabetes. 2015;39(5):358–363. doi: 10.1016/j.jcjd.2015.01.290. [DOI] [PubMed] [Google Scholar]
- 32.Rasoulinejad SA, Hajian-Tilaki K, Mehdipour E. Associated factors of diabetic retinopathy in patients that referred to teaching hospitals in Babol. Caspian J Intern Med. 2015;6(4):224–228. [PMC free article] [PubMed] [Google Scholar]
- 33.Soleymanian T, Hamid G, Arefi M, Najafi I, Ganji MR, Amini M, Hakemi M, Tehrani MRM, Larijani B. Non-diabetic renal disease with or without diabetic nephropathy in type 2 diabetes: clinical predictors and outcome. Renal Failure. 2015;37(4):572–575. doi: 10.3109/0886022X.2015.1007804. [DOI] [PubMed] [Google Scholar]
- 34.Bonakdaran S, Shoeibi N. Is there any correlation between vitamin D insufficiency and diabetic retinopathy? Int J Ophthalmol. 2015;8(2):326–331. doi: 10.3980/j.issn.2222-3959.2015.02.20. [DOI] [PMC free article] [PubMed] [Google Scholar]
- 35.Vahabi N, Salehi M, Zayeri F, Yaseri M. Application of Bayesian logistic regression for determining the risk factors of diabetic retinopathy. Razi J Med Sci. 2015;22(135):131–139. [Google Scholar]
- 36.Eslami F, Ghasemi Basir HR. The Prevalence of diabetic retinopathy and its relationship with microalbuminuria in type2 diabetic patients at Diabetes Center of Hamadan City. Sci J Hamadan Univ Med Sci. 2016;22(4):286–292. [Google Scholar]
- 37.Moher D, Liberati A, Tetzlaff J, Altman DG. Preferred reporting items for systematic reviews and meta-analyses: the PRISMA statement. Int J Surg. 2010;8(5):336–341. doi: 10.1016/j.ijsu.2010.02.007. [DOI] [PubMed] [Google Scholar]
- 38.Higgins JP, Thompson SG. Quantifying heterogeneity in a meta-analysis. Stat Med. 2002;21(11):1539–1558. doi: 10.1002/sim.1186. [DOI] [PubMed] [Google Scholar]
- 39.Galbraith RF. A note on graphical presentation of estimated odds ratios from several clinical trials. Stat Med. 1988;7(8):889–894. doi: 10.1002/sim.4780070807. [DOI] [PubMed] [Google Scholar]
- 40.Begg CB, Mazumdar M. Operating characteristics of a rank correlation test for publication bias. Biometrics. 1994;50(4):1088–1101. [PubMed] [Google Scholar]
- 41.Egger M, Smith GD, Schneider M, Minder C. Bias in meta-analysis detected by a simple, graphical test. BMJ. 1997;315(7109):629–634. doi: 10.1136/bmj.315.7109.629. [DOI] [PMC free article] [PubMed] [Google Scholar]
- 42.Wong TY, Mwamburi M, Klein R, Larsen M, Flynn H, Hernandez-Medina M, Ranganathan G, Wirostko B, Pleil A, Mitchell P. Rates of progression in diabetic retinopathy during different time periods a systematic review and meta-analysis. Diabetes Care. 2009;32(12):2307–2313. doi: 10.2337/dc09-0615. [DOI] [PMC free article] [PubMed] [Google Scholar]
- 43.Saaddine JB, Honeycutt AA, Narayan KV, Zhang X, Klein R, Boyle JP. Projection of diabetic retinopathy and other major eye diseases among people with diabetes mellitus: United States, 2005-2050. Arch Ophthalmol. 2008;126(12):1740–1747. doi: 10.1001/archopht.126.12.1740. [DOI] [PubMed] [Google Scholar]
- 44.Al-Maskari F, El-Sadig M. Prevalence of diabetic retinopathy in the United Arab Emirates: a cross-sectional survey. BMC Ophthalmol. 2007;7(1):11. doi: 10.1186/1471-2415-7-11. [DOI] [PMC free article] [PubMed] [Google Scholar]
- 45.Gadkari SS, Maskati QB, Nayak BK. Prevalence of diabetic retinopathy in India: The All India Ophthalmological Society Diabetic Retinopathy Eye Screening Study 2014. Indian J Ophthalmol. 2016;64(1):38–44. doi: 10.4103/0301-4738.178144. [DOI] [PMC free article] [PubMed] [Google Scholar]
- 46.Liu L, Wu X, Liu L, Geng J, Yuan Z, Shan Z, Chen L. Prevalence of diabetic retinopathy in mainland China: a meta-analysis. PLoS One. 2012;7(9):e45264. doi: 10.1371/journal.pone.0045264. [DOI] [PMC free article] [PubMed] [Google Scholar]
- 47.Villena JE, Yoshiyama CA, Sánchez JE, Hilario NL, Merin LM. Prevalence of diabetic retinopathy in Peruvian patients with type 2 diabetes: results of a hospital-based retinal telescreening program. Rev Panam Salud Publica. 2011;30(5):408–414. [PubMed] [Google Scholar]
- 48.Rodriguez NM, Aguilar S. Prevalence of diabetic retinopathy in a clinic population from Puerto Rico. Optom Vis Sci. 2016;93(7):750–753. doi: 10.1097/OPX.0000000000000854. [DOI] [PubMed] [Google Scholar]
- 49.Varma R, Torres M, Peña F, Klein R, Azen SP. Prevalence of diabetic retinopathy in adult Latinos: the Los Angeles Latino eye study. Ophthalmology. 2004;111(7):1298–1306. doi: 10.1016/j.ophtha.2004.03.002. [DOI] [PubMed] [Google Scholar]