

Summary
Trafficking cells frequently transmigrate through epithelial and endothelial monolayers. How monolayers cooperate with the penetrating cells to support their transit is poorly understood. We studied dendritic cell (DC) entry into lymphatic capillaries as a model system for transendothelial migration. We find that the chemokine CCL21, which is the decisive guidance cue for intravasation, mainly localizes in the trans-Golgi network and intracellular vesicles of lymphatic endothelial cells. Upon DC transmigration, these Golgi deposits disperse and CCL21 becomes extracellularly enriched at the sites of endothelial cell-cell junctions. When we reconstitute the transmigration process in vitro, we find that secretion of CCL21-positive vesicles is triggered by a DC contact-induced calcium signal, and selective calcium chelation in lymphatic endothelium attenuates transmigration. Altogether, our data demonstrate a chemokine-mediated feedback between DCs and lymphatic endothelium, which facilitates transendothelial migration.
Keywords: dendritic cell, endothelium, transmigration, intravasation, lymphatic capillary, chemokine CCL21, triggered secretion, cell-cell contact
Graphical Abstract
Highlights
-
•
DC entry into lymphatic capillary induces CCL21 secretion to endothelial junctions
-
•
Chemokine CCL21 secretion is triggered by calcium fluxes
-
•
Direct contact by DC induces calcium signaling in LECs
-
•
Dynamic rather than pre-patterned chemokine CCL21 cues promote DC transmigration
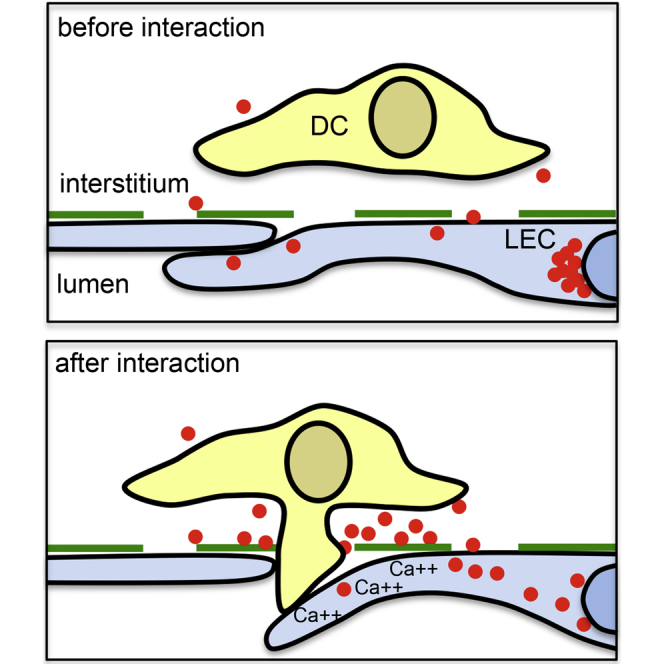
Antigen-presenting dendritic cells approach and enter lymphatic capillaries in a chemokine CCL21-dependent manner. Vaahtomeri et al. show that migrating dendritic cells trigger chemokine-mediated feedback via direct contact with lymphatic endothelia, which locally release CCL21 and thus promote transmigration.
Introduction
Endothelial and epithelial monolayers and their associated basement membranes form physical and functional barriers separating distinct tissue compartments. These barriers are frequently breached, e.g., by immune cells as part of their homeostatic or inflammatory trafficking, by tumor cells during metastatic spread, or during tissue reorganizations in development. Although such transmigration events do not follow one stereotypic pattern, certain mechanisms recur. First, often the migrating cell is guided toward the barrier by extracellular guidance cues such as chemokines. Second, adhesion of the migrating cell to the barrier is mediated by sequential cell-cell interactions, as exemplified in the leukocyte extravasation cascade (Reymond et al., 2013, Vestweber, 2015). Third, transmigration across the barrier usually occurs via entry portals, which may either be developmentally regulated (Nourshargh et al., 2010, Seifert and Lehmann, 2012) or induced by the migrating cell itself (Nourshargh et al., 2010, Vestweber, 2015).
Despite their apico-basal asymmetry, endothelia, and epithelia are often penetrated in both directions: e.g., neutrophils usually extravasate blood vessels from luminal to interstitial but can also transmigrate in the reversed direction (intravasation) (Woodfin et al., 2011). Likewise, tumor cells intravasate blood vessels upon leaving the primary tumor and extravasate to colonize distant organs (Reymond et al., 2013). Hence, rather than acting as pre-patterned gradients, which stereotypically guide the cells across the barrier, the directional cues governing transmigration might act locally and dynamically.
Lymphatic endothelial cells (LECs) of the lymphatic capillaries form a barrier for intravasating leukocytes and tumor cells. Dendritic cells (DCs) enter these vessels on their way from the periphery to the lymph nodes, where DCs activate lymphocytes as part of the adaptive immune response (Förster et al., 2008). DCs are guided from the interstitium toward the lymphatic capillaries by gradients of the chemokine CCL21 (Weber et al., 2013), which is homeostatically secreted by the LECs (Nakano and Gunn, 2001). After arrival at the lymphatic capillary, DCs penetrate the basement membrane (Pflicke and Sixt, 2009) and the LEC junctions (Baluk et al., 2007). The molecular mechanisms directing DCs into the vascular lumen, which we investigate here, are largely unclear.
Results and Discussion
CCL21 Is Mobilized upon Interactions between Dendritic Cells and Lymphatic Endothelia
DCs are attracted to the vicinity of lymphatic capillaries via gradients of CCL21 (Weber et al., 2013). Notably, CCL21 immunostainings in non-permeabilized tissues show a very faint interstitial signal compared to a strong signal localizing to LECs in permeabilized tissues (Johnson and Jackson, 2010, Tal et al., 2011, Weber et al., 2013). These depots are observed as perinuclear puncta (Johnson and Jackson, 2010, Weber et al., 2013), which co-stain for the Golgi marker GOLPH4 (Figure 1A) and disperse upon Golgi-endoplasmic reticulum (ER) disrupting Brefeldin A treatment (Weber et al., 2013). In addition to these trans-Golgi depots, CCL21 locates to intracellular vesicles (Figures 1A and S1A) (Johnson and Jackson, 2010), which might represent chemokine en route to homeostatic secretion or stores for “on demand” release. To test if intravasation of DCs changes CCL21 distribution, we layered in vitro-generated DCs on mouse ear explants. In this setup, DCs enter the tissue within minutes and migrate along gradients of interstitial CCL21 to ultimately intravasate into the dermal lymphatic vessels (Pflicke and Sixt, 2009, Weber et al., 2013, Weber and Sixt, 2013) (Figure 1B). In lymphatic capillaries, which had been entered by many DCs, we found that perinuclear CCL21 depots were dispersed and overall diminished (Figures 1C and 1D). This change in CCL21 distribution was not observed at sites where few DCs intravasated or in ears loaded with DCs deficient for the CCL21 receptor CCR7 (Figure S1B). Ccr7−/− DCs cannot read the interstitial CCL21 gradient and therefore do not interact with the lymphatic capillaries (Förster et al., 1999, Ohl et al., 2004, Weber et al., 2013).
Figure 1.

Dendritic Cell Entry into Mouse Dermal Lymphatic Capillaries Induces Mobilization of CCL21
(A) Mouse dermal lymphatic capillary stained for LYVE1 (green), GOLPH4 (red), CCL21 (white), and nuclei (DAPI, blue). Yellow arrows indicate co-localization of CCL21 and Golph4. Zoom-in of boxed area is shown below.
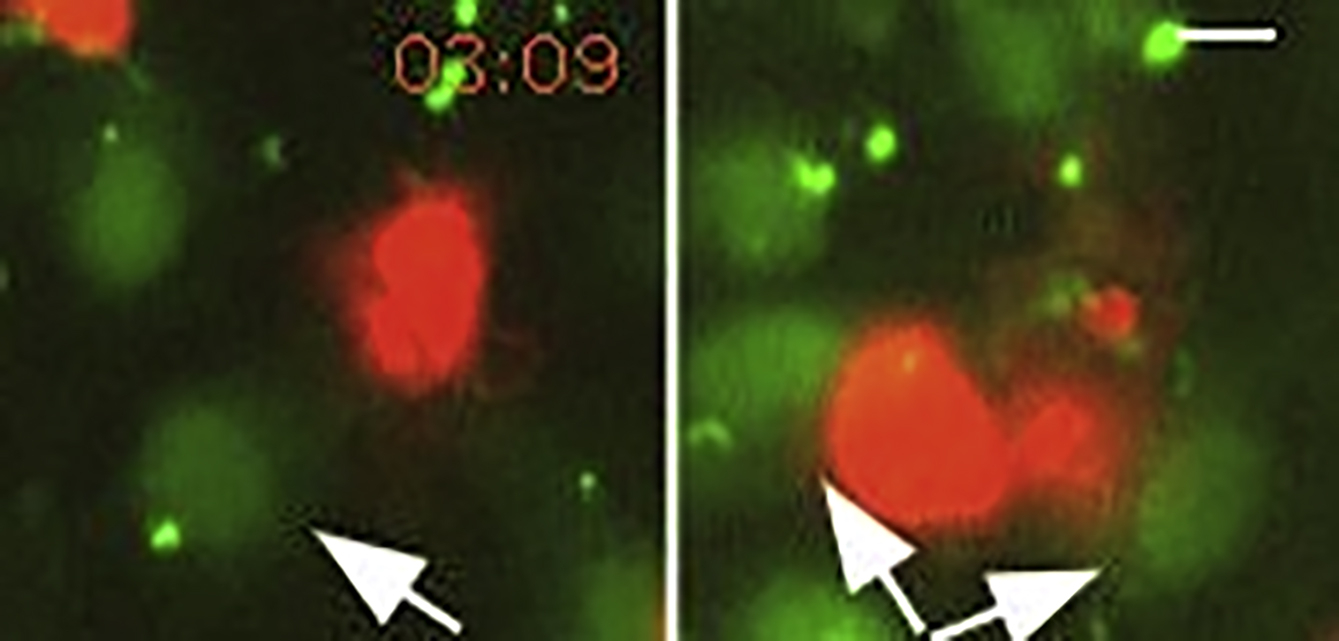
(B) TAMRA-labeled DCs (red) and LYVE1-stained lymphatic capillaries (green) after 3 hr 30′ invasion. Yellow lines indicate the plane of orthogonal section, and yellow arrow highlights a transmigration event.
(C) LYVE1 (green), CCL21 (white), and nuclei (DAPI, blue) of the ear dermis after 3 hr 30′ in presence or absence (control) of TAMRA-labeled DCs (red). Bottom image shows zoom-in of boxed area. White arrows indicate dispersion of CCL21 (yellow arrow in control).
(D) Dot blot graph shows ratio of signal in high intensity CCL21 depots to CCL21 in other areas of LECs. Columns represent mean values ± SD of control (n = 3) and + DC (n = 5) samples of ∼300 μm long lymphatic vessel stretches.
(E) Transmission electron micrograph of CCL21 staining of dermis. Black arrows indicate overlapping LEC tips at cell-cell junctions, yellow arrow detachment of LECs from interstitial extracellular matrix, white arrow rearrangement of collagen bundles, and blue arrow a silver-amplified CCL21 Immunogold label.
(F) Quantification of extracellular CCL21 staining at sites of DC-associated tissue alterations (see E) compared to intact area in same sample or sample devoid of DCs. Bar graph shows mean ± SD of two (–DC) and four (+DC) independent ear samples. Scale bars, 10 μm (A); 50 μm (B and C); 10 μm in zoom-in images; and 500 nm (E).
See also Figure S1.
To study whether mobilization of CCL21 upon DC intravasation was associated with extracellular CCL21 enrichment, we employed immunometal transmission electron microscopy. In line with the immunofluorescence analysis (Figure 1A), intracellular CCL21 was found enriched in the nuclear periphery (Figure S1C) and, more sparsely, in intracellular vesicles of control samples (Figure S1D). Extracellular CCL21 was mostly detected within 1 μm distance of the basolateral side of LECs with no evidence of CCL21 gradients extending from the basolateral to the luminal side of the LECs (Figure 1E). In samples exposed to DCs, local presence of DCs was associated with poorly organized interstitial collagen and partial detachment of the LECs from the interstitium (Figures 1E, S1E, and S1F). Importantly, these signatures of DC intravasation were associated with extracellular accumulations of basolateral, but not luminal, CCL21 (Figure 1E-1F). These accumulations were most prominent at LEC-LEC junctions of detached endothelia (Figure 1E), whereas sheer proximity of DCs seemed insufficient to discharge chemokine (Figure S1G). Based on these findings, we hypothesize that contact between DCs and LECs triggers acute CCL21 secretion. Triggered exocytosis of chemokine is reminiscent of exocytotic targeting of the adhesion molecule PECAM to areas of lymphocyte transmigration at the blood endothelium (Mamdouh et al., 2003). It might provide local guidance or act as a landmark for following DCs, which have been shown to intravasate with increased efficiency (MartIn-Fontecha et al., 2003).
CCL21 Leaves the Golgi Apparatus via Microtubules
To directly study CCL21 secretion, we established a traceable in vitro setup, where we lentivirally expressed variants of CCL21 in human dermal LECs, which recapitulated localization to the Golgi secretory pathway (compare Figures 2A and S1A) (de Jong et al., 2005, de Jong et al., 2008). Secretion of CCL21 into the cell culture supernatant was dependent on the N-terminal signaling peptide (Figures 2A and 2B). Surprisingly, exclusion of the CCL21ΔN-mCherry from the secretory pathway led to nuclear localization, possibly owing to a potential bipartite nuclear localizing signal in mature CCL21 (aa 21–50). The loss of the heavily cationic C terminus (CCL21ΔC) did not affect localization to the Golgi secretory pathway (Figure 2A) but instead prevented binding of CCL21 to the cell culture dish surface (Figure S2A) and lead to increased CCL21 in the cell culture supernatant (Figure 2B). This was in line with previous findings, showing that the C terminus immobilizes CCL21 to charged surfaces and glycosaminoglycans (Hirose et al., 2002).
Figure 2.

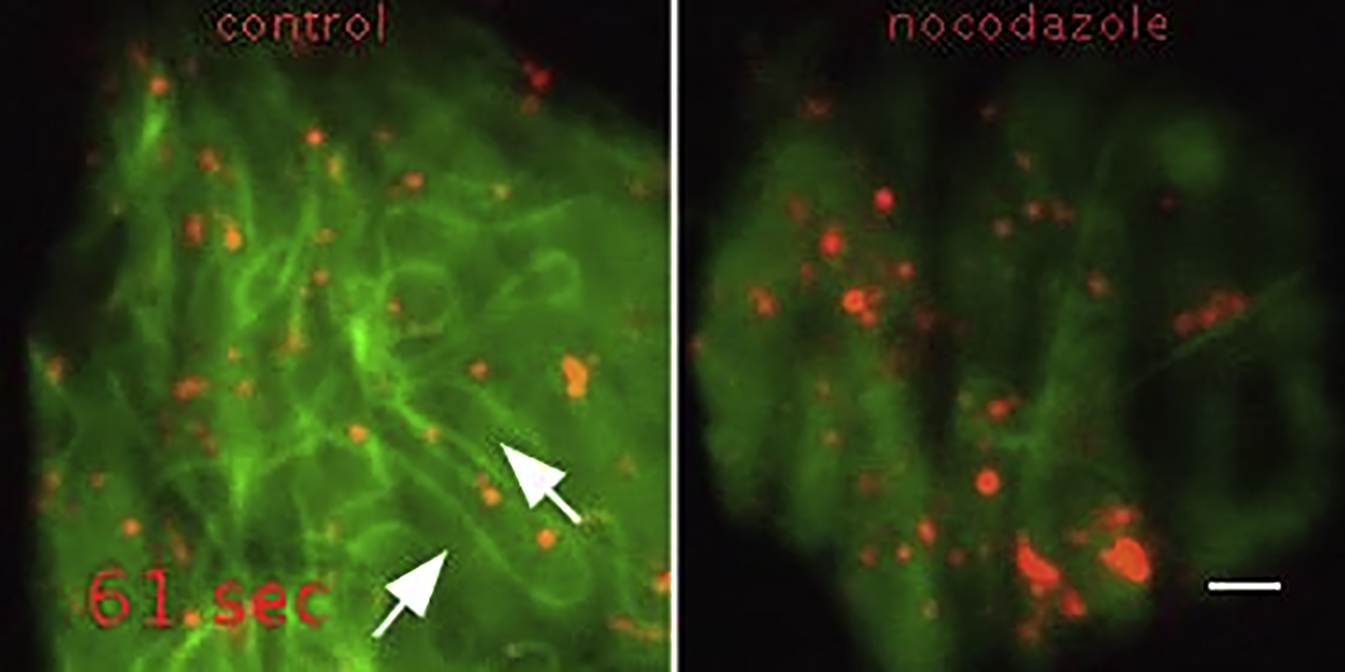
CCL21-Positive Vesicles Localize to Golgi-Secretory Pathway and Traffic along Microtubules
(A) Giantin (white) and nuclear staining (DAPI, blue) of CCL21-mCherry (red), CCL21ΔN-mCherry, or CCL21ΔC-mCherry expressing LECs. Insets show Golgi localized mCherry signal (yellow arrows) with or without staining of Golgi marker giantin.
(B) Quantification of mCherry intensities in supernatants of CCL21-mCherry, CCL21ΔN-mCherry, and CCL21ΔC-mCherry expressing LECs. Dot blot graph shows a mean ± SD of pooled data from two independent experiments, n = 4 for each construct. Intensities are normalized to media background, which is set as 1.
(C) Basolateral non-directed tracks of TIRF-imaged CCL21-mCherry-positive vesicles are indicated with white, directed tracks heading toward Golgi area with green, directed tracks toward cell periphery with red, the Golgi apparatus with a dashed yellow line, and the boundaries of cell contact surface with dashed white line. Yellow arrow indicates a white trajectory representing random movement within a confined area.
(D) TIRF imaging of CCL21ΔC-mCherry (red) and EGFP-tubulin-α (green) expressing primary LEC. White arrow highlights one CCL21ΔC-mCherry positive vesicle (red) throughout the image series. See Movie S1. Scale bars, 10 μm (A); 2 μm (C and D).
See also Figure S2.
To trace the intracellular trafficking routes of CCL21, we performed real-time total internal reflection fluorescence (TIRF) microscopy. Tracking of CCL21-mCherry-positive vesicles showed two modes of behavior: some vesicles rapidly advanced along linear trajectories, whereas others moved randomly within confined areas (Figure 2C). Linear tracks connected Golgi area and the LEC periphery (Figure 2C), matching the distribution pattern of microtubules (Figure S2B). Accordingly, CCL21 was microtubule-associated as revealed by immunostaining of untagged CCL21 and CCL21ΔC (Figure S2B) and live imaging of CCL21ΔC-mCherry (Figure 2D; Movie S1). Microtubule disruption by nocodazole abolished the component of directed movement (Movie S1) confirming that CCL21 is transported along microtubules, which is analogous to the transport of insulin in secretory pancreatic beta-cells (Boyd et al., 1982, Varadi et al., 2003). Similarly to insulin, some of the linear trajectories of CCL21 vesicles were directed toward the cell periphery and some toward the Golgi area, suggesting regulation of vesicle dwell time at the LEC periphery (Zhu et al., 2015).
CCL21 Secretion Is Regulated by Calcium and Cortical Actin
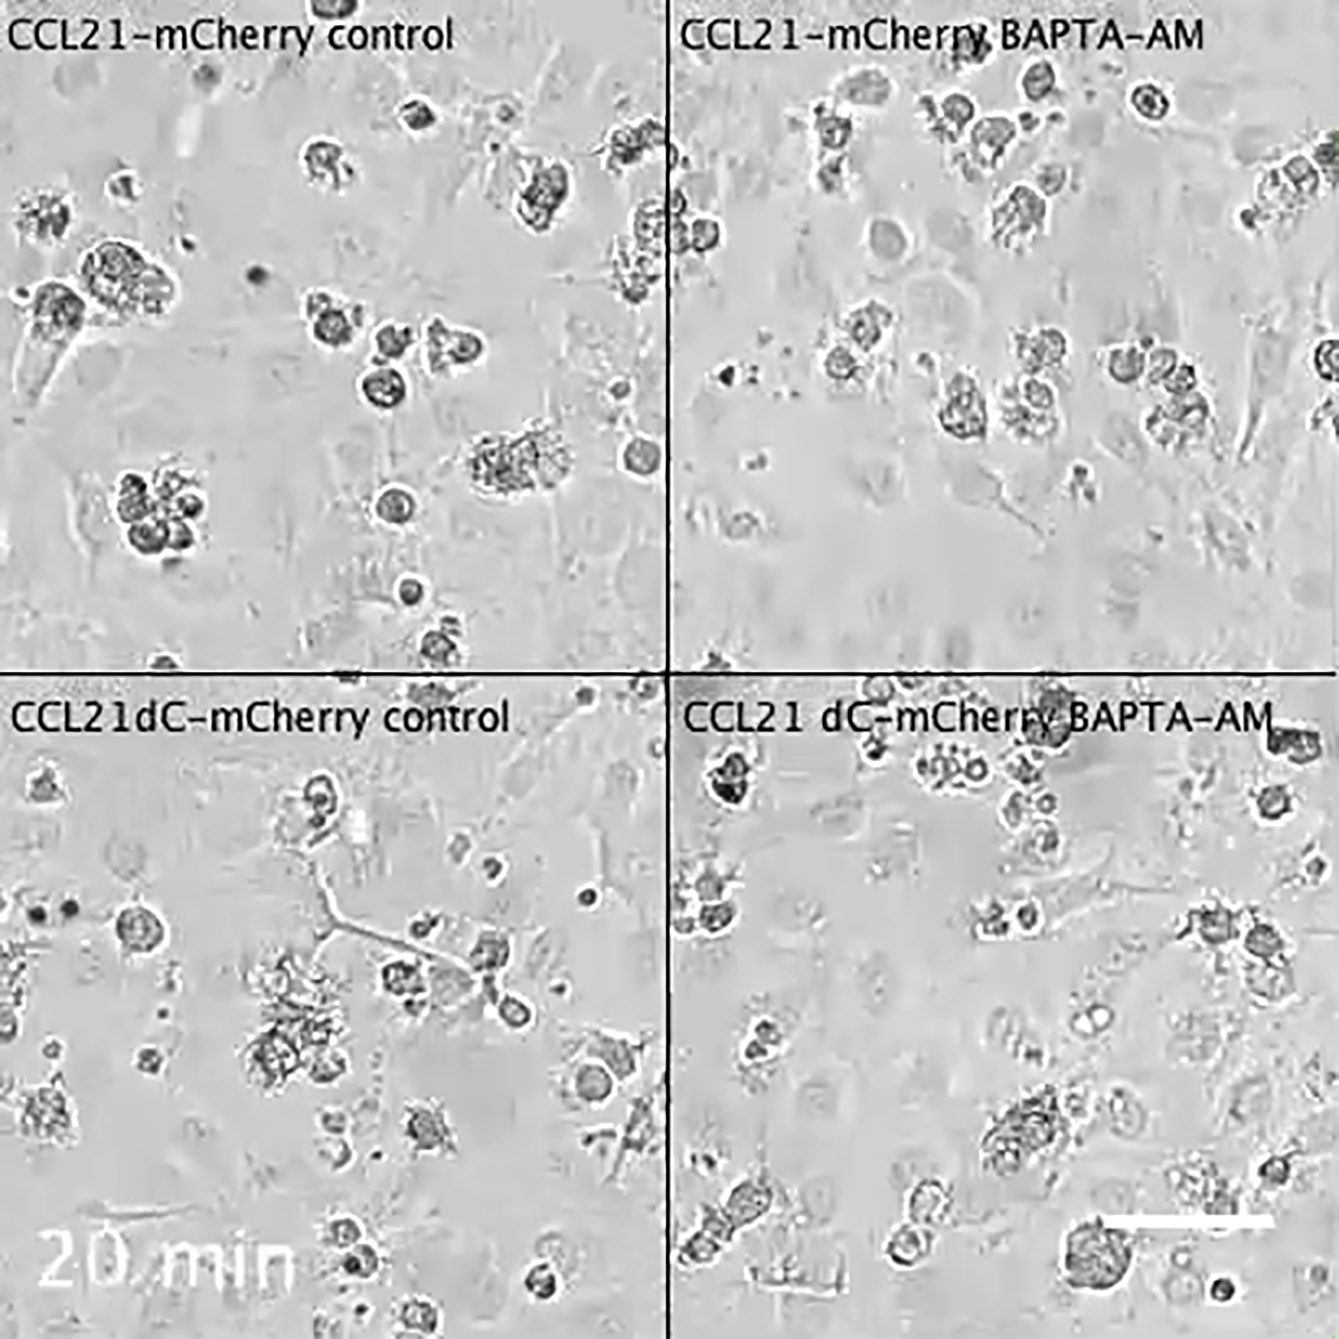
TIRF imaging revealed that occasionally CCL21-mCherry vesicles were discharged into the extracellular space. Regulated discharge of plasma membrane-docked vesicles is often initiated by calcium (Ca) binding to synaptotagmins, which triggers the actual membrane fusion event (Südhof, 2012). Accordingly, the Ca ionophore ionomycin triggered robust CCL21-mCherry and CCL21ΔC-mCherry secretion as directly observed with TIRF microscopy as a sudden and transient increase in CCL21 intensity (Figures 3A and 3D; Movie S2). Such flashes are due to the exponential increase in TIRF signal once the quantum of fluorescent probe enters the glass-water interface below the cell (Axelrod, 1981), which is then followed by rapid dilution of the radially diffusing probe. Bulk mCherry signal in the LEC culture supernatant was increased by ionomycin (Figure 3B). Further, basal secretion seemed at least partially dependent on Ca as chelation of intraendothelial Ca with BAPTA-AM causing a 30% reduction in CCL21ΔC-mCherry secretion (Figure 3C).
Figure 3.

Regulation of CCL21 Secretion
(A) TIRF microscopy of CCL21-mCherry vesicles (white) of a single LEC after addition of 5 μM ionomycin. Yellow arrows indicate vesicles at time point 0″, secretion events are highlighted by white arrows. Scale bar, 2 μm. See Movie S2.
(B) Quantification of mCherry intensities of CCL21ΔC-mCherry expressing LEC culture supernatant subsequent to 6′ control or 5 μM ionomycin treatment. Bar graph shows mean ± SD of pooled samples from 3 independent experiments, n = 5 (control) and 6 (ionomycin).
(C) Quantification of mCherry intensities of culture supernatants of CCL21ΔC-mCherry expressing LECs 4 hr after washout of 1 hr long control or 10 μM BAPTA-AM treatment. BAPTA-AM is a cell-permeant Ca chelator, which is trapped in cells and binds intracellular calcium via carboxylic acid functional groups thus severely decreasing intracellular-free calcium. Bar graph shows mean ± SD of pooled samples from three independent experiments, n = 7 for each condition. Intensities of (B) and (C) are normalized to media background, which is set as 1.
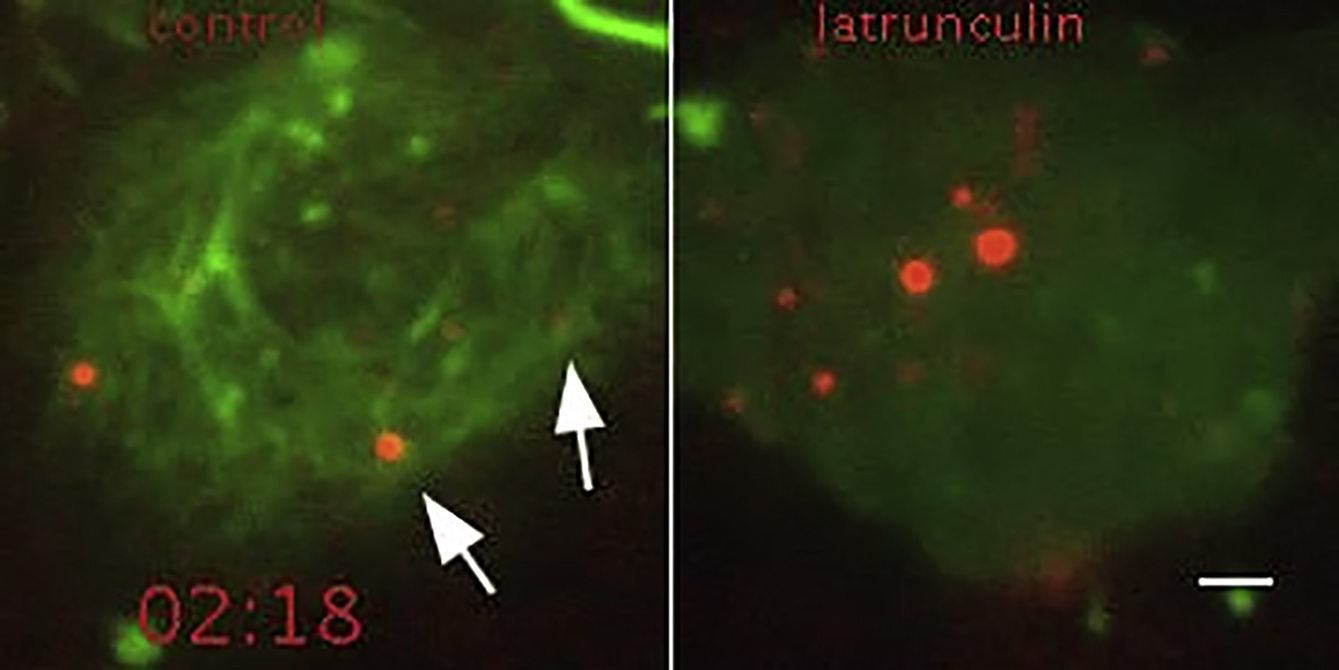
(D) Quantification of pooled data from all TIRF experiments on single vesicle secretion. Data points show secretion frequency in control, 5 μM ionomycin-, or 500 ng/mL latrunculin B-treated CCL21-mCherry or CCL21ΔC-mCherry expressing single LECs as indicated in the figure. The dot blot graph shows mean ± SD secretion frequency in pooled data of single cells from 6 independent experiments, cell number (n) is indicated in the figure.
(E) Data points show CCL21-mCherry vesicle speed, displacement, and duration in the TIRF imaging plane (basolateral membrane) in control and 13 latrunculin B (500 ng/mL)-treated single LECs, which displayed highest CCL21 secretion (see Figure 3D latrunculin B column). The dot blot graph shows mean ± SD of vesicle tracks (51–513/cell) in pooled data of single cells (n = 12 for control and 13 for latrunculin B) of three independent experiments. See Movie S3.
Ionomycin did not trigger secretion of all plasma membrane-associated vesicles (Movie S2). Some of these vesicles might not be plasma membrane-docked, but rather sequestered within the cortical actin meshwork, which has to be penetrated before the vesicles can directly contact the membrane (Nakata and Hirokawa, 1992, Oheim and Stühmer, 2000, Giner et al., 2007). When we visualized the cortical actin meshwork of LECs with Lifeact-EGFP, lateral movements similar to that of CCL21-mCherry vesicles were apparent (Movie S3). Actin disassembly by latrunculin B substantially increased the frequency of secretion events (Figure 3D; Movie S3), likely because of enhanced contact between vesicles and secretory machinery. Accordingly, the LECs displaying latrunculin B-induced secretion showed increased movement of vesicles in the basolateral plane as well as in z-direction (revealed by disappearance of vesicles from the TIRF field) (Figure 3E; Movie S3). These results suggest that the cortical actin meshwork controls CCL21 secretion by restricting membrane-docking of vesicles.
DCs Induce Lymphatic Endothelial Ca Fluxes via Cell-Cell Contact
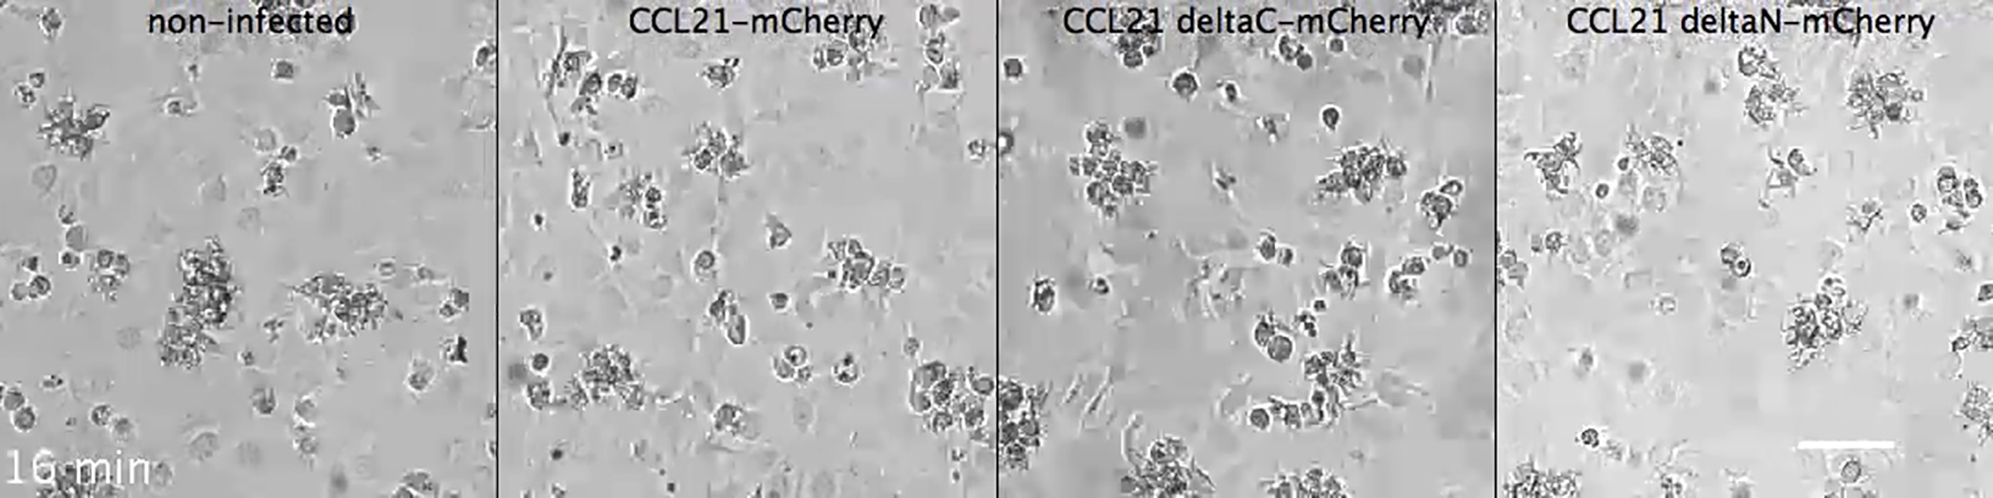
The finding that Ca influx triggers CCL21 secretion in LECs (Figures 3A, 3B, and 3D; Movie S2) together with our in situ finding that DCs cause release of CCL21 (Figures 1E and 1F) suggested that DC-LEC interactions might induce Ca signals in LECs similar to Ca signals in blood endothelia when being transmigrated by polymorphonuclear leukocytes (Huang et al., 1993). While Ca signaling can be induced in several ways, we were struck by our in situ observation of DCs probing LECs with a blunt foot-like processes (Figures 4A and 4B), which were reminiscent of lymphocyte processes physically penetrating blood endothelium (Carman et al., 2007, Shulman et al., 2011). DC protrusions considerably deformed LECs and even detached them locally from the underlying extracellular matrix (Figures 4A, 4B, S1E, and S1F). This suggested that DCs exert pushing forces on LECs, which might promote communication via extended cell-cell contacts. To investigate whether direct interaction was required for Ca signals, LECs were grown to confluency, and DCs were layered on top. In this setting, DCs effectively transmigrated the monolayer (Maddaluno et al., 2009) as revealed by phase contrast live cell imaging (Figure 4C; Movie S4). Transmigration was dependent on the secretion of CCL21, as non-infected or CCL21ΔN-mCherry-infected LECs were only occasionally penetrated by DCs (Figure S2D; Movie S4). Importantly, DCs interacting with the apical side of LECs and DCs in transit through the monolayer induced an increase in Ca concentration in LECs as revealed by time-lapse imaging of a Ca sensor (Figure 4D; Movie S5). At the population level, LECs showed a low basal frequency of Ca transients, which was increased 4.5-fold upon addition of DCs (Figure 4E). Unlike DCs, DC-conditioned media did not induce an increase in Ca concentration (Figure 4E) excluding a major role for secreted factors. Further, pre-treatment of DCs with Mycalolide B, an irreversible actin depolymerizing agent (Hori et al., 1993, Saito et al., 1994), which prevents formation of actin-based cell protrusions, did not abolish Ca transients (Figure 4E). These results suggest that molecular engagements at the DC-LEC interface are sufficient triggers. Earlier, DC expressed β2 integrins (LFA-1) and its lymphatic endothelial ligand ICAM have been shown to be necessary for in vivo and in vitro transmigration of inflamed but not homeostatic endothelia, where ICAM is not expressed (Johnson et al., 2006, Johnson and Jackson, 2010, Vigl et al., 2011, Teijeira et al., 2013). Accordingly, β2 integrins were dispensable for the DC entry into the dermal lymphatic capillaries as shown before (Figure S2E) (Lämmermann et al., 2008). At sites of intravasated β2 deficient (Itgb2−/−) DCs, CCL21 depots were dispersed from Golgi similar to wild-type DC samples (Figures S2E and S2F). Thus, other molecular interactions at the DC-LEC interface, such as the plexin1A-semaphorin3A axis (Takamatsu et al., 2010), L1 (Maddaluno et al., 2009), or yet unidentified factors might trigger the signal.
Figure 4.

Endothelial Ca Signaling Facilitates DC Transmigration In Vitro
(A) Transmission electron micrograph at a site of DC-LEC interaction at ear dermis lymphatic capillary. Black line indicates thinning of endothelial cell at site of interaction. Interstitium (I), lumen (L), LEC, and DC are marked.
(B) Immunoelectron micrograph of whole mount preparation labeled for CCL21 (silver amplified gold particles) at a site of DC-LEC interaction in ear dermis. The yellow arrows in (A) and (B) indicate the endothelial detachment from interstitium.
(C) Phase contrast imaging of an in vitro transmigration event from the apical to basolateral side of the LEC monolayer. White arrow points at leading edge, yellow arrow at cell body, and blue arrow at trailing edge of transmigrating DC. See Movie S4.
(D) Epifluorescence imaging of Oregon Green BAPTA-AM-treated LECs (green) and TAMRA-labeled DCs (red). Blue arrow indicates DC leading edge and yellow arrow LEC displaying a transient Ca peak upon DC contact. Below the image, the kymograph and the corresponding line graph of the Oregon green BAPTA-AM intensity in the LEC (highlighted with yellow arrow) are shown. See Movie S5.
(E) Quantification of LECs displaying Ca peaks upon addition of fresh media, DCs, DC-conditioned media, or Mycalolide B-treated DCs. Dot blot graph shows mean ± SD of pooled samples. Fresh media and DC samples represent eight independent experiments (n = 18 and 19, respectively), of which two experiments included Mycalolide B-treated DCs (n = 6), and three experiments included conditioned media samples (n = 4). Data are normalized to average of DCs sample, which is set as 1.
(F) Quantification of DC transmigration on control or 10 μM BAPTA-AM (B-AM)-treated CCL21-mCherry or CCL21ΔC-mCherry expressing monolayers. Dot blot graph shows mean ± SD of pooled samples from three independent experiments, n = 7 for BAPTA-AM-treated CCL21ΔC-mCherry expressing LECs and eight for all other conditions. Data are normalized to average of controls, which is set as 1. See Movie S6.
(G) Schematic of DC-induced Ca influx and CCL21 secretion. Scale bars, 500 nm (A and B); 50 μm (C); and 10 μm (D).
See also Figure S2.
DC-Stimulated Lymphatic Endothelial Ca Fluxes Facilitate Transendothelial Migration
To directly investigate whether lymphatic endothelial Ca signaling was necessary for the transendothelial migration of DCs, we selectively chelated endothelial Ca with BAPTA-AM. We compared the responses to both CCL21-mCherry and CCL21ΔC-mCherry, because full-length CCL21-mCherry accumulates on the cell culture dish surface (Figure S2A), which is not seen in vivo (Figure 1E). Thus, we presumed that the truncated chemokine more faithfully mimics the in vivo situation. Both CCL21-mCherry and CCL21ΔC-mCherry supported transmigration but Ca chelation reduced the number of transmigration events only in CCL21ΔC-mCherry expressing monolayers (62.4% reduction, Figure 4F; Movie S6), which lack the unphysiological accumulation of CCL21 (see Figure S2A) and thus lack a prepatterned CCL21 gradient across the monolayer (similarly to the tissue context, Figure 1E). These results suggest that DCs induce a transient Ca signal in LECs, which triggers acute CCL21 secretion and possibly enables opening of the endothelial junctions, as described for blood endothelia (Huang et al., 1993).
Although the decisive role of chemokines in leukocyte extravasation is well established, it has remained unclear if and how chemokines act during the actual transmigration process. Our finding that CCL21 is acutely secreted upon contact between DCs and LECs extend data by Shulman et al. (2011), which suggested that the chemokine CCL2 is released by blood endothelia in response to interactions with extravasating lymphocytes. While we show that a direct DC-LEC contact is sufficient to trigger chemokine release even in the absence of cytoskeletal force generation (Figure 4E), we found that applying mechanical pushing forces on LECs, and thus increasing LEC plasma membrane tension (Apodaca, 2002), can also trigger Ca flux and CCL21 release in vitro (Figures S2G–S2I). This was in line with the observation that transmigrating DCs considerably deformed LECs in dermal tissue (Figures 4A and 4B) and might suggest that molecular and mechanical triggers perpetuate the intravasation process in concert.
Earlier, long range CCL21 gradients were shown to guide DCs to the vicinity of lymphatic vessels (Weber et al., 2013). However, LEC penetration could not be explained by a simple concentration gradient across the endothelium as intra-luminal CCL21 concentrations are lower than those on the abluminal basement membrane (Weber et al., 2013, Russo et al., 2016). The acute chemokine release that we demonstrate exposes the leading edge of DCs to a burst of very steep CCL21 gradient, which will likely “motivate” the cell to locally push into the endothelium. At sites of loose button-like LEC-LEC junctions (Baluk et al., 2007), physical pushing might open the junction and allow entry from the confined interstitial environment into the lymphatic capillary lumen where physical resistance is lower (Figure 4G). In addition, local chemokine release might boost transmigration by attracting more transmigrating cells toward the specific entry portal, or provide local guidance and thereby determine the actual site of penetration. Taken together, our data show that the barrier cells take a more active role in their penetration than previously anticipated.
Experimental Procedures
Mice
Wild-type C57BL/6J (Charles River Laboratories), Ccr7−/− (Förster et al., 1999) and Itgb2−/− (Wilson et al., 1993) male and female mice were bred and maintained according to the local rules (Institutional Review Board approval 66018/3-II/3b/2010). Mice were sacrificed at the age of 6–8 weeks for the ear preparation and at the age of 8–12 weeks for the bone marrow extraction.
Ear Sheet Preparation and Explant DC Intravasation Assay
Ears of sacrificed mice were prepared as previously described (Weber et al., 2013). Ear sheets were fixed with 4% paraformaldehyde (PFA) in PBS at room temperature for 25′ or prepared for the DC lymphatic capillary intravasation assay as follows: the ventral half of the ear was mounted between a 0.5 mL microcentrifuge tube lid and the body of the tube, of which the lower part was cut off. The 1.5 cm2 well formed by the cut tube was filled with 200 μL of R10 with or without 50,000 (Figures 1B–1F) or 100,000 (Figures S2E and S2F) TAMRA-labeled DCs. Unattached DCs were washed off with R10 after 30′ incubation at +37°C and 5% CO2 and incubated in R10 for additional 1–3 hr (Figures 1B–1F). As Itgb2−/− DCs are slower in invading ear explants, Itgb2−/− DCs and wild-type controls were kept on the ear explants for 7 hr (i.e., for the whole duration of the experiment) (Figures S2E and S2F). The experiments were terminated by washing the ear once with PBS followed by fixation with 4% PFA in PBS at room temperature for 25′.
CCL21 Quantification in Transmission Electron Microscopy
For the quantification of extra-LEC CCL21, we used two independent samples devoid of DCs (control) and four independent samples with DCs (+DCs). Each sample contained two to five lymphatic vessels. All extracellular CCL21-immunometal particles within 1 μm distance to the interstitial (basolateral) side of the lymphatic vessel endothelial cell were quantified. The particles were classified based on their location either in the intact area or in the area displaying DC-associated tissue alterations (i.e., disorganized collagen bundles and/or local detachment of LECs from the interstitial extracellular matrix). Finally, the particle number was normalized to the corresponding endothelial length.
Measurements of mCherry Signals of the Culture Supernatant
The bulk secretion of CCL21 was measured by analyzing mCherry intensities in the culture supernatant. To measure the amounts of CCL21-mCherry, CCL21ΔN-mCherry, and CCL21ΔC-mCherry (Figure 2B), culture supernatant was collected 48 hr after full confluency of the LEC culture and the last media change. For the experiments shown in Figure 3, we used CCL21ΔC-mCherry because it has low affinity to culture substrate (Figure S2A), and the changes in secretion should be immediately reflected in the mCherry intensity in the supernatant. Here, culture supernatant was collected subsequent to 6′ 5 μM ionomycin (Molecular Probes), 4 hr after washout of 1 hr 10 μM BAPTA-AM (Life Technologies, B6769) treatment or corresponding control (DMSO) treatments. Results were normalized to the background fluorescence of the MV2 culture media. For the information on measurement and quantification (Figure 2B), see the Supplemental Experimental Procedures.
Live TIRF Imaging of CCL21-mCherry-Positive Vesicles
Ionomycin (final concentration 5 μM, Molecular Probes) was added to the CCL21-mCherry expressing LECs and imaging was started 10 s later whereas latrunculin B (500 ng/mL, Merck Millipore 428020) and nocodazole (500 nM, Sigma, m1404) were added on the LECs 30′ prior to imaging. Vesicle tracks were analyzed with Imaris (Bitplane). Averages of all the tracks/cell, which lasted for longer than 2.5 s, are shown in Figure 3E. The basolateral secretion events were quantified from acquired movies by using FiJi software. Only events in which the vesicles were observed prior to the “flash” and vesicle-like signal was severely decreased or totally absent after the flash were quantified as a secretion event (Figure 3D).
In Vitro DC Transmigration Assay
Activated DCs were centrifuged (300RCF, 5′) and resuspended in MV2 (Promocell) culture media. A total of 40,000 DCs (CCL21ΔC-mCherry monolayers; Figures 4F and S2D; Movie S4) were added on 1.5 cm2 well of days 4–5 confluent LECs. Due to more efficient transmigration of DCs on CCL21-mCherry monolayers in comparison to CCL21ΔC-mCherry monolayers, DC number was reduced to 25,000 for Figure 4F CCL21-mCherry monolayers. The acquired movies were quantified for the number of DCs beneath the monolayer at 1 hr for CCL21-mCherry or at 3 hr for CCL21ΔC-mCherry expressing LEC monolayers (Figure 4F; Movie S6). For quantification of transmigration efficiency on non-infected or CCL21-mCherry full-length or mutant construct expressing LEC monolayers (Figure S2D), a percentage of transmigrated DC of all DCs was determined.
LEC Ca Sensor Assays
For the Ca-sensor assays, fresh media, DC-conditioned media, or either TAMRA-labeled non-treated or Mycalolide B-treated DCs were carefully added on LEC monolayers treated for 50′ with 10 μM Oregon Green BAPTA-AM. The time-lapse imaging was started after 10′. For the cell population analysis (Figure 4E), imaging lasted for 10′ and the number of LECs displaying transient Ca peaks was quantified from acquired videos. All the Ca sensor experiments were carried out in the absence of serum or added growth factors. See the Supplemental Experimental Procedures for detailed protocol.
Statistics
Prism5 and Prism6 software (GraphPad softwares) was used to test the normality of the data (D’Agostino and Pearson omnibus normality test or Kolmogorov-Smirnov normality test) and for subsequent parametrical t test (two-tailed with Welch’s correction) or non-parametrical Mann-Whitney tests. Figure legends indicate number of independent experiments and biological replicates (n) used for statistical analysis.
Other Procedures
Generation and labeling of DCs, ear sheet staining, preparation of transmission electron microscopy samples, construction of lentiviral expression plasmids, virus production, LEC culture and infections, LEC staining, microscopy setups, mechanical pushing of the LECs, image analysis, and identification of putative nuclear localizing signal in CCL21 are outlined in the Supplemental Experimental Procedures.
Author Contributions
K.V. and M.S. conceived experiments and wrote the manuscript. K.V., M.B., R.H., I.D.V., M.M., and W.A.K. performed experiments. W.A.K. directed design of electron microscopy experiments. A.F.L. provided lentiviral LifeAct plasmid and dendritic cell cultures. K.V. analyzed the data. K.V. and R.H. performed Imaris analysis. R.H. wrote image analysis scripts.
Acknowledgments
We thank Tea Vallenius and Matyas Fendrych for critical reading of the manuscript. This work was supported by a Sigrid Juselius Foundation fellowship (K.V.), a post-doctoral research grant from the Academy of Finland (287853 to K.V.), by the European Research Council (ERC GA 281556 to M.S.), and by the Austrian Science Foundation (FWF) (Y564-B12 START award to M.S.).
Published: May 2, 2017
Footnotes
Supplemental Information includes Supplemental Experimental Procedures, two figures, and six movies and can be found with this article online at http://dx.doi.org/10.1016/j.celrep.2017.04.027.
Contributor Information
Kari Vaahtomeri, Email: kari.vaahtomeri@helsinki.fi.
Michael Sixt, Email: sixt@ist.ac.at.
Supplemental Information
Time-lapse TIRF microscopy of control or 500nM nocodazole treated CCL21ΔC-mCherry (red) and EGFP-tubulin α (green) expressing LEC. Frames were recorded every 1’’. White arrows indicate 2 examples of CCL21-mCherry positive vesicle gliding along a microtubule at 36’’ and 98’’. See Figure 2D. Scale bar is 2μm.
Timelapse TIRF microscopy of 5μM ionomycin treated CCL21-mCherry (white) expressing single LEC. Frames were recorded every 0.05’’. White arrows indicate 4 secretion events at 1, 2, 3 and 4 seconds. See Figure 3A. Scale bar is 2 μm.
Time-lapse TIRF microscopy of CCL21-mCherry (red) and Lifeact-EGFP (green) expressing control or 500ng/ml latrunculin B treated LEC. White arrows indicate CCL21-mCherry vesicles, which move similarly to 30 cortical actin meshwork (green). Frames were recorded every 0.5’’. Scale bar is 2μm.
Time-lapse phase contrast microscopy of DCs layered on non-infected or CCL21-mCherry, CCL21ΔC-mCherry or CCL21ΔN-mCherry expressing LECs. Frames were recorded every 20’’. Every second frame is shown in the video. See Figure S2D for quantification. Scale bar is 50μm.
Time-lapse epifluorescence microscopy of 10μM Oregon Green BAPTA-AM treated LEC monolayer (green) and either approaching (red, video on the left) or transmigrating DC (video on the right). Frames were recorded every 2.2’’. White arrows indicate LECs displaying Ca transients. See Figure 4D. Scale bar is 10μm.
Time-lapse phase contrast microscopy of DCs layered on control or 10μM BAPTA-AM treated CCL21-mCherry or CCL21ΔC-mCherry expressing LEC monolayers. Frames were recorded every 20’’. See Figure 4F. Scale bar is 50μm.
References
- Apodaca G. Modulation of membrane traffic by mechanical stimuli. Am. J. Physiol. Renal Physiol. 2002;282:F179–F190. doi: 10.1152/ajprenal.2002.282.2.F179. [DOI] [PubMed] [Google Scholar]
- Axelrod D. Cell-substrate contacts illuminated by total internal reflection fluorescence. J. Cell Biol. 1981;89:141–145. doi: 10.1083/jcb.89.1.141. [DOI] [PMC free article] [PubMed] [Google Scholar]
- Baluk P., Fuxe J., Hashizume H., Romano T., Lashnits E., Butz S., Vestweber D., Corada M., Molendini C., Dejana E., McDonald D.M. Functionally specialized junctions between endothelial cells of lymphatic vessels. J. Exp. Med. 2007;204:2349–2362. doi: 10.1084/jem.20062596. [DOI] [PMC free article] [PubMed] [Google Scholar]
- Boyd A.E., 3rd, Bolton W.E., Brinkley B.R. Microtubules and beta cell function: effect of colchicine on microtubules and insulin secretion in vitro by mouse beta cells. J. Cell Biol. 1982;92:425–434. doi: 10.1083/jcb.92.2.425. [DOI] [PMC free article] [PubMed] [Google Scholar]
- Carman C.V., Sage P.T., Sciuto T.E., de la Fuente M.A., Geha R.S., Ochs H.D., Dvorak H.F., Dvorak A.M., Springer T.A. Transcellular diapedesis is initiated by invasive podosomes. Immunity. 2007;26:784–797. doi: 10.1016/j.immuni.2007.04.015. [DOI] [PMC free article] [PubMed] [Google Scholar]
- de Jong E.K., Dijkstra I.M., Hensens M., Brouwer N., van Amerongen M., Liem R.S.B., Boddeke H.W.G.M., Biber K. Vesicle-mediated transport and release of CCL21 in endangered neurons: a possible explanation for microglia activation remote from a primary lesion. J. Neurosci. 2005;25:7548–7557. doi: 10.1523/JNEUROSCI.1019-05.2005. [DOI] [PMC free article] [PubMed] [Google Scholar]
- de Jong E.K., Vinet J., Stanulovic V.S., Meijer M., Wesseling E., Sjollema K., Boddeke H.W.G.M., Biber K. Expression, transport, and axonal sorting of neuronal CCL21 in large dense-core vesicles. FASEB J. 2008;22:4136–4145. doi: 10.1096/fj.07-101907. [DOI] [PubMed] [Google Scholar]
- Förster R., Schubel A., Breitfeld D., Kremmer E., Renner-Müller I., Wolf E., Lipp M. CCR7 coordinates the primary immune response by establishing functional microenvironments in secondary lymphoid organs. Cell. 1999;99:23–33. doi: 10.1016/s0092-8674(00)80059-8. [DOI] [PubMed] [Google Scholar]
- Förster R., Davalos-Misslitz A.C., Rot A. CCR7 and its ligands: balancing immunity and tolerance. Nat. Rev. Immunol. 2008;8:362–371. doi: 10.1038/nri2297. [DOI] [PubMed] [Google Scholar]
- Giner D., López I., Villanueva J., Torres V., Viniegra S., Gutiérrez L.M. Vesicle movements are governed by the size and dynamics of F-actin cytoskeletal structures in bovine chromaffin cells. Neuroscience. 2007;146:659–669. doi: 10.1016/j.neuroscience.2007.02.039. [DOI] [PubMed] [Google Scholar]
- Hirose J., Kawashima H., Swope Willis M., Springer T.A., Hasegawa H., Yoshie O., Miyasaka M. Chondroitin sulfate B exerts its inhibitory effect on secondary lymphoid tissue chemokine (SLC) by binding to the C-terminus of SLC. Biochim. Biophys. Acta. 2002;1571:219–224. doi: 10.1016/s0304-4165(02)00232-5. [DOI] [PubMed] [Google Scholar]
- Hori M., Saito S., Shin Y.Z., Ozaki H., Fusetani N., Karaki H. Mycalolide-B, a novel and specific inhibitor of actomyosin ATPase isolated from marine sponge. FEBS Lett. 1993;322:151–154. doi: 10.1016/0014-5793(93)81557-g. [DOI] [PubMed] [Google Scholar]
- Huang A.J., Manning J.E., Bandak T.M., Ratau M.C., Hanser K.R., Silverstein S.C. Endothelial cell cytosolic free calcium regulates neutrophil migration across monolayers of endothelial cells. J. Cell Biol. 1993;120:1371–1380. doi: 10.1083/jcb.120.6.1371. [DOI] [PMC free article] [PubMed] [Google Scholar]
- Johnson L.A., Jackson D.G. Inflammation-induced secretion of CCL21 in lymphatic endothelium is a key regulator of integrin-mediated dendritic cell transmigration. Int. Immunol. 2010;22:839–849. doi: 10.1093/intimm/dxq435. [DOI] [PubMed] [Google Scholar]
- Johnson L.A., Clasper S., Holt A.P., Lalor P.F., Baban D., Jackson D.G. An inflammation-induced mechanism for leukocyte transmigration across lymphatic vessel endothelium. J. Exp. Med. 2006;203:2763–2777. doi: 10.1084/jem.20051759. [DOI] [PMC free article] [PubMed] [Google Scholar]
- Lämmermann T., Bader B.L., Monkley S.J., Worbs T., Wedlich-Söldner R., Hirsch K., Keller M., Förster R., Critchley D.R., Fässler R., Sixt M. Rapid leukocyte migration by integrin-independent flowing and squeezing. Nature. 2008;453:51–55. doi: 10.1038/nature06887. [DOI] [PubMed] [Google Scholar]
- Maddaluno L., Verbrugge S.E., Martinoli C., Matteoli G., Chiavelli A., Zeng Y., Williams E.D., Rescigno M., Cavallaro U. The adhesion molecule L1 regulates transendothelial migration and trafficking of dendritic cells. J. Exp. Med. 2009;206:623–635. doi: 10.1084/jem.20081211. [DOI] [PMC free article] [PubMed] [Google Scholar]
- Mamdouh Z., Chen X., Pierini L.M., Maxfield F.R., Muller W.A. Targeted recycling of PECAM from endothelial surface-connected compartments during diapedesis. Nature. 2003;421:748–753. doi: 10.1038/nature01300. [DOI] [PubMed] [Google Scholar]
- MartIn-Fontecha A., Sebastiani S., Höpken U.E., Uguccioni M., Lipp M., Lanzavecchia A., Sallusto F. Regulation of dendritic cell migration to the draining lymph node: impact on T lymphocyte traffic and priming. J. Exp. Med. 2003;198:615–621. doi: 10.1084/jem.20030448. [DOI] [PMC free article] [PubMed] [Google Scholar]
- Nakano H., Gunn M.D. Gene duplications at the chemokine locus on mouse chromosome 4: multiple strain-specific haplotypes and the deletion of secondary lymphoid-organ chemokine and EBI-1 ligand chemokine genes in the plt mutation. J. Immunol. 2001;166:361–369. doi: 10.4049/jimmunol.166.1.361. [DOI] [PubMed] [Google Scholar]
- Nakata T., Hirokawa N. Organization of cortical cytoskeleton of cultured chromaffin cells and involvement in secretion as revealed by quick-freeze, deep-etching, and double-label immunoelectron microscopy. J. Neurosci. 1992;12:2186–2197. doi: 10.1523/JNEUROSCI.12-06-02186.1992. [DOI] [PMC free article] [PubMed] [Google Scholar]
- Nourshargh S., Hordijk P.L., Sixt M. Breaching multiple barriers: leukocyte motility through venular walls and the interstitium. Nat. Rev. Mol. Cell Biol. 2010;11:366–378. doi: 10.1038/nrm2889. [DOI] [PubMed] [Google Scholar]
- Oheim M., Stühmer W. Tracking chromaffin granules on their way through the actin cortex. Eur. Biophys. J. 2000;29:67–89. doi: 10.1007/s002490050253. [DOI] [PubMed] [Google Scholar]
- Ohl L., Mohaupt M., Czeloth N., Hintzen G., Kiafard Z., Zwirner J., Blankenstein T., Henning G., Förster R. CCR7 governs skin dendritic cell migration under inflammatory and steady-state conditions. Immunity. 2004;21:279–288. doi: 10.1016/j.immuni.2004.06.014. [DOI] [PubMed] [Google Scholar]
- Pflicke H., Sixt M. Preformed portals facilitate dendritic cell entry into afferent lymphatic vessels. J. Exp. Med. 2009;206:2925–2935. doi: 10.1084/jem.20091739. [DOI] [PMC free article] [PubMed] [Google Scholar]
- Reymond N., d’Água B.B., Ridley A.J. Crossing the endothelial barrier during metastasis. Nat. Rev. Cancer. 2013;13:858–870. doi: 10.1038/nrc3628. [DOI] [PubMed] [Google Scholar]
- Russo E., Teijeira A., Vaahtomeri K., Willrodt A.-H., Bloch J.S., Nitschké M., Santambrogio L., Kerjaschki D., Sixt M., Halin C. Intralymphatic CCL21 Promotes Tissue Egress of Dendritic Cells through Afferent Lymphatic Vessels. Cell Rep. 2016;14:1723–1734. doi: 10.1016/j.celrep.2016.01.048. [DOI] [PubMed] [Google Scholar]
- Saito S., Watabe S., Ozaki H., Fusetani N., Karaki H. Mycalolide B, a novel actin depolymerizing agent. J. Biol. Chem. 1994;269:29710–29714. [PubMed] [Google Scholar]
- Seifert J.R.K., Lehmann R. Drosophila primordial germ cell migration requires epithelial remodeling of the endoderm. Development. 2012;139:2101–2106. doi: 10.1242/dev.078949. [DOI] [PMC free article] [PubMed] [Google Scholar]
- Shulman Z., Cohen S.J., Roediger B., Kalchenko V., Jain R., Grabovsky V., Klein E., Shinder V., Stoler-Barak L., Feigelson S.W. Transendothelial migration of lymphocytes mediated by intraendothelial vesicle stores rather than by extracellular chemokine depots. Nat. Immunol. 2011;13:67–76. doi: 10.1038/ni.2173. [DOI] [PubMed] [Google Scholar]
- Südhof T.C. Calcium control of neurotransmitter release. Cold Spring Harb. Perspect. Biol. 2012;4:a011353. doi: 10.1101/cshperspect.a011353. [DOI] [PMC free article] [PubMed] [Google Scholar]
- Takamatsu H., Takegahara N., Nakagawa Y., Tomura M., Taniguchi M., Friedel R.H., Rayburn H., Tessier-Lavigne M., Yoshida Y., Okuno T. Semaphorins guide the entry of dendritic cells into the lymphatics by activating myosin II. Nat. Immunol. 2010;11:594–600. doi: 10.1038/ni.1885. [DOI] [PMC free article] [PubMed] [Google Scholar]
- Tal O., Lim H.Y., Gurevich I., Milo I., Shipony Z., Ng L.G., Angeli V., Shakhar G. DC mobilization from the skin requires docking to immobilized CCL21 on lymphatic endothelium and intralymphatic crawling. J. Exp. Med. 2011;208:2141–2153. doi: 10.1084/jem.20102392. [DOI] [PMC free article] [PubMed] [Google Scholar]
- Teijeira A., Garasa S., Peláez R., Azpilikueta A., Ochoa C., Marré D., Rodrigues M., Alfaro C., Aubá C., Valitutti S. Lymphatic endothelium forms integrin-engaging 3D structures during DC transit across inflamed lymphatic vessels. J. Invest. Dermatol. 2013;133:2276–2285. doi: 10.1038/jid.2013.152. [DOI] [PubMed] [Google Scholar]
- Varadi A., Tsuboi T., Johnson-Cadwell L.I., Allan V.J., Rutter G.A. Kinesin I and cytoplasmic dynein orchestrate glucose-stimulated insulin-containing vesicle movements in clonal MIN6 β-cells. Biochem. Biophys. Res. Commun. 2003;311:272–282. doi: 10.1016/j.bbrc.2003.09.208. [DOI] [PubMed] [Google Scholar]
- Vestweber D. How leukocytes cross the vascular endothelium. Nat. Rev. Immunol. 2015;15:692–704. doi: 10.1038/nri3908. [DOI] [PubMed] [Google Scholar]
- Vigl B., Aebischer D., Nitschké M., Iolyeva M., Röthlin T., Antsiferova O., Halin C. Tissue inflammation modulates gene expression of lymphatic endothelial cells and dendritic cell migration in a stimulus-dependent manner. Blood. 2011;118:205–215. doi: 10.1182/blood-2010-12-326447. [DOI] [PubMed] [Google Scholar]
- Weber M., Sixt M. Humana Press; Totowa, NJ: 2013. Methods in Molecular Biology. [Google Scholar]
- Weber M., Hauschild R., Schwarz J., Moussion C., de Vries I., Legler D.F., Luther S.A., Bollenbach T., Sixt M. Interstitial dendritic cell guidance by haptotactic chemokine gradients. Science. 2013;339:328–332. doi: 10.1126/science.1228456. [DOI] [PubMed] [Google Scholar]
- Wilson R.W., Ballantyne C.M., Smith C.W., Montgomery C., Bradley A., O’Brien W.E., Beaudet A.L. Gene targeting yields a CD18-mutant mouse for study of inflammation. J. Immunol. 1993;151:1571–1578. [PubMed] [Google Scholar]
- Woodfin A., Voisin M.-B., Beyrau M., Colom B., Caille D., Diapouli F.-M., Nash G.B., Chavakis T., Albelda S.M., Rainger G.E. The junctional adhesion molecule JAM-C regulates polarized transendothelial migration of neutrophils in vivo. Nat. Immunol. 2011;12:761–769. doi: 10.1038/ni.2062. [DOI] [PMC free article] [PubMed] [Google Scholar]
- Zhu X., Hu R., Brissova M., Stein R.W., Powers A.C., Gu G., Kaverina I. Microtubules negatively regulate insulin secretion in pancreatic β cells. Dev. Cell. 2015;34:656–668. doi: 10.1016/j.devcel.2015.08.020. [DOI] [PMC free article] [PubMed] [Google Scholar]
Associated Data
This section collects any data citations, data availability statements, or supplementary materials included in this article.
Supplementary Materials
Time-lapse TIRF microscopy of control or 500nM nocodazole treated CCL21ΔC-mCherry (red) and EGFP-tubulin α (green) expressing LEC. Frames were recorded every 1’’. White arrows indicate 2 examples of CCL21-mCherry positive vesicle gliding along a microtubule at 36’’ and 98’’. See Figure 2D. Scale bar is 2μm.
Timelapse TIRF microscopy of 5μM ionomycin treated CCL21-mCherry (white) expressing single LEC. Frames were recorded every 0.05’’. White arrows indicate 4 secretion events at 1, 2, 3 and 4 seconds. See Figure 3A. Scale bar is 2 μm.
Time-lapse TIRF microscopy of CCL21-mCherry (red) and Lifeact-EGFP (green) expressing control or 500ng/ml latrunculin B treated LEC. White arrows indicate CCL21-mCherry vesicles, which move similarly to 30 cortical actin meshwork (green). Frames were recorded every 0.5’’. Scale bar is 2μm.
Time-lapse phase contrast microscopy of DCs layered on non-infected or CCL21-mCherry, CCL21ΔC-mCherry or CCL21ΔN-mCherry expressing LECs. Frames were recorded every 20’’. Every second frame is shown in the video. See Figure S2D for quantification. Scale bar is 50μm.
Time-lapse epifluorescence microscopy of 10μM Oregon Green BAPTA-AM treated LEC monolayer (green) and either approaching (red, video on the left) or transmigrating DC (video on the right). Frames were recorded every 2.2’’. White arrows indicate LECs displaying Ca transients. See Figure 4D. Scale bar is 10μm.
Time-lapse phase contrast microscopy of DCs layered on control or 10μM BAPTA-AM treated CCL21-mCherry or CCL21ΔC-mCherry expressing LEC monolayers. Frames were recorded every 20’’. See Figure 4F. Scale bar is 50μm.