

Abstract
Regulatory T (Treg) cells play a central role in immune tolerance and prevention of aberrant immune responses. Several studies have suggested that the risk of GVHD after allogeneic hematopoietic cell transplantation (HCT) can be ameliorated by increasing Tregs. We have developed an approach of in vivo expansion of Tregs with RGI-2001, a novel liposomal formulation of a synthetic derivative of alpha-galactosylceramide, a naturally occurring ligand that binds to CD1 and activates and expands invariant natural killer cells. In preclinical studies, a single intravenous infusion of RGI-2001 expanded Treg and could ameliorate GVHD in a mouse model of allogeneic HCT. To explore the role of RGI-2001 in clinical HCT, we initiated a Phase IIa clinical trial (n=29), testing two different doses of RGI-2001 administered as a single infusion on day 0 of allogeneic HCT. RGI-2001 was well tolerated and without infusion reactions or cytokine release syndrome. A subset of patients (8/29, 28%) responded to RGI-2001 by inducing a markedly increased number of cells with a Treg phenotype. The Treg had a high Ki-67 index and were almost exclusively Helios+ and Foxp3+, indicating that their accumulation was due to expansion of natural Treg. Notably, the incidence of grade 2–4 GVHD in the eight patients who responded to RGI-2001 was 12.5%, compared to 52.4% in the 21 patients who did not respond. No grade 3–4 GVHD was observed in the responder group, compared to a 9.5% incidence among nonresponders. Immunosuppression with sirolimus was also associated with a low incidence of GVHD, suggesting that RGI-2001 may have synergized with sirolimus to promote Treg expansion.
Introduction
Regulatory T (Treg) cells are CD4+ T cells that express the transcription factor FoxP3 and act to suppress the activation and function of other immune cells including conventional CD4+ and CD8+ T cells [1, 2]. These activities prevent autoimmunity but can also promote cancer growth. In the setting of hematopoietic cell transplant (HCT), allogeneic donor cells can attack host tissue and cause graft-versus-host disease (GVHD). Given the known role of Treg in immune suppression, various groups have studied their role in the reduction of GVHD. In murine studies, Treg protect against GVHD while in some cases preserving antitumor activity of allogeneic conventional T cells [3–7]. These results are supported by studies showing that the levels or activities of Treg are inversely correlated with GVHD development in humans [8–13]. The levels of Treg could also predict subsequent development of GVHD, as shown in a recent study where peripheral blood Treg above 9% of all CD4+ T cells during the first month after HCT correlated with a significantly decreased risk of acute GVHD (aGVHD) [14]. Similarly, unbalanced recovery of T-effector cells versus Treg contributed to the risk of chronic GVHD (cGVHD) [15]. Recently, Koreth et al [16] found that the percentage and number of peripheral blood Treg that were induced after treatment with low-dose interleukin 2 (IL-2) served as biomarkers of IL-2 responsiveness and amelioration of symptoms attributed to cGVHD. Several groups have demonstrated an apparent reduction in GVHD and retention of GVL effects after allogeneic HCT when Treg purified from donor leukapheresis products or expanded from umbilical cord blood were added to the graft [17–19].
By utilizing a murine model, we previously showed that GVHD could be effectively prevented with RGI-2001, a compound that activates invariant natural killer T (iNKT) cells [20]. RGI-2001 is a liposomal formulation of KRN7000, an alpha-galactosylceramide analog, embedded within the lipid bilayer to promote uptake by antigen presenting cells (APCs) and presentation by CD1d [21]. In animal models, iNKT cells promoted the activation and expansion of Treg, leading to suppression of alloreactive donor T cells [22–24]. Based on these animal studies, a phase I open label, multicenter, dose escalation study of a single dose RGI-2001 was conducted to evaluate the safety, tolerability, pharmacokinetics and pharmacodynamics of RGI-2001 in allogeneic HCT patients. Results of this study showed that RGI-2001 was well-tolerated and provided the impetus to initiate the current study.
We now report results from a Phase IIa clinical trial of single dose RGI-2001 on day 0 in the treatment of 29 patients undergoing allogeneic HCT. We show that some patients treated with RGI-2001 had markedly increased numbers of Treg (CD4+CD25+CD127loFoxp3+) within 1–3 weeks after HCT. The patients who responded with an increased number of Treg also had decreased GVHD compared to non-responders. Some of the patients in this subset received sirolimus for immunosuppression after HCT, suggesting potential synergy between sirolimus and RGI-2001 in Treg expansion.
Methods
Between December 2011 and December 2013, we conducted a phase 1 dose escalation study to determine the maximum tolerated dose (MTD) of a single intravenous infusion of RGI-2001, a liposomal formulation of KRN7000, a synthetic derivative of alpha-galactosylceramide (REGiMMUNE, Tokyo Japan), in unrelated allogeneic transplant patients. The clinical trial was an open label, multicenter, dose escalation study to evaluate the safety and tolerability of RGI-2001 (Clinicaltrials.gov NCT01379209). In Phase 1, a wide range of RGI-2001 doses were evaluated (0.001 μg/kg to 100 μg/kg). Although the maximum tolerated dose (MTD) was not established, biological effects were noted at doses 1 μg/kg and higher. Two dose levels were subsequently selected for further study. No cytokine release or dose-limiting toxicities (DLT) were observed in the phase 1 study.
The current data are taken from the subsequent Phase IIa trial in which 29 patients were randomized to receive either 1.0 μg/kg or 100 μg/kg of RGI-2001 approximately 30 minutes after completion of the donor cell infusion.
Patients
The patients included in this study were age >18 years old, had an Eastern Cooperative Oncology Group (ECOG) status of 0 to 2 or a Karnofsky Performance Status of > 60%, a reasonable expectation of at least 3 months of survival, aspartate and alanine aminotransferase levels < 2.0 times the upper limit of normal, bilirubin < 1.5 times the upper limit of normal, and a serum creatinine ≤ 2.0 mg/dl. The patients had the following diseases: acute myelogenous leukemia (AML) or acute lymphoblastic leukemia (ALL) in first or subsequent complete remission; T-or B-cell acute lymphoblastic leukemia, chronic myelogenous leukemia (CML), multiple myeloma with <20% plasma cells in the bone marrow, myelodysplastic syndrome with <10% bone marrow blasts; myeloproliferative disorders; aplastic anemia; and relapsed or refractory Hodgkin’s disease or non-Hodgkin’s lymphoma. Patients with hepatitis A, hepatitis B, hepatitis C or human immunodeficiency virus infection, any other active infections, prior use of anti-CD3 or anti-CD20 antibodies or anti-thymocyte globulin within 3 months before transplantation were excluded. The study was approved by the site Institutional Review Boards, and all subjects signed written informed consent.
Treatment protocol
Patients with hematologic malignancies were enrolled from January 2014 to April 2015 in five U.S. transplant centers. Each site used its institutional standard of care for conditioning regimens, GVHD prophylaxis and treatment. Monitoring and treatment of bacterial, viral, and fungal infections followed institutional standards. GVHD prophylaxis after the transplant required a calcineurin inhibitor with at least one other agent that could include methotrexate, sirolimus, or mycophenolate mofetil. RGI-2001 was administered intravenously at 1μg/kg or 100 μg/kg at 30 minutes after the donor cell infusion ended. Transplant donors were either HLA-matched or had no more than a single HLA allele or antigen mismatch at HLA-A, B, C or DRB1 but DQB1 was excluded. Clinical assessments for safety and engraftment were collected through day 30 after HCT.
Adverse events
All adverse events were graded according to the NCI Common Toxicity Criteria for Adverse Event (CTCAE), version 4.0 and reported up through day 30 after HCT.
Engraftment, relapse, and survival
Time to myeloid engraftment was collected, and patients were monitored through day 100 after HCT.
GVHD scoring of patients
Each site used the Modified Keystone Criteria for grading GVHD with Stage 0–4 with assessment of organ involvement (skin, liver or gastrointestinal tract), and an overall grade of GVHD as assessed by the site investigators. Acute GVHD was scored through day 100 after HCT. Disease relapse and death were competing risks for incidence of acute GVHD. Acute GVHD was diagnosed clinically by the treating physician and did not require biopsy of involved tissue nor central review. The incidences of acute GVHD were tabulated and historical published rates were used as reference comparison as the study did not have a well matched control cohort.
Laboratory analysis
Blood samples were collected and shipped to the University of California, San Diego for flow cytometric assessment of blood cell immunophenotypes. Complete blood counts (CBC) were drawn and measured locally at the site of enrollment. Data were collected and deposited into a centralized database for analysis. Whole blood samples were analyzed by flow cytometry to enumerate Treg cells (CD4+CD25hiCD127-/dull), iNKT cells (CD3+Vα24+humanCD1d:Tetramer+), Total NKT cells (CD3+CD56+CD69+), B cells (CD20+), and T cell subsets (CD3+CD4+ or CD3+CD8+) on day 0 before the infusion of RGI-2001 and on days 8, 15, 22, and 29 (or within 4 days of release from investigators care) after the infusion of RGI-2001 ended. All flow cytometry studies were performed within 48 hours after the blood draw. All antibodies were obtained from Biolegend (San Diego). For surface staining, 100 μl of whole blood was stained with antibodies directed towards CD3, CD4, CD8, CD25, CD127, CD20, CD56, CD16, and TCR Valpha24. 7-AAD was used to gate out dead cells.
FOXP3 and intracellular staining
For intracellular staining, peripheral blood was first separated on a ficoll gradient to isolate mononuclear cells (PBMCs). The PBMCs were washed and stained with antibodies (as listed above) before fixation and permeabilization with the use of the Cell Fixation and Permeabilization Kit for Intracellular Cytokine Staining from BD Biosciences. Intracellular antigens Foxp3, Helios, and Ki-67 were stained with the use of appropriate antibodies (Biolegend). Live cells were gated using FSC/SSC. Acquisition was performed by using FACSDiva and a FACSCanto II, and results were analyzed with the use of FlowJo software.
Definition of responder and non-responder cohorts
Analysis of the Treg percentage data revealed that there could be responder and non-responder cohorts. We chose 12% as a cutoff for responders based on an objective, blinded analysis of the data by the flow cytometrist. This cutoff was chosen without knowledge of the clinical characteristics of the cohorts. The clinical and demographic data were independently tabulated by the sponsor without knowing which patients showed a Treg response.
Results
Demographics
Twenty-nine patients were enrolled and were evaluable for adverse events and efficacy at 1.0 μg/kg (n=14) or 100 μ.g/kg (n=15). Table 1 shows the demographics of the patient population. The median age was 52 years (range 19–68 years) for both groups combined. The diagnoses varied, but most patients had acute leukemia or MDS (19 of 29 patients). Table 2 shows the conditioning regimens employed, GVHD prophylaxis and treatment characteristics of the patients according to the two doses of RGI-2001 tested. More patients received non-myeloablative or reduced intensity conditioning regimen in the 1.0 μg/kg dose cohort vs. the 100 μg/kg dose cohort (71.4% vs. 53.3%). All patients received a GVHD prophylaxis regimen that contained tacrolimus: either tacrolimus/methotrexate (19/29, 65.5%) or tacrolimus/sirolimus [8/29, 27.6%; with (1/8) or without (7/8) methotrexate]. Notably, more patients in the 1.0 μg/kg dose received sirolimus-based GVHD prophylaxis. Two patients (one in each group) received calcineurin inhibitor with methotrexate and steroids as GVHD prophylaxis.
Table 1.
Patient Characteristics at 1.0 μg/kg and 100 μg/kg of RGI-2001
| Characteristics | RGI-2001 1 μg/kg (n = 14) |
RGI-2001 100 μg/kg (n = 15) |
|---|---|---|
|
| ||
| Age | ||
| Median | 52.9 | 48.5 |
| Min, Max | 31, 68 | 19, 60 |
|
| ||
| Race | ||
| White | 14 (100%) | 12 (80%) |
| Black | – | 1 (6.7%) |
| Asian | – | 1 (6.7%) |
| Others | – | 1 (6.7%) |
|
| ||
| Gender | ||
| M | 11 (78.6%) | 11 (73.3%) |
| F | 3 (21.4%) | 4 (26.7%) |
|
| ||
| Diagnosis | ||
| AML | 5 (35.7%) | 7 (45.6%) |
| MDS | 5 (35.7%) | 2 (13.3%) |
| ALL | 1 (7%) | 1 (7%) |
| Myelofibrosis | 1 (7%) | 1 (7%) |
| NHL/MM | – | 1 (7%) |
| T-cell type leukemia | 1 (7%) | 1 (7%) |
| Other | 1 (7%) | 2 (13%) |
Table 2.
Treatment Characteristics at 1.0 μg/kg and 100 μg/kg of RGI-2001
| Characteristics | RGI-2001 1 μg/kg (n = 14) |
RGI-2001 100 μg/kg (n = 15) |
|---|---|---|
|
| ||
| Conditioning Regimen | ||
| Myeloablative | 4 (28.6%) | 7 (46.7%) |
| Reduced Intensity/Non myeloablative | 10 (71.4%) | 8 (53.3%) |
|
| ||
| GvHD Prophylaxis | ||
| CNI/MTX | 7 (50%) | 12 (80%) |
| CNI/MTX + steroids | 1 (7%) | 1 (7%) |
| CNI/Sirolimus | 6 (43%) | 2 (13%) |
|
| ||
| Graft Source | ||
| PBSC | 12 (85.7%) | 11 (80%) |
| Bone Marrow | 2 (14.3%) | 3 (20%) |
|
| ||
| HLA Matched | 11 (78.6%) | 14 (93.3%) |
|
| ||
| Donor Relationship | ||
| Unrelated | 11 (78.6%) | 9 (60.0%) |
| Related | 1 (7.1%) | 5 (33.3%) |
| Not specified by Site | 2 (14.3%) | 1 (6.7%) |
Safety summary
All of the subjects who received RGI-2001 in the study reported at least 1 treatment emergent adverse event (TEAE) during the protocol-specified reporting period. No cytokine reaction or infusion related reactions were observed. Table 3 shows related adverse events with diarrhea, nausea and peripheral edema being most common. The most frequently reported Grade 3 adverse events (not shown) were febrile neutropenia (11/29 subjects, 37.9%), mucosal inflammation (mucositis) (9/29 subjects, 31.0%), hypertension (7/29 subjects, 24.1%), and diarrhea (6/29 subjects, 20.7%) regardless of causality. A total of 2 subjects (2/29 subjects, 6.9%) reported Grade 4 adverse events, with sepsis in 1 subject [100 μg/kg group], and septic shock and respiratory failure in another subject [100 μg/kg group]). A total of 11 serious adverse events were reported regardless of causality within the first 30 days after HCT. These included sinusoidal obstructive syndrome (4), diarrhea (2), atrial fibrillation (1), EBV infection (1), respiratory failure (1) and febrile neutropenia (1), esophagitis (1).
Table 3.
Summary of Treatment-Emergent Related Adverse Events Reported by ≥ 10% of Subjects in the RGI-2001
| RGI-2001 1.0 μg/kg N=14 n (%) |
RGI-2001 100 μg/kg N=15 n (%) |
All Subjects RGI-2001 N=29 n (%) |
|
|---|---|---|---|
| Subjects with any TEAE | 14 (100.0) | 15 (100.0) | 29 (100.0) |
| Cardiac disorders | |||
| Tachycardia | 2 (14.3) | 1 (6.7) | 3 (10.3) |
| Gastrointestinal disorders | |||
| Diarrhea | 3 (21.4) | 1 (6.7) | 4 (13.8) |
| Nausea | 3 (21.4) | 1 (6.7) | 4 (13.8) |
| Vomiting | 0 (0) | 2 (13.3) | 2 (6.9) |
| General disorders and administration site conditions | |||
| Edema peripheral | 3 (21.4) | 1 (6.7) | 4 (13.8) |
| Investigations | |||
| Alanine aminotransferase increased | 2 (14.3) | 0 (0) | 2 (6.9) |
| Aspartate aminotransferase increased | 3 (21.4) | 0 (0) | 3 (10.3) |
| Blood bilirubin increased | 3 (21.4) | 0 (0) | 3 (10.3) |
| Musculoskeletal and connective tissue disorders | |||
| Dizziness | 1 (7.1) | 2 (13.3) | 3 (10.3) |
| Nervous system disorders | |||
| Headache | 1 (7.1) | 2 (13.3) | 3 (10.3) |
Hematopoetic recovery
Serial complete blood counts (CBCs) are plotted (Fig. 1, supplementary Figure 1). All patients engrafted within acceptable time frames. Most of the patients had a nadir in ANC during the first week. Recovery of ANC was observed starting the second week and was variable, but was consistent with published studies [14, 15, 25]. The median time to myeloid engraftment, defined as achieving 3 consecutive days when absolute neutrophil counts (ANC) exceeded 0.5 × 10⁹/L was 14 days (range 10–21 days) and 18 days (range 11–23 days) for 1.0 μg/kg and 100 μg/kg respectively. The 30-day incidence of neutrophil recovery was 100%, the 30-day platelet recovery to 50 × 109/L was 93%, and platelet recovery to 20 × 109/L was 100%.
Figure 1.
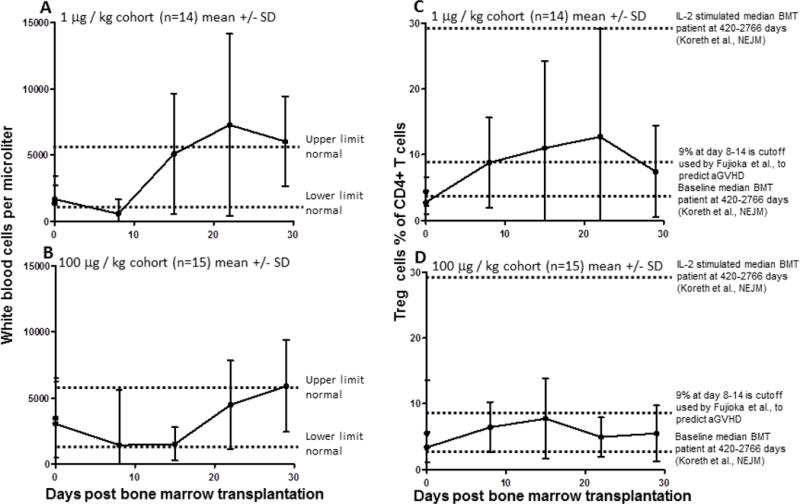
Kinetics of WBC and Treg recovery in the two cohorts are similar. WBC values (A,B) or Treg percentage (C,D) are plotted at various timepoints for the 1 μg (A,C,) and 100 μg (B,D,) cohorts as the mean value with SD error bars. Dotted lines indicate reference levels.
T lymphocyte recovery
Lymphocyte numbers were markedly low during the first week after HCT. By the second week, lymphocyte counts had increased to levels that allowed immunophenotypical analysis. Flow cytometry was used to enumerate CD4+ and CD8+ T cell subsets in the blood of patients over time (see Supplementary Fig. 2 for gating strategy). In most patients, CD4+ T cells constituted the majority of the T cells before HCT, and CD4+ T cell counts typically decreased in percentage during the first month after HCT (Supplementary Fig. 3). In contrast, CD8+ T cells started as a minority of T cells in most patients and typically increased in percentage during the first month after HCT (Supplementary Fig. 4). There was no apparent difference between the cohort receiving low versus high dose RGI-2001 in the percentages of CD4+ or CD8+ cells in the blood. Other cell populations including NKT cells and B cells were assessed, but we observed no significant changes in these cell populations over time or between cohorts, especially as these cells represented a minor component (typically < 3%) of the lymphocyte population (data not shown). NK cells were not reliably quantified by our flow cytometry assay using CD56 and CD16 as markers.
Treg recovery
To quantify Treg in the blood, CD4+ T cells that had high expression of CD25 and low expression of CD127 were measured as shown in Supplemental Fig. 2. This population was readily detectable and quantified in whole blood. The percentage of Treg, defined as CD4+CD25hiCD127lo cells, was notably low, 5% or less of total CD4+ T cells in most patients from both cohorts (Fig. 1, Supplemental Fig. 6). A subset of patients from each cohort had peak Treg percentages that exceeded 12% of all CD4+ T cells (Supplemental Fig. 5). There was a trend that the cohort receiving the lower dose of RGI-2001 had higher overall Treg percentages. This response in Treg percentage resulted in a total overall increase in Treg cell numbers, as shown in Fig. 2 and Supplemental Fig. 6. Treg numbers in our cohort were similar to those found in HCT patients and were lower than in normal healthy donors, as expected, given that many of the patients had received a myeloablative conditioning regimen before HCT. The ratio of Treg to T-conventional (Treg:Tconv) cells increased in both cohorts as shown in Fig. 2 and Supplemental Fig. 7.
Figure 2.
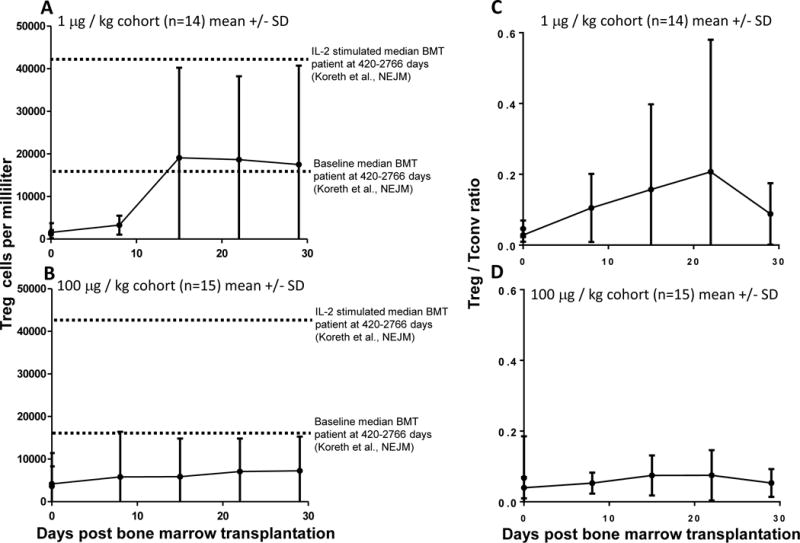
Kinetics of Treg numbers and ratios in the two cohorts are similar. Treg numbers (A,B) or ratios(C,D) are plotted at various timepoints for the 1 μg (A,C,) and 100 μg (B,D,) cohorts as the mean value with SD error bars.
Defining Treg responders to RGI-2001
We observed 2 types of responses when Treg were measured. One subset had Treg percentage greater than 12% of total CD4+ T cells at any time after HCT and was defined as a “responder” subset. This subset was comprised of four patients from each cohort, for a total of eight responders. The other 21 patients were defined as non-responders who had Treg levels consistently below 12% of total CD4+ T cells after HCT. Because we did not have a well-matched control population of patients who did not receive RGI-2001, we compared clinical outcomes and flow cytometry profiles between responders and non-responders.
Percentages of Treg and Foxp3-expressing cells in responders
In order to compare flow cytometry data from the responder and non-responder cohorts, we evaluated the peak Treg values from each patient in the responder and non-responder cohorts. The peak Treg values typically occurred at days 8 or 15 in both cohorts (Supplemental Figure 8). As expected based on how the cohorts were defined, the responder population had peak Treg values that were higher than the non-responder population (Fig. 3A). Fig. 3B shows representative flow cytometry data from single patients from each cohort. Foxp3 staining was used to confirm that these were Treg. Fig. 3C shows the peak percentages of Foxp3-expressing cells in the responders were greater than the non-responders. The Foxp3-expressing cells were all CD25hi in both responder and non-responder patients (representative dot plots shown in Fig. 3D). When the data were represented by grouping responders and non responders, we found that among CD4+ T cells, the mean percentage of cells expressing Foxp3 and CD25 was 25% in the responder group compared to 12% in the non-responder group.
Figure 3.
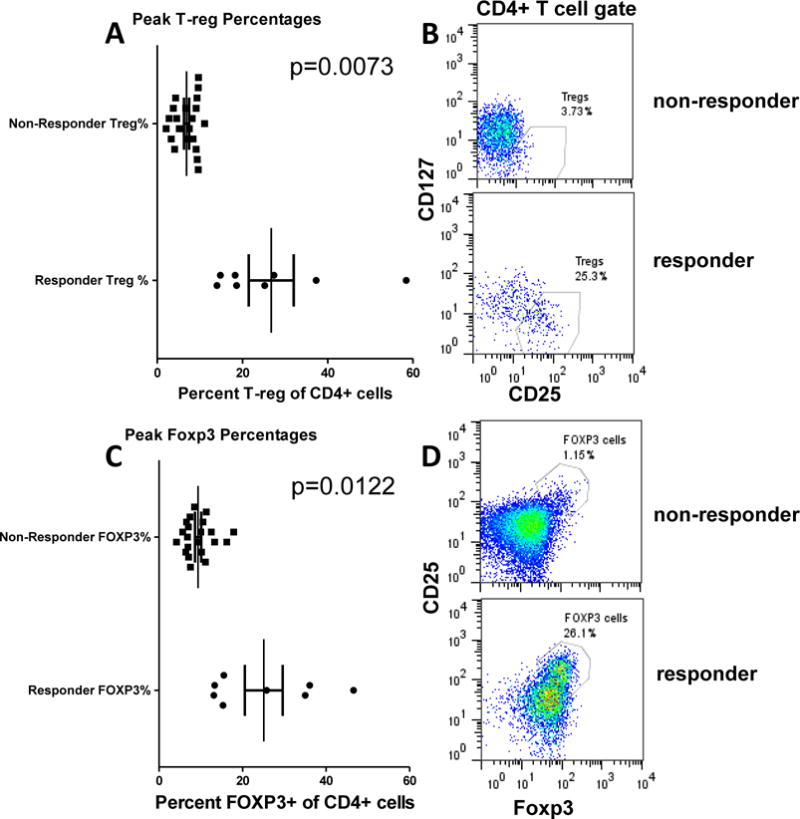
T-reg percentages in responder and non-responder cohorts. Peak T-reg percentages defined by (A) CD25hi CD127lo or (C) CD25hi Foxp3hi phenotypes are shown each patient. The patients are grouped according to T-reg percentages greater than 10% as defined by CD25hi CD127lo phenotypes. (B,D) show representative dot plots.
Ki-67 and Helios expression in Treg indicate expansion of natural Treg
Murine studies [20] indicated that RGI-2001 led to expansion of natural Treg. There are no definitive markers of natural Treg in humans, but Helios expression is thought to identify at least a subset of natural human Treg [26–28]. To further characterize the expanded Treg, we used flow cytometry to detect Foxp3+ cells expressing intracellular Ki-67 as a proliferation marker and Helios to detect a subset of natural Treg. Fig. 4B shows that Foxp3 and Ki-67 staining of CD4+ cells identified four subsets of cells corresponding to proliferating and non-proliferating Treg and non-Treg. Responders showed a trend for increased numbers of proliferating Treg (defined as Foxp3+Ki-67+ cells) compared to non-responders (Fig. 4A). On average, the non-responder Foxp3+ cells had 30% Ki-67 expression compared to 55% in the responder population. Among the responders, a small cohort had close to 90% proliferation of Treg cells. We could also detect Helios expression in Foxp3+ and Foxp3− cells (Fig. 4D) as an assessment of a subset of natural Treg. As predicted from the murine studies, the peak percentage of Helios+ cells within Foxp3+ cells was high in both cohorts (mean=60% in non-responders and 85% in responders) (Fig. 4C). Responders had higher percentages of Helios+ cells compared to non-responders.
Figure 4.
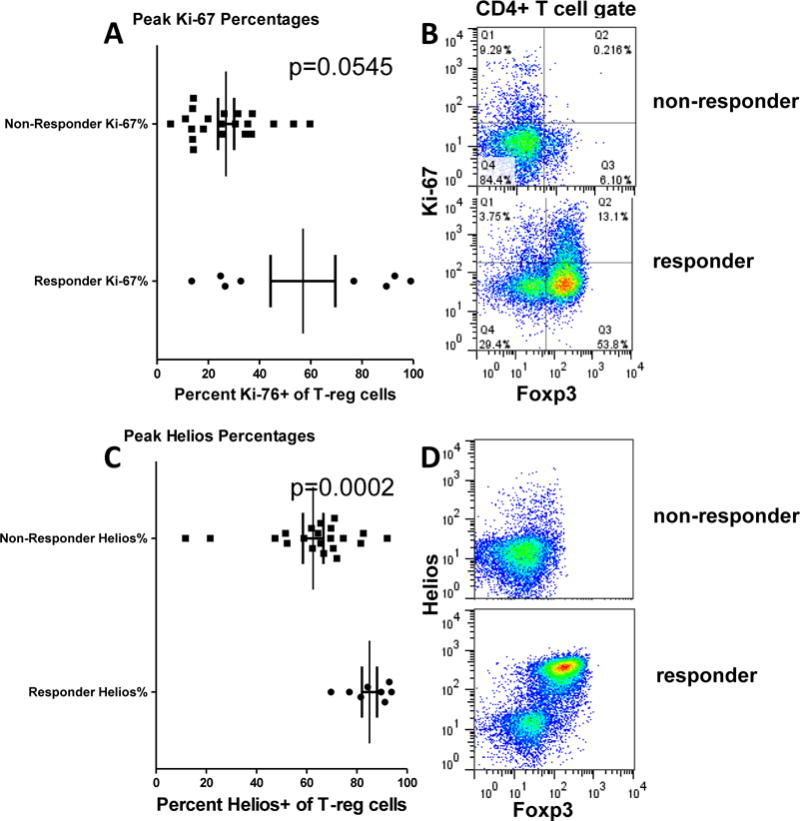
Ki-67 and Helios expression T-regs in responder and non-responder cohorts. Peak Ki-67 (A) or helios (C) expression in T-regs are shown each patient. The patients are grouped according to T-reg percentages greater than 10% as defined by CD25hi CD127lo phenotypes. (B,D) show representative dot plots.
Demographics of the population
Demographic characteristics of the responder and non-responder cohorts did not differ significantly (Table 4), although the numbers were too small to yield appropriate statistical power. The responders were enriched in patients who had received sirolimus as part of their GVHD prophylaxis regimen. Six of the 8 responders had received sirolimus in the GVHD prophylaxis regimen, whereas only 2 of 21 non-responders received sirolimus (p = NS).
Table 4.
Baseline Characteristics of Treg Responders vs. Non-Responders (n=29 subjects)
| Characteristic | Treg Responders* (n = 8) |
Non-Responders (n = 21) |
|---|---|---|
|
| ||
| Dose of RGI-2001 | ||
| 1 ug/kg | 4 (50.0) | 10 (47.6) |
| 100 ug/kg | 4 (50.0) | 11 (52.4) |
|
| ||
| Age | ||
| Median | 50.0 | 56.5 |
| Min, Max | 19, 68 | 42, 67 |
|
| ||
| Race | ||
| White | 8 (100.0) | 19 (90.4) |
| Black | – | 1 (4.8) |
| Asian | – | 1 (4.8) |
|
| ||
| Gender | ||
| M | 8 (100) | 14 (66.7) |
| F | – | 7 (33.3) |
|
| ||
| Diagnosis | ||
| AML/MDS | 4 (50.0) | 15 (71.4) |
| CML | 2 (25.0) | 1 (4.8) |
| ALL | – | 2 (9.5) |
| Myelofibrosis | 2 (25.0) | – |
| MM | – | 1 (4.8) |
| T cell | – | 2 (9.5) |
|
| ||
| Conditioning Regimen | ||
| Flu/Mel, Flu/Cy or Flu/Bus | 5 (62.5) | 13 (61.9) |
| Bu/CY based | 3 (37.5) | 5 (23.8) |
| TBI/CY based | – | 3 (14.3) |
|
| ||
| GVHD Prophylaxis | ||
| CNI/MTX | 2 (25.0) | 17 (81.0) |
| CNI/MTX + steroids | – | 2 (9.5) |
| CNI/Sirolimus | 6 (62.5) | 2 (9.5) |
|
| ||
| Graft Source | ||
| PBSC | 7 (87.5) | 16 (76.2) |
| Bone Marrow | 1 (12.5) | 5 (23.8) |
| HLA Matched | 7 (87.5) | 18 (85.7) |
| Mismatched | 1 (12.5) | 3 (14.3) |
|
| ||
| Donor Relationship | ||
| Unrelated | 7 | 13 |
| Related | 1 | 5 |
| Not specified by Site | 0 | 3 |
Treg>12% post treatment
GVHD incidence
The respective incidence rates of grades II–IV and grades III–IV aGVHD were 12.5% and 0% in responders, compared to 52.4% and 9.5% in grades II–IV and grades III–IV non-responders with a median onset of 34 days (Table 5). None of the patients in this study had grade IV aGVHD as assessed per modified Keystone criteria [29] with grade IV defined as bullous skin formation, bilirubin > 15.0 mg/dl and gastrointestinal symptoms with severe abdominal pain with or without ileus.
Table 5.
The incidences of acute GVHD grouped by Treg responders.
| RGI-2001 Dosing Cohorts |
Tregs Responders* N=8 |
Tregs Non-Responders N=21 |
||
|---|---|---|---|---|
| Grade II–IV | Grade III–IV | Grade II–IV | Grade III–IV | |
| Combined cohorts | 1/8 (12.5%) | 0/8 (0.0%) | 11/21 (52.4%) | 2/21 (9.5%) |
| 1.0 μg/kg | 1/4 (25.0%) | 0/4 (0.0%) | 5/10 (50.0%) | 1/10 (10.0%) |
| 100 μg/kg | 0/4 (0.0%) | 0/4 (0.0%) | 6/11 (54.5%) | 1/11 (9.0%) |
defined as Tregs >12% at any time post treatment.
Discussion
In this Phase IIa clinical trial, an alternate approach of preferential Treg stimulation by a single intravenous infusion of RGI-2001 on day 0 of transplant was tested in patients undergoing allogeneic transplantation. This treatment was well tolerated without infusional toxicities and may potentially be efficacious in boosting in vivo Treg numbers and percentages. We found the percentage of Treg was low (Treg percentages less than 5% of total CD4+ T cells in most subjects), but a subset (n=8) of patients in each dose cohort had Treg percentages exceeding 12% of total CD4+ T cells. The increase in Treg percentage correlated with the total overall increase in Treg absolute numbers. This population was thus defined as a “responder” population. FoxP3 staining was used to confirm that these were Treg. One limitation in this study is the lack of a control population that did not receive RGI-2001. This limitation prevents us from concluding that the increase in Treg and decrease in GVHD is due to RGI-2001. Nevertheless, our studies highlight the safety of RGI-2001 and its potential to synergize with sirolimus to promote Tregs and reduce GVHD.
Treg can be induced from naïve T cells via T cell receptor (TCR) stimulation in the presence of transforming growth factor beta (TGFβ) or can be expanded from thymic-derived Foxp3+ natural Treg via TCR stimulation with IL-2 or IL-10 [30–33]. In addition, Ki-67+ Foxp3+ Helios+ Treg cells were at high levels (90%) in a subset of the patients in this study. We interpret this as evidence that a subset of natural Treg proliferated in this group of patients. Unfortunately, there is not a flow cytometric method that can reliably identify all human natural Treg [33], so we cannot ascertain the true lineage of the expanded T cells. We believe the mechanism by which RGI-2001 induces Treg expansion is via activation of host iNKT cells. The exact mechanism of how activated iNKT cells result in Treg expansion is not known with certainty although cytokines and perhaps cellular intermediates are thought to play an important role [24]. Indeed, other studies have shown that RGI-2001 can induce iNKT cell production of IL-10 [34], a known growth signal for Treg. Alternatively, it has been shown that RGI-2001 could induce IL-10 to promote tolerogenic dendritic cells (DCs) that could expand Treg [21, 35]. In murine models, iNKT cells provide IL-4 to induce the expansion of recipient Treg [24], and this expansion also occurred with adoptively transferred donor [22] and third party [36] iNKT cells. Notably, there appears to be a GR-1+ intermediate cell, likely a myeloid derived suppressor cell (MDSC) that interacts with iNKT cells and Treg, because in vivo depletion of MDSC abrogated both Treg expansion and protection from lethal GVHD induced by iNKT cells [36]. In vivo bioluminescence studies in murine models showed that adoptively transferred Treg proliferate mostly in the secondary lymphoid organs [37]. If these murine models represent human HCT, then we would expect that donor Treg might encounter iNKT cells, DCs, and/or MDSCs in tissues, as opposed to the blood. In our study, iNKT cells were low and hard to detect in the blood, IL-4 was only detectable in the 100 μg/kg group and there were no obvious trends.
Most patients in the responder group (6/8) had received sirolimus containing GVHD prophylaxis regimen, whereas only 2/21 patients received sirolimus in the non-responding group. Previously, we showed in murine studies that the administration of RGI-2001 synergized with sub-optimal doses of sirolimus to prevent lethal GVHD [20]. In these animal studies, a dose of 0.1 mg/kg sirolimus given daily at days 0–14 synergized with a single dose of RGI-2001 on day 0 to protect 90% of the mice from GVHD compared to less than 50% protection by either treatment alone. Sirolimus also synergized with RGI-2001 to augment natural Treg cell numbers, but the mechanism of action was not clear. Although most patients who had robust Treg responses had received sirolimus (and were in the 1.0 μg/kg RGI-2001 group), two of the responders received tacrolimus and methotrexate. However, based on the clinical results in this study, it appears that the combination of RGI-2001 and sirolimus in HCT patients had a synergistic effect similar to results observed in the animal studies.
The effect of in vivo administration of mTOR inhibitors such as sirolimus on Treg has been studied in murine models and in clinical trials, often in comparison with tacrolimus, a calcineurin inhibitor. It is unclear whether calcineurin inhibitors interfere with Treg expansion or whether sirolimus induces Treg expansion. One group showed that sirolimus did not induce expansion of murine Treg and in fact decreased Treg numbers in vivo [38]. Another group showed sirolimus increased Treg numbers by converting CD4+ naïve cells to Treg, leading to inhibition of alloimmunity [39]. In renal allograft recipients, switching from a calcineurin inhibitor to sirolimus several months after transplant led to a modest but sustained increase in Treg numbers and percentages begining at 30 days afterwards [40]. This result was also found in another clinical trial with renal transplant patients showing that patients treated with sirolimus had increased Treg numbers compared to those treated with calcineurin inhibitors [41]. Indeed, another recent study showed that sirolimus did not increase the numbers of Treg, while use of a calcineurin inhibitor decreased the numbers of Tregs compared to control patients [42]. Despite the relative increase in Treg in sirolimus compared to calcineurin-inhibitor-treated patients, sirolimus did not lead to enhanced survival or a decreased risk of organ rejection [43]. Pidala and colleagues [44] conducted a randomized trial comparing sirolimus/tacrolimus (SIR/TAC) against that of methotrexate/tacrolimus (MTX/TAC) in 74 HCT recipients. The proportions of Treg/total CD4+ cells at days 30 and 90 and corresponding absolute numbers of Treg were higher in SIR/TAC-treated patients, while the absolute numbers of non-Treg CD4+ cells were lower than in MTX/TAC-treated patients. The cumulative incidence of grades II–IV acute GVHD at 100 days was 43% (95% CI: 27–59%) in the SIR/TAC group, and 89% (95% CI 72–96%) in the MTX/TAC group (P<0.001). The cumulative incidence of grade III–IV acute GVHD did not differ significantly (14% versus 11%; P=0.71). While this study did not have well matched control subjects for GVHD assessment, the historical published data was used for reference comparison. The Blood and Marrow Transplant Clinical Trials Network study reported cumulative incidences of grade II–IV acute GVHD at day 100 of 26% and 34% for tacrolimus/sirolimus regimen and tacrolimus/methotrexate regimen, respectively, on related matched donor allogeneic transplantation [45]. The incidences of acute GVHD reported in this study showed that the acute GVHD occurrence was well within the published data; however, since the demographics of the populations are likely different, we cannot conclude whether RGI-2001 had any effect on the GVHD incidence. Altogether, the results of other clinical trials support the conclusion that the expanded Ki-67+ Treg observed in a subset of our patients could be due to an effect of sirolimus on Treg or non-Treg numbers. Whether sirolimus synergized with RGI-2001 in expanding Treg cells in HCT patients is an area of future investigation, although the prior murine studies and clinical trial results would support this concept.
Future studies should explore repeated serial dosing of RGI-2001 to provide further evidence of the effect of RGI-2001 on Treg expansion. It will be important as well to determine why some patients responded to RGI-2001, while others did not. In summary, the administration of RGI-2001 was safe and resulted in increased numbers of Treg following allogeneic transplantation in some patients, especially in those treated with sirolimus as part of their GVHD prophylaxis regimen. A randomized study is warranted to further evaluate the impact of serial dosing of RGI-2001 on Treg biology and GVHD prevention.
Supplementary Material
Highlights.
RGI-2001 when given to patients receiving HCT is safe and well tolerated.
In a subset of patients receiving RGI-2001, an increase of Treg percentage and number was seen.
In patients receiving RGI-2001, increases in Treg percentage and number were correlated with lower incidence and severity of GVHD and with concomitant sirolimus use.
Acknowledgments
This study is funded by REGiMMUNE Corporation. Dr. Bui and Dr. Chen report grant support from REGiMMUNE. The following authors are employed by REGiMMUNE: Yasuyuki Ishii, Omar Duramad. Lori Kunkel and Dana Lee received consulting fees for services to REGiMMUNE.
Footnotes
Publisher's Disclaimer: This is a PDF file of an unedited manuscript that has been accepted for publication. As a service to our customers we are providing this early version of the manuscript. The manuscript will undergo copyediting, typesetting, and review of the resulting proof before it is published in its final citable form. Please note that during the production process errors may be discovered which could affect the content, and all legal disclaimers that apply to the journal pertain.
References
- 1.Josefowicz SZ, Lu LF, Rudensky AY. Regulatory T cells: mechanisms of differentiation and function. Annu Rev Immunol. 2012;30:531–64. doi: 10.1146/annurev.immunol.25.022106.141623. [DOI] [PMC free article] [PubMed] [Google Scholar]
- 2.Sakaguchi S, et al. Regulatory T cells and immune tolerance. Cell. 2008;133(5):775–87. doi: 10.1016/j.cell.2008.05.009. [DOI] [PubMed] [Google Scholar]
- 3.Cohen JL, et al. CD4(+)CD25(+) immunoregulatory T Cells: new therapeutics for graft-versus-host disease. J Exp Med. 2002;196(3):401–6. doi: 10.1084/jem.20020090. [DOI] [PMC free article] [PubMed] [Google Scholar]
- 4.Edinger M, et al. CD4+CD25+ regulatory T cells preserve graft-versus-tumor activity while inhibiting graft-versus-host disease after bone marrow transplantation. Nat Med. 2003;9(9):1144–50. doi: 10.1038/nm915. [DOI] [PubMed] [Google Scholar]
- 5.Hoffmann P, et al. Donor-type CD4(+)CD25(+) regulatory T cells suppress lethal acute graft-versus-host disease after allogeneic bone marrow transplantation. J Exp Med. 2002;196(3):389–99. doi: 10.1084/jem.20020399. [DOI] [PMC free article] [PubMed] [Google Scholar]
- 6.Joffre O, et al. Prevention of acute and chronic allograft rejection with CD4+CD25+Foxp3+ regulatory T lymphocytes. Nat Med. 2008;14(1):88–92. doi: 10.1038/nm1688. [DOI] [PMC free article] [PubMed] [Google Scholar]
- 7.Pierini A, Alvarez M, Negrin RS. NK Cell and CD4+FoxP3+ Regulatory T Cell Based Therapies for Hematopoietic Stem Cell Engraftment. Stem Cells Int. 2016;2016:9025835. doi: 10.1155/2016/9025835. [DOI] [PMC free article] [PubMed] [Google Scholar]
- 8.Ukena SN, et al. Human regulatory T cells in allogeneic stem cell transplantation. Blood. 2011;118(13):e82–92. doi: 10.1182/blood-2011-05-352708. [DOI] [PubMed] [Google Scholar]
- 9.Miura Y, et al. Association of Foxp3 regulatory gene expression with graft-versus-host disease. Blood. 2004;104(7):2187–93. doi: 10.1182/blood-2004-03-1040. [DOI] [PubMed] [Google Scholar]
- 10.Rieger K, et al. Mucosal FOXP3+ regulatory T cells are numerically deficient in acute and chronic GvHD. Blood. 2006;107(4):1717–23. doi: 10.1182/blood-2005-06-2529. [DOI] [PubMed] [Google Scholar]
- 11.Zorn E, et al. Reduced frequency of FOXP3+ CD4+CD25+ regulatory T cells in patients with chronic graft-versus-host disease. Blood. 2005;106(8):2903–11. doi: 10.1182/blood-2005-03-1257. [DOI] [PMC free article] [PubMed] [Google Scholar]
- 12.Magenau JM, et al. Frequency of CD4(+)CD25(hi)FOXP3(+) regulatory T cells has diagnostic and prognostic value as a biomarker for acute graft-versus-host-disease. Biol Blood Marrow Transplant. 2010;16(7):907–14. doi: 10.1016/j.bbmt.2010.02.026. [DOI] [PMC free article] [PubMed] [Google Scholar]
- 13.Rezvani K, et al. High donor FOXP3-positive regulatory T-cell (Treg) content is associated with a low risk of GVHD following HLA-matched allogeneic SCT. Blood. 2006;108(4):1291–7. doi: 10.1182/blood-2006-02-003996. [DOI] [PMC free article] [PubMed] [Google Scholar]
- 14.Fujioka T, et al. Frequency of CD4(+)FOXP3(+) regulatory T-cells at early stages after HLA-mismatched allogeneic hematopoietic SCT predicts the incidence of acute GVHD. Bone Marrow Transplant. 2013;48(6):859–64. doi: 10.1038/bmt.2012.232. [DOI] [PubMed] [Google Scholar]
- 15.Alho AC, et al. Unbalanced recovery of regulatory and effector T cells after allogeneic stem cell transplantation contributes to chronic GVHD. Blood. 2016;127(5):646–57. doi: 10.1182/blood-2015-10-672345. [DOI] [PMC free article] [PubMed] [Google Scholar]
- 16.Koreth J, et al. Interleukin-2 and regulatory T cells in graft-versus-host disease. N Engl J Med. 2011;365(22):2055–66. doi: 10.1056/NEJMoa1108188. [DOI] [PMC free article] [PubMed] [Google Scholar]
- 17.Di Ianni M, et al. Tregs prevent GVHD and promote immune reconstitution in HLA-haploidentical transplantation. Blood. 2011;117(14):3921–8. doi: 10.1182/blood-2010-10-311894. [DOI] [PubMed] [Google Scholar]
- 18.Martelli MF, et al. HLA-haploidentical transplantation with regulatory and conventional T-cell adoptive immunotherapy prevents acute leukemia relapse. Blood. 2014;124(4):638–44. doi: 10.1182/blood-2014-03-564401. [DOI] [PubMed] [Google Scholar]
- 19.Brunstein CG, et al. Infusion of ex vivo expanded T regulatory cells in adults transplanted with umbilical cord blood: safety profile and detection kinetics. Blood. 2011;117(3):1061–70. doi: 10.1182/blood-2010-07-293795. [DOI] [PMC free article] [PubMed] [Google Scholar]
- 20.Duramad O, et al. Pharmacologic expansion of donor-derived, naturally occurring CD4(+)Foxp3(+) regulatory T cells reduces acute graft-versus-host disease lethality without abrogating the graft-versus-leukemia effect in murine models. Biol Blood Marrow Transplant. 2011;17(8):1154–68. doi: 10.1016/j.bbmt.2010.11.022. [DOI] [PubMed] [Google Scholar]
- 21.Ishii Y, et al. Alpha-galactosylceramide-driven immunotherapy for allergy. Front Biosci. 2008;13:6214–28. doi: 10.2741/3149. [DOI] [PubMed] [Google Scholar]
- 22.Schneidawind D, et al. CD4+ invariant natural killer T cells protect from murine GVHD lethality through expansion of donor CD4+CD25+FoxP3+ regulatory T cells. Blood. 2014;124(22):3320–8. doi: 10.1182/blood-2014-05-576017. [DOI] [PMC free article] [PubMed] [Google Scholar]
- 23.Schneidawind D, Pierini A, Negrin RS. Regulatory T cells and natural killer T cells for modulation of GVHD following allogeneic hematopoietic cell transplantation. Blood. 2013;122(18):3116–21. doi: 10.1182/blood-2013-08-453126. [DOI] [PMC free article] [PubMed] [Google Scholar]
- 24.Pillai AB, et al. Host natural killer T cells induce an interleukin-4-dependent expansion of donor CD4+CD25+Foxp3+ T regulatory cells that protects against graft-versus-host disease. Blood. 2009;113(18):4458–67. doi: 10.1182/blood-2008-06-165506. [DOI] [PMC free article] [PubMed] [Google Scholar]
- 25.Storek J, et al. Reconstitution of the immune system after hematopoietic stem cell transplantation in humans. Semin Immunopathol. 2008;30(4):425–37. doi: 10.1007/s00281-008-0132-5. [DOI] [PubMed] [Google Scholar]
- 26.Himmel ME, et al. Helios+ and Helios-cells coexist within the natural FOXP3+ T regulatory cell subset in humans. J Immunol. 2013;190(5):2001–8. doi: 10.4049/jimmunol.1201379. [DOI] [PubMed] [Google Scholar]
- 27.Ayyoub M, Raffin C, Valmori D. Comment on “helios+ and helios-cells coexist within the natural FOXP3+ T regulatory cell subset in humans”. J Immunol. 2013;190(9):4439–40. doi: 10.4049/jimmunol.1390018. [DOI] [PubMed] [Google Scholar]
- 28.MacDonald KG, et al. Response to comment on “helios+ and helios-cells coexist within the natural FOXP3+ T regulatory cell subset in humans”. J Immunol. 2013;190(9):4440–1. doi: 10.4049/jimmunol.1390019. [DOI] [PubMed] [Google Scholar]
- 29.Przepiorka D, et al. 1994 Consensus Conference on Acute GVHD Grading. Bone Marrow Transplant. 1995;15(6):825–8. [PubMed] [Google Scholar]
- 30.Fontenot JD, Gavin MA, Rudensky AY. Foxp3 programs the development and function of CD4+CD25+ regulatory T cells. Nat Immunol. 2003;4(4):330–6. doi: 10.1038/ni904. [DOI] [PubMed] [Google Scholar]
- 31.Chen W, Konkel JE. TGF-beta and ‘adaptive’ Foxp3(+) regulatory T cells. J Mol Cell Biol. 2010;2(1):30–6. doi: 10.1093/jmcb/mjp004. [DOI] [PMC free article] [PubMed] [Google Scholar]
- 32.Horwitz DA, Zheng SG, Gray JD. Natural and TGF-beta-induced Foxp3(+)CD4(+) CD25(+) regulatory T cells are not mirror images of each other. Trends Immunol. 2008;29(9):429–35. doi: 10.1016/j.it.2008.06.005. [DOI] [PubMed] [Google Scholar]
- 33.Lin X, et al. Advances in distinguishing natural from induced Foxp3(+) regulatory T cells. Int J Clin Exp Pathol. 2013;6(2):116–23. [PMC free article] [PubMed] [Google Scholar]
- 34.Taniguchi M, et al. The regulatory role of Valpha14 NKT cells in innate and acquired immune response. Annu Rev Immunol. 2003;21:483–513. doi: 10.1146/annurev.immunol.21.120601.141057. [DOI] [PubMed] [Google Scholar]
- 35.Tamura Y, et al. Characterization of the immature dendritic cells and cytotoxic cells both expanded after activation of invariant NKT cells with alpha-galactosylceramide in vivo. Biochem Biophys Res Commun. 2008;369(2):485–92. doi: 10.1016/j.bbrc.2008.02.037. [DOI] [PubMed] [Google Scholar]
- 36.Schneidawind D, et al. Third-party CD4+ invariant natural killer T cells protect from murine GVHD lethality. Blood. 2015;125(22):3491–500. doi: 10.1182/blood-2014-11-612762. [DOI] [PMC free article] [PubMed] [Google Scholar]
- 37.Nguyen VH, et al. In vivo dynamics of regulatory T-cell trafficking and survival predict effective strategies to control graft-versus-host disease following allogeneic transplantation. Blood. 2007;109(6):2649–56. doi: 10.1182/blood-2006-08-044529. [DOI] [PubMed] [Google Scholar]
- 38.Qu Y, et al. The effect of immunosuppressive drug rapamycin on regulatory CD4+CD25+Foxp3+T cells in mice. Transpl Immunol. 2007;17(3):153–61. doi: 10.1016/j.trim.2007.01.002. [DOI] [PubMed] [Google Scholar]
- 39.Gao W, et al. Contrasting effects of cyclosporine and rapamycin in de novo generation of alloantigen-specific regulatory T cells. Am J Transplant. 2007;7(7):1722–32. doi: 10.1111/j.1600-6143.2007.01842.x. [DOI] [PMC free article] [PubMed] [Google Scholar]
- 40.Bansal D, et al. Deferred pre-emptive switch from calcineurin inhibitor to sirolimus leads to improvement in GFR and expansion of T regulatory cell population: a randomized, controlled trial. PLoS One. 2013;8(10):e75591. doi: 10.1371/journal.pone.0075591. [DOI] [PMC free article] [PubMed] [Google Scholar]
- 41.Noris M, et al. Regulatory T cells and T cell depletion: role of immunosuppressive drugs. J Am Soc Nephrol. 2007;18(3):1007–18. doi: 10.1681/ASN.2006101143. [DOI] [PubMed] [Google Scholar]
- 42.Korczak-Kowalska G, et al. The influence of immuosuppressive therapy on the development of CD4+CD25+ T cells after renal transplantation. Transplant Proc. 2007;39(9):2721–3. doi: 10.1016/j.transproceed.2007.09.015. [DOI] [PubMed] [Google Scholar]
- 43.Lim WH, et al. A systematic review of conversion from calcineurin inhibitor to mammalian target of rapamycin inhibitors for maintenance immunosuppression in kidney transplant recipients. Am J Transplant. 2014;14(9):2106–19. doi: 10.1111/ajt.12795. [DOI] [PubMed] [Google Scholar]
- 44.Pidala J, et al. A randomized phase II study to evaluate tacrolimus in combination with sirolimus or methotrexate after allogeneic hematopoietic cell transplantation. Haematologica. 2012;97(12):1882–9. doi: 10.3324/haematol.2012.067140. [DOI] [PMC free article] [PubMed] [Google Scholar]
- 45.Cutler C, et al. Tacrolimus/sirolimus vs tacrolimus/methotrexate as GVHD prophylaxis after matched, related donor allogeneic HCT. Blood. 2014;1248:1372–1377. doi: 10.1182/blood-2014-04-567164. [DOI] [PMC free article] [PubMed] [Google Scholar]
Associated Data
This section collects any data citations, data availability statements, or supplementary materials included in this article.