Abstract
Brain–computer interfaces enable users to control devices with electroencephalographic (EEG) activity from the scalp or with single-neuron activity from within the brain. One of the most challenging issues in this regard is the balance between the accuracy of brain signals from patients and the speed of interpreting them into machine language. The main objective of this paper is to analyze different approaches to achieve the balance more quickly and in a better way. To reduce the ocular artifacts, the symmetric prewhitening independent component analysis (ICA) algorithm has been evaluated, which has the lowest runtime and lowest signal-to-interference (SIR) index, without destroying the original signal. After quick elimination of all undesirable signals, two successful feature extractors – the log-band power algorithm and common spatial patterns (CSPs) – are used to extract features. The emphasis is on identifying discriminative properties of the feature sets representing EEG trials recorded during the imagination of the tongue, feet, and left–right-hand movement. Finally, three well-known classifiers are evaluated, where the ridge regression classifier and CSPs as feature extractor have the highest accuracy classification rate about 83.06% with a standard deviation of 1.22%, counterposing the recent studies.
Keywords: Brain–computer interface, electroencephalography signals, machine learning, pattern recognition
Introduction
Brain–computer interface (BCI) technology tends to develop a direct way between the brain and external devices.[1] This technology improves the quality of life for individuals with disabilities.[2] In fact, BCI is an artificial intelligence system that could recognize a set of patterns in brain electroencephalography (EEG) signals through a number of consecutive phases including signal acquisition for the brain signals capturing, preprocessing, or artifacts by reducing the signals in a proper form, feature extraction for identifying discriminative information in brain signals, classifying the signals based on the extracted feature vectors, and the control interface step for translating the signals into commands for external devices such as a wheelchair or computer.[3,4] The first step in developing a BCI system is to acquire appropriate brain signals. Various kinds of neuroimaging approaches are used. Such approaches include portable, nonportable, invasive, or noninvasive methods typified by EEG, magnetoencephalography, and electrocorticography. For a detailed description of each method's characteristics and use, you can refer to Nicolas-Alonso and Gomez-Gil.[5] In the scope of this paper, only EEG is considered as it mentions that our commitment to achieving the lowest classification error, bias, and variance should be simultaneous. A variety of stabilization techniques, including a combination of classifiers or regularization, should be used to reduce the variance. It should be noted that one of the most challenging steps for reducing classification errors is feature extraction, which determines the appropriate feature to be selected in this step. Studies have been conducted regarding this purpose, for instance, in Lin and Hsieh,[6] McFarland et al.,[7] Lins et al.,[8] and Boye et al.,[9] principal component analysis (PCA) has been used, which is a linear transformation with optimal representation of data in terms of the minimal mean-square error. On the other hand, there is no guarantee of always having a good classification, while PCA requires that artifacts must remain uncorrelated with the EEG signal.
In terms of classification, the Bayesian analysis method has been proposed and observed feature vector has been assigned to the labeled class.[9,10] This method produces nonlinear decision boundaries, although it is not very common in the BCI systems.[10-12] Using the support vector machine (SVM) in this regard, which is one of the most popular classification methods in machine-learning techniques, the distance between the nearest training samples and the hyperplanes could be maximized. One of its advantages is that speedy classifier, but it fails in the presence of outliers or strong noises. As discussed above, combination methods are needed to lower classification errors, and hence, a different combination of methods has been devised to achieve this goal. In this paper, several feature extraction patterns, including log-band power (log-BP), and several classifiers such as Gaussian mixture model (GMM), linear discriminant analysis (LDA), and ridge regression (RR), are implemented to assess the best performance of the four-class motor imagery (MI) EEG signal classification. Eventually, the novel algorithm proposed includes noise reduction by independent component analysis (ICA), common spatial pattern (CSP) features, and the RR classifier that has good results for a synchronous BCI. The remainder of this paper is organized as follows: section “Materials and Methods” describes the proposed method including noise reduction, features extraction, and classification. Experimental results are given in “Results” section. Discussion and conclusions are presented in the final two sections.
Materials and Methods
Preprocessing
One of the most common methods of implementation is linear filtering. These filters are proper when artifacts are in specific frequency bands and do not overlap with the original signal. For instance, the low-pass filter is suitable for removing electromyogram artifacts, and a high-pass filter is used for electrooculography (EOG) artifacts.[13] Meanwhile, for BCI systems perching in low-frequency neurological phenomena, such as movement-related potential, these methods do not seem as fruitful because these neurological phenomena may overlap the same frequency range as that of the EOG artifacts. However, they are efficient for BCI systems that use a neurological phenomenon with high-frequency bands (such as β- or μ-rhythms).
Another substantial method is ICA, which was considered in the past decade. Independent signal extraction from mixed signals is one of its applications. The ICA literature is divided into two major categories: practical algorithms and theoretical analyses.[14] For instance, considering the EEG recording signals given from within the brain, these EEG signals are recorded from different parts of the brain and hence, this information is a mixture of different activities of different parts of the brain. ICA could separate activities stemming from the most favorable parts of the brain using their independent components. ICA had different measures of non-Gaussianity and used two of them, namely kurtosis and skewness, for our desired ICA algorithm in this paper. Kurtosis is the classical measure of non-Gaussianity or the fourth-order cumulate. The kurtosis of y is denoted by:
(y)=(y4) – 3(E[y2])2 (1)
In Eq. 1, since we assumed E as the expectation operator and y is of unit variance, the right-hand side simplifies to E (y4) − 3.[15] Furthermore, kurtosis has received more attention than skewness in ICA.[16] In case of algorithms, it should be noted that the fixed-point ICA (FPICA) is a family of batch learning rules for hierarchical neural networks that elicit the source signal from their mixtures sequentially. This algorithm is easy to use because contrary to gradient-based algorithms, there are no step size parameters to select. It is computationally simple and does not require much memory space. Furthermore, the self-adaptive natural gradient algorithm with nonholonomic constraints (SANG) belongs to the family of the natural gradient (NG). SANG is a batch algorithm. In many cases dealing with parameter space, this matter is not always sufficient or efficient enough to use the conventional gradient of space. In the mass of optimization problems, including supervised learning and source separation, it is more effective to use the NG when implementing the learning rule. Furthermore, symmetric prewhitening (SYM_WHITE) is an algorithm which is not as well known as the conventional ICA algorithm, but it has a very high speed and good accuracy particularly in the EOG eliminating step. This algorithm is based on high-order statistics.
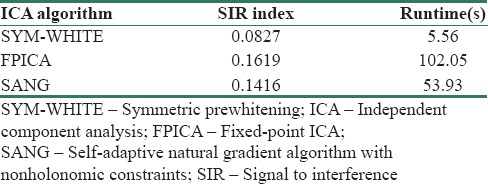
We evaluated thirty different ICA algorithms and chose three optimized algorithms of ICA (FPICA, SANG, and SYM-WHITE) that work better in noise reduction with the desired dataset. After that, we did the same for the SYM-WHITE algorithm: after running this algorithm we visually eliminate (1_2_3_4_6_7_8_9_10_13_17_22_23) the sources, but it should be noted that this step depends on the expertise of the observer (expert person) who could separate sources that closely resembles EOG artifacts. We set the ordering of the algorithm to kurtosis, as described earlier, while its runtime with MATLAB R2009a (The MathWorks, Inc., Natick, MA 2009), Core™ i5 is 2.50 GHz, and RAM 4 GHz is 5.56 s. The SYM-WHITE algorithm has the highest rate of speed among all investigated algorithms. Another optimized algorithm is FPICA, with which we eliminate (1_2_3_4_5_6_7_8_9_11_21) sources visually after running. Its runtime is 96.35 s. And finally, for the SANG algorithm, whose best ordering state is skewness, as mentioned above, the eliminated sources are (1_2_3_4_5_7_8_13_1_6_22_23_24), and its runtime is approximately 50.93 s.
The performance of our desired ICA algorithms was measured using the signal-to-interference (SIR) index, quantifying the distance of the obtained permutation matrix, P = (WA), from the optimum permutation matrix [Eq. 2]. The lower the SIR index, the better the achieved separation. For instance, an SIR index of zero implies a perfect separation. Table 1 indicates the efficiency of all three ICA algorithms.
Table 1.
The efficiency of all three independent component analysis algorithms

Feature extraction
Extracted features from our preprocessed EEG data are log-BP and CSPs in such a way that we should have some description of band power because the μ (8–13 Hz) and β (16–25 Hz) frequency bands play a vital role in the classification of MI typically channels C3 for right-hand movements, C4 for left-hand movements, and Cz for foot movements. There are some ways to extract band power features from the EEG signal, but the most popular one is the band-pass filtering the EEG signal from a given channel into the frequency-desired bands, then square the resulting signal to compute the signal power, and finally, average it over time.[17]
Classification
We investigate three successful methods: the GMM, the LDA, and the RR.[18,19,20,21,22,23] The GMM is a parametric probability density function, which is demonstrated as a weighted sum of Gaussian component densities. It means the GMM is a weighted sum of M component Gaussian densities, as given by the following equation:

Where x denotes a D-dimensional continuous-valued data vector (measurement or features), and λ is the width and μ is the height of Gaussian function. Wi, i = 1,…, M are the mixture weights, and g (x|μi, Σi), i = 1,…, M denotes the component Gaussian densities. Furthermore, LDA is a machine-learning method to find a linear combination of features that separates two or more classes of objects or events considering a set of features (X) for each sample of an object or event with known class Y. RR is a conventional multiple linear regression, which aims to solve the linearity problem of predictors. This method uses the X’X matrix instead of least squares to estimate model parameters. By doing this, the new parameters of the model are generated by bias. Hence, the RR idea is a reconciliation of bias–variance, which provides a model with fewer parameters and fewer mean-square errors.
Data description
In this paper, Dataset 2a from the BCI competition IV has been used. This dataset is provided by the Graz University of Technology;[24] it consists of EEG data from nine patients. Each of nine patients has 280 trials. The length of each trial is 8–9 s. The first 2 s of each trial is for the appearance of a fixed cross on the screen before beginning, after which an acoustic stimulus shows the beginning of the experiment at t = 2 s and at t = 3 s, while a cue in the form of an arrow pointer appears on the left, right, up, and down in accordance with the left hand, right hand, foot, or tongue for 1.25 s. It should be noted that only the data recorded between 3 and 8 s are considered to be event related [Figure 1].
Figure 1.
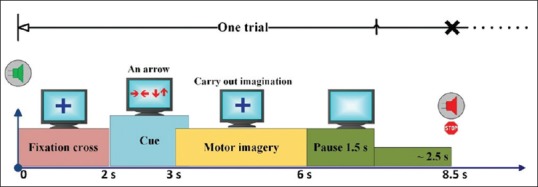
One-trial experimental paradigm for the motor imagery experiment
With EEG signals recorded from 22 Ag/AgCl electrodes (with inter-electrode distances of 3.5 cm), the montage is shown in Figure 2. All signals were recorded monopolarly with the left mastoid serving a reference and right mastoid as ground. The signals were sampled with 250 Hz and band-pass filtered between 0.5 and 100 Hz. Furthermore, the sensitivity of the amplifier is set to 100 μV. An additional 50 Hz notch filter is enabled to repress the line noise. Three monopolar EOG channels (23_24_25) located above the nasion and beneath the outer canthi of the eyes are recorded and sampled with 250 Hz. Figure 2 – Right is compared to datasets from the past BCI competitions these artifacts add to EEG signals in the Dataset 2a as a new challenging issue, thereby providing artifact-processing methods and should not be used for classification.
Figure 2.
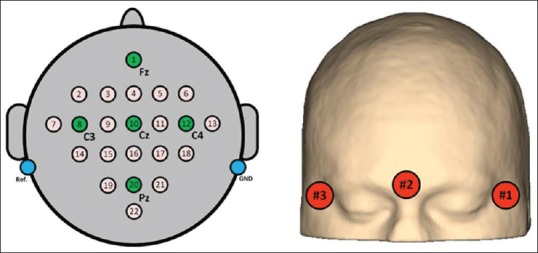
Left: Electrode montage regarding the International 10_20 system. Right: Electrode montage of the three monopolies electrooculography channels
Results
In this paper, Dataset 2a from the BCI competition IV has been used. This dataset was provided by the Graz University of Technology. Eye movement artifacts in Dataset 2a created a new challenging issue. The dataset consists of EEG data from nine patients. In addition to 22 EEG channels, three monopolar EOG channels (23_24_25) positioned above the nasion and under the outer canthi of the eyes are recorded and sampled with 250 Hz as well. Electrode montage and an electrode montage of the three monopolies EOG channels are shown in Figure 2.
As mentioned earlier, the μ (8–13 Hz) and β (16–25 Hz) frequency bands play a key role in MI classification. The 8–40 Hz frequency band has been investigated for the simple band-pass filter. Furthermore, thirty different ICA algorithms have been evaluated, and three optimized algorithms of ICA (FPICA, SANG, and SYM-WHITE) have been chosen, which work better in noise reduction with the desired dataset. After that, the same has been done for the SYM-WHITE algorithm; after executing this algorithm, we remove (1_2_3_4_6_7_8_9_10_13_17_22_23) sources visually and it should be noted that this step really depends on experts who could separate sources that closely resemble EOG artifacts.[25] As per the ordering of the algorithm to the kurtosis set as described earlier, its runtime with MATLAB 2009a, Core™ i5 2.50 GHz, and RAM 4 GHz is 5.56 s.
Now, our EEG signals are clean as far as possible after the first band pass-filtered and the second SYM-WHITE filtered as the noise reduction step, and then, they are ready for the feature extraction step. Initially, log-BP and CSP features have been extracted, as described in detail above, from our EEG signals. Table 2 indicates the parameters of these two features; these features play the role of an input for our desired classifiers. Some popular classifiers with these features are evaluated, but three classifiers have the best performance, namely, LDA, GMM, and RR. Among these three desired classifiers, RR has the best efficiency. Table 3 demonstrates log-BP and CSP as feature extraction methods and LDA, GMM, and RR as classifiers.
Table 2.
Common spatial pattern and log-band power parameters that are used for achieving the best efficiency

Table 3.
The efficiency of the proposed algorithm using various combinations of the feature extraction methods and the classification methods
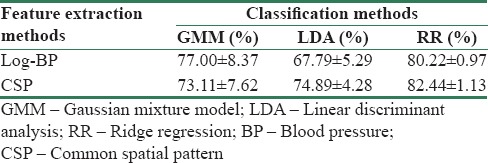
Figure 3 demonstrates our classification and results with log-BP and CSP features. Figure 4 demonstrates our classification result with LDA, GMM, and RR classifiers. Next, our best classification results (CSP + RR) are compared with another recent approach with the Graz Dataset 2a in Table 4 in the following section. In general, Figure 5 briefly illustrates the novelty of this paper.
Figure 3.
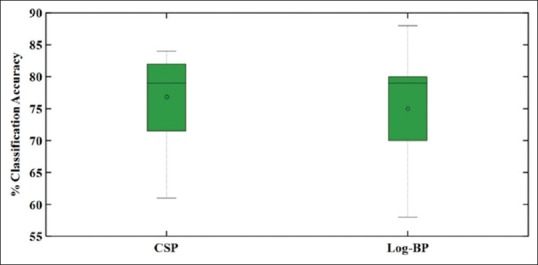
Our classification result with common spatial pattern and log-band power features for linear discriminant analysis, Gaussian mixture model, and ridge regression classifier
Figure 4.
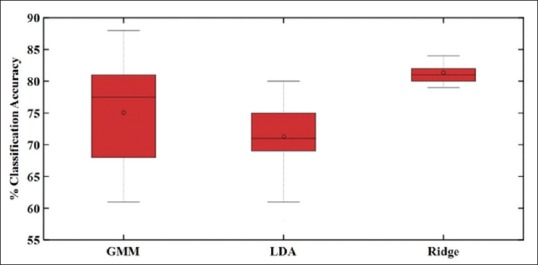
Our classification result with linear discriminant analysis, Gaussian mixture model, and ridge regression classifiers for both common spatial pattern and log-band pass features
Table 4.
Comparison of our best classification result (common spatial pattern + ridge regression) with another recent approach which used Graz Dataset 2a
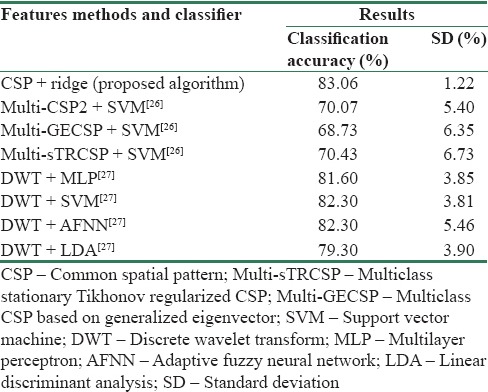
Figure 5.
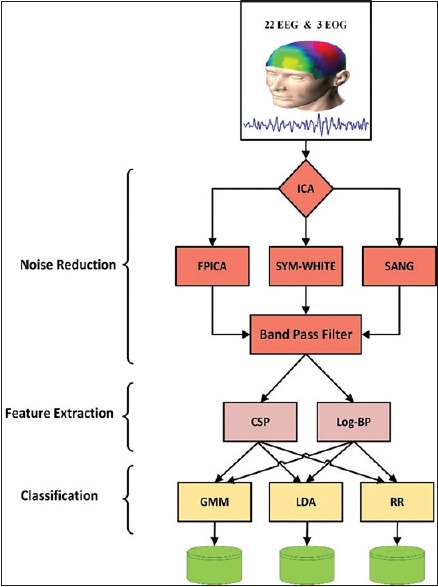
The novelty of this paper through block diagram briefly in three phases including noise reduction, features extraction, and classification. In noise reduction phase, independent component analysis and band-pass filter were used sequentially
Discussion
BCIs can provide communication and control to totally paralyzed people.[26] As one of the applications, the artificial hand can be noted. Furthermore, it employed control machines. Hence, processing and analysis of brain signals to achieve these goals is important. Two major phases in body mass index are feature extraction and classification. Several methods have been proposed in this regard. Wei-Yen Hsu proposes an adaptive neural-fuzzy analysis system for single-trial classification of the MI of EEG data.[27] The authors have used enhanced active segment selection and wavelet-fractal features, and the adaptive fuzzy-neural-network (AFNN) for the recognition of the left and right MI data. They have compared his approach with three supervised classifiers that are prevailing approaches and have been shown to bring noticeable results in BCI studies as well. They are LDA, multilayer perceptron, and SVM. The best average recognition rates (82.3%) are acquired with SVM and AFNN while using LDA provides the worst average recognition rate about 79.3% [Figure 4]. In addition, in another recent study by Yi et al., with different types of well-known CSP features including multi-class CSP based on generalized eigenvector (multi-GECSP) and multiclass stationary Tikhonov regularized CSP (multi-sTRCSP), has presented the classification rates as 70.07, 68.73, and 70.43, respectively.[28] However, in the present study, the most important method of pattern recognition and classification of brain signals has been tested and evaluated. In the feature extraction phase, two common methods, CSP and log-BP, have been used.[29] Furthermore, LDA, GMM, and RR have been used as classification methods.[21] For this purpose, Dataset 2a from the BCI Competition IV is used, which has been provided by the Graz University of Technology (Austria). One of the good features of this database is the added EOG noise as an artifact. Different methods are used for removing these noises. ICA and 8–40 Hz band-pass filter obtained the best outcome.
These four tasks involved specific areas of the brain separately, and therefore, brain signals and the added noise of each task are recorded from separate sources. Since the source of the original signals and noise sources has profound differences, it is predictable that the use of ICA in separating operation should have great performance. In conducting evaluations, ICA and filters have been tested and evaluated for noise separation individually. The results indicate that the use of filters alone has worse performance. While there are some low-frequency noises, the mixed band-pass filter with ICA has been used owing to the elimination of undesirable low-frequency signals. However, the SYM-WHITE ICA algorithm has the best performance in artifact removal, thanks to the different noise and signal sources. Both SIR and time are lower than other methods.
From the results, classification rates using CSP and log-BP feature extraction algorithms were 50 and 60, respectively. However, when GMM has been used, CSP has worse performance than log-BP. However, it shows better performance with LDA and RR algorithms. Therefore, it is clear that CSP algorithms have better performance for feature extraction. Furthermore, the results reveal that in the classification step, the RR algorithm has the best performance, followed by GMM and LDA, respectively, in this regard.
The average classification rate of CSP + RR for all patients is about 83.06%, with a standard deviation of 1.22%, which is the highest classification rate and lowest standard deviation among the past studies in nine patients using the Graz Dataset 2a. In comparison with Hsu,[27] in addition to obtaining better results, it should be noted that the evaluated patients of this paper are 50% more than those in Hsu's study, so the results obtained in this study have more reliability. It is worth mentioning that more patients contribute to less chance for the unique method, designing with more classification rate. Furthermore, compared to Yi et al.,[28] multi-CSP2, multi-GECSP, and multi-sTRCSP methods have lower classification rates with higher standard deviations. This implies that the aforementioned methods have lower reliability.
Conclusion
In this paper, a complete approach was proposed for detecting the differences among four kinds of limb MI in terms of EEG patterns. This approach mainly consists of artifact removal, feature extraction, and classification. The experimental results demonstrate that the ICA method can greatly remove the EOG artifacts. Furthermore, feature extraction by the CSP method and RR classifier improves the performance. Hence, it is worth bearing in mind that the proposed approach has splendid potential in real-time applications of BCI work. Future works will be conducted to improve the proposed approach. It should be noted that dreaming is one of the most challenging issues these days. Recent studies in this regard have shown that spindles regarding 10–16 Hz are supercritical in the quality of sleep. In addition, these studies have shown that the power of these bands increases dramatically. In this paper, the detection and recognition of MI movements of the body, which are one of the most substantial functions of dreaming, are studies and hence, the results of this paper could be investigated to assess the phenomena of dreaming as well.
Financial support and sponsorship
Nil.
Conflicts of interest
There are no conflicts of interest.
References
- 1.Yang Y. EEG signal analysis for brain-computer interfaces for large public applications. Paris: Télécom ParisTech; 2013. [Google Scholar]
- 2.Hiremath SV, Chen W, Wang W, Foldes S, Yang Y, Tyler-Kabara EC, et al. Brain computer interface learning for systems based on electrocorticography and intracortical microelectrode arrays. Front Integr Neurosci. 2015;9:40. doi: 10.3389/fnint.2015.00040. [DOI] [PMC free article] [PubMed] [Google Scholar]
- 3.Hassanien AE, Azar AA. Brain-Computer Interfaces. Switzerland: Springer; 2015. [Google Scholar]
- 4.Leeb R, Friedman D, Müller-Putz GR, Scherer R, Slater M, Pfurtscheller G. Self-paced (asynchronous) BCI control of a wheelchair in virtual environments: A case study with a tetraplegic. Comput Intell Neurosci. 2007;2007:79642. doi: 10.1155/2007/79642. [DOI] [PMC free article] [PubMed] [Google Scholar]
- 5.Nicolas-Alonso LF, Gomez-Gil J. Brain computer interfaces, a review. Sensors (Basel) 2012;12:1211–79. doi: 10.3390/s120201211. [DOI] [PMC free article] [PubMed] [Google Scholar]
- 6.Lin CJ, Hsieh MH. Classification of mental task from EEG data using neural networks based on particle swarm optimization. Neurocomputing. 2009;72:1121–30. [Google Scholar]
- 7.McFarland DJ, Anderson CW, Müller KR, Schlögl A, Krusienski DJ. BCI meeting 2005 – Workshop on BCI signal processing: Feature extraction and translation. IEEE Trans Neural Syst Rehabil Eng. 2006;14:135–8. doi: 10.1109/TNSRE.2006.875637. [DOI] [PubMed] [Google Scholar]
- 8.Lins OG, Picton TW, Berg P, Scherg M. Ocular artifacts in recording EEGs and event-related potentials. II: Source dipoles and source components. Brain Topogr. 1993;6:65–78. doi: 10.1007/BF01234128. [DOI] [PubMed] [Google Scholar]
- 9.Boye AT, Kristiansen UQ, Billinger M, do Nascimento OF, Farina D. Identification of movement-related cortical potentials with optimized spatial filtering and principal component analysis. Biomed Signal Process Control. 2008;3:300–4. [Google Scholar]
- 10.Ruiting Y, Gray DA, Ng BW, Mingyi H. Comparative Analysis of Signal Processing in Brain Computer Interface. Proceedings of the 4th IEEE Conference on Industrial Electronics and Applications (ICIEA’09), Xi’an, China. 2009 May;:580–5. [Google Scholar]
- 11.Liao X, Yao D, Wu D, Li C. Combining spatial filters for the classification of single-trial EEG in a finger movement task. IEEE Trans Biomed Eng. 2007;54:821–31. doi: 10.1109/TBME.2006.889206. [DOI] [PubMed] [Google Scholar]
- 12.Cover TM. Geometrical and statistical properties of systems of linear inequalities with applications in pattern recognition. IEEE Trans Electron Comput. 1965;EC-14:326–34. [Google Scholar]
- 13.Garcia GN, Ebrahimi T, Vesin JM. Support Vector EEG Classification in the Fourier and Time-frequency Correlation Domains. Proceedings of the First International IEEE EMBS Conference on Neural Engineering (NER’03), Capri Island, Italy. 2003 Mar;:591–4. [Google Scholar]
- 14.Bashashati A, Fatourechi M, Ward RK, Birch GE. A survey of signal processing algorithms in brain-computer interfaces based on electrical brain signals. J Neural Eng. 2007;4:R32–57. doi: 10.1088/1741-2560/4/2/R03. [DOI] [PubMed] [Google Scholar]
- 15.Comon P, Jutten C. Handbook of Blind Source Separation: Independent Component Analysis and Applications. Amsterdam: Academic Press; 2010. [Google Scholar]
- 16.Herman P, Prasad G, McGinnity TM, Coyle D. Comparative analysis of spectral approaches to feature extraction for EEG-based motor imagery classification. IEEE Trans Neural Syst Rehabil Eng. 2008;16:317–26. doi: 10.1109/TNSRE.2008.926694. [DOI] [PubMed] [Google Scholar]
- 17.Schalk G, Brunner P, Gerhardt LA, Bischof H, Wolpaw JR. Brain-computer interfaces (BCIs): Detection instead of classification. J Neurosci Methods. 2008;167:51–62. doi: 10.1016/j.jneumeth.2007.08.010. [DOI] [PubMed] [Google Scholar]
- 18.Izenman AJ. Linear discriminant analysis. Modern Multivariate Statistical Techniques. New York: Springer; 2013. pp. 237–80. [Google Scholar]
- 19.Pfurtscheller G, Neuper C, Guger C, Harkam W, Ramoser H, Schlögl A, et al. Current trends in Graz brain-computer interface (BCI) research. IEEE Trans Rehabil Eng. 2000;8:216–9. doi: 10.1109/86.847821. [DOI] [PubMed] [Google Scholar]
- 20.Vidaurre C, Schlögl A, Cabeza R, Scherer R, Pfurtscheller G. Study of on-line adaptive discriminant analysis for EEG-based brain computer interfaces. IEEE Trans Biomed Eng. 2007;54:550–6. doi: 10.1109/TBME.2006.888836. [DOI] [PubMed] [Google Scholar]
- 21.He J, Ding L, Jiang L, Ma L, editors. Kernel ridge regression classification. 2014 International Joint Conference on Neural Networks (IJCNN) IEEE; 2014. [Google Scholar]
- 22.Eskidere Ö. Source microphone identification from speech recordings based on a Gaussian mixture model. Turk J Electr Eng Comput Sci. 2014;22:754–67. [Google Scholar]
- 23.Reynolds D. Gaussian mixture models. Encyclopedia of Biometrics. USA: Springer; 2015. pp. 827–32. [Google Scholar]
- 24.Brunner C, Leeb R, Müller-Putz G, Schlögl A, Pfurtscheller G. BCI Competition 2008 – Graz Data Set A. Austria: Institute for Knowledge Discovery (Laboratory of Brain-Computer Interfaces), Graz University of Technology. 2008:136–42. [Google Scholar]
- 25.Sahar S, Karim F, Mahmood A, Mohammad R. Evaluation of less common independent component analysis algorithms for brain computer interface preprocessing. Int J Mechatron Electr Comput Technol. 2015;5:2424–32. [Google Scholar]
- 26.Hasan BA, Gan JQ. Hangman BCI: An unsupervised adaptive self-paced brain-computer interface for playing games. Comput Biol Med. 2012;42:598–606. doi: 10.1016/j.compbiomed.2012.02.004. [DOI] [PubMed] [Google Scholar]
- 27.Hsu WY. Motor imagery electroencephalogram analysis using adaptive neural-fuzzy classification. Int J Fuzzy Syst. 2014;16:111–20. [Google Scholar]
- 28.Yi W, Qiu S, Qi H, Zhang L, Wan B, Ming D. EEG feature comparison and classification of simple and compound limb motor imagery. J Neuroeng Rehabil. 2013;10:106. doi: 10.1186/1743-0003-10-106. [DOI] [PMC free article] [PubMed] [Google Scholar]
- 29.Song X, Yoon SC. Improving brain-computer interface classification using adaptive common spatial patterns. Comput Biol Med. 2015;61:150–60. doi: 10.1016/j.compbiomed.2015.03.023. [DOI] [PubMed] [Google Scholar]


