Abstract
Recognition of white blood cells (WBCs) is the first step to diagnose some particular diseases such as acquired immune deficiency syndrome, leukemia, and other blood-related diseases that are usually done by pathologists using an optical microscope. This process is time-consuming, extremely tedious, and expensive and needs experienced experts in this field. Thus, a computer-aided diagnosis system that assists pathologists in the diagnostic process can be so effective. Segmentation of WBCs is usually a first step in developing a computer-aided diagnosis system. The main purpose of this paper is to segment WBCs from microscopic images. For this purpose, we present a novel combination of thresholding, k-means clustering, and modified watershed algorithms in three stages including (1) segmentation of WBCs from a microscopic image, (2) extraction of nuclei from cell’s image, and (3) separation of overlapping cells and nuclei. The evaluation results of the proposed method show that similarity measures, precision, and sensitivity respectively were 92.07, 96.07, and 94.30% for nucleus segmentation and 92.93, 97.41, and 93.78% for cell segmentation. In addition, statistical analysis presents high similarity between manual segmentation and the results obtained by the proposed method.
Keywords: K-means clustering, segmentation, thresholding, watershed algorithm, white blood cells
Introduction
Blood is a constantly circulating fluid through the body and half of the blood volume is composed of the red blood cells (RBCs), white blood cells (WBCs), and platelets. WBCs contain nucleus and cytoplasm which can be divided into four main groups: neutrophils, basophils, lymphocytes, and monocytes. WBCs are a momentous part of the immune system, so extracting information from them can assist pathologists in diagnosis of different diseases such as acquired immune deficiency syndrome, leukemia, and other blood-related diseases.[1] The screening of prepared blood samples by pathologists for counting and classification of WBCs is tedious, slow, and time-consuming. Consequently, an automatic system based on image processing techniques is useful for aiding pathologists.[2]
Meanwhile, segmentation is one of the main steps in microscopic image analysis that the result of this step directly influences in the outcomes of the following steps such as feature extraction and classification. In the past few years, various approaches have been presented for WBC segmentation so that each of them could have its relative advantages and disadvantages. Among these approaches, some of them have been proposed only for either nucleus or cell segmentation[3,4,5,6,7,8,9,10,11,12,13,14,15] while several of them presented both nucleus and cytoplasm segmentation.[16,17,18,19,20,21]
Among segmentation methods, thresholding is one of the simplest methods that has been used autonomously or in collaboration with other approaches to cell segmentation. For example, in Mohamed et al.[3] and Wu et al.,[4] Otsu thresholding[5] was applied to segment nuclei of WBCs, or in Tosta et al.[6] a thresholding algorithm, called neighborhood valley-emphasis Fan and Lei,[7] was performed to extract nuclei of microscopic images. Segmentation based on clustering is a popular method for extracting regions of microscopic images. For example, in Soltanzadeh et al.,[8] an unsupervised k-means clustering algorithm was employed to detect nuclei, and then curvelet transform[9] was applied to extract the candidate locations of chromatins and nucleoli. In addition, in Sarrafzadeh et al.[10] or Ghosh et al.,[11] a fuzzy c-means clustering[12] was applied on images to segment nuclei.
The above-mentioned papers focus only on nucleus segmentation. Moreover, some methods have been introduced based on cell segmentation. For instance in Liao and Deng,[13] locating accurate WBC contour has been identified using a shape analysis based on a rough boundary obtained by thresholding. Moreover, in Ongun et al.,[14] segmentation of the WBCs in a microscopic image was done using active contour and morphological operators. Furthermore, in Sinha and Ramakrishnan,[15] the authors have used k-means clustering on the hue, saturation, and value color space for WBCs segmentation.
In the following, some efforts on both nucleus and cytoplasm segmentation are reported. Active contour model (ACM) or snake is one of the famous methods for image segmentation that was firstly introduced by Kass et al.,[16] and this model has been extensively used for the segmentation of cells. For example, in Sadeghian et al.,[17] a robust color gradient vector flow (GVF) ACM has been applied for the nucleus and cytoplasm segmentation, or in Yang et al.,[18] segmentation of the nuclei was done using GVF, and segmentation of cytoplasm was done using Zack thresholding[19] after removing the nucleus region. In Rezatofighi and Soltanian-Zadeh,[20] another paper based on snake model has been reported for both nucleus and cytoplasm segmentation. They used a thresholding algorithm based on the Gram–Schmidt orthogonalization method to nucleus segmentation. Then, they extracted the cytoplasm by the snake model. However, active contour methods have high computational complexity and some issues to select primary contour. In addition, in Sarrafzadeh and Dehnavi,[21] extraction of nucleus and cytoplasm was done by k-means algorithm. Then a method based on region growing was applied to separate the connected nuclei. But, region growing of this algorithm relies on the information of edges and cannot to separate the connected nuclei more accurately in weak edges. Furthermore, a review of segmentation methods in Xing and Yang[22] has been investigated for nucleus or cell detection.
In this paper, we propose a simple method based on a novel combination of image processing techniques to efficiently segment both nucleus and cytoplasm of WBCs in microscopy images. In the proposed method, after a novel contrast normalization of the input image, the WBCs are segmented by thresholding in the first step. Next, k-means method is applied for nucleus segmentation. Then, to solve the problems of all connected nuclei and cells, two modified watershed algorithms,[23,24] are implemented, and all of them are separated.
The remainder of this paper is organized as follows. In the next section, the proposed method is introduced. Experimental data and results of the proposed methods are explained in the experimental data and results section. Finally, the paper is concluded in the conclusion section.
Materials and Methods
Segmentation is one of the fundamental tasks in the microscopic image analysis. The purpose of segmentation in the microscopic image is to separate image into four different regions, namely: background, RBCs, cytoplasm, and nucleus of WBCs. To segment WBCs and nuclei of them, we proposed a three-part algorithm including cell segmentation, nucleus segmentation, and splitting of touching nuclei and cell. Block diagram of the proposed method is presented in Figure 1, and each part of this algorithm is described in the following of this section.
Figure 1.
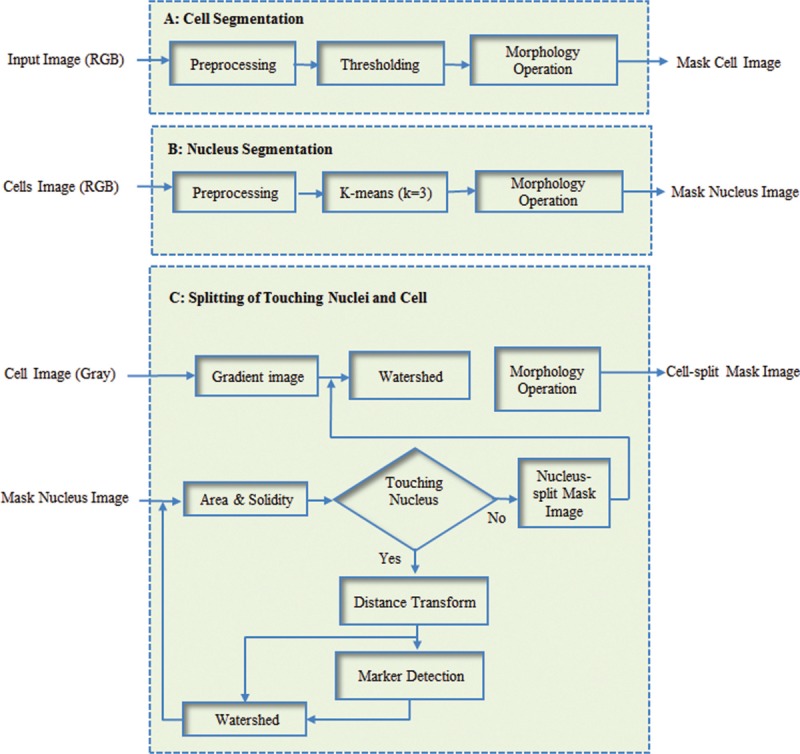
Block diagram of the proposed method. (A) Cell segmentation; (B) nucleus segmentation; and (C) splitting of touching nuclei and cells
Cell segmentation
In this part, the segmentation technique is explained to extract the WBCs from the blood smear images. The proposed algorithm for cell segmentation includes three subparts: preprocessing, thresholding, and morphological operations. These steps are explained in detail as follows.
Preprocessing
To increase the contrast of our images, we propose a color adjustment method, based on color transform. First, the image is converted from red, green, and blue (RGB) color space to cyan, magenta, yellow, and black (CMYK) color space. In this color space, the contrast of WBCs in the Y component is more than other components.[25] Consequently, we choose this band for segmentation process. The CMYK components of the image from our database are shown in Figure 2b–e. Next, the WBCs are enhanced by our proposed method as:
Figure 2.
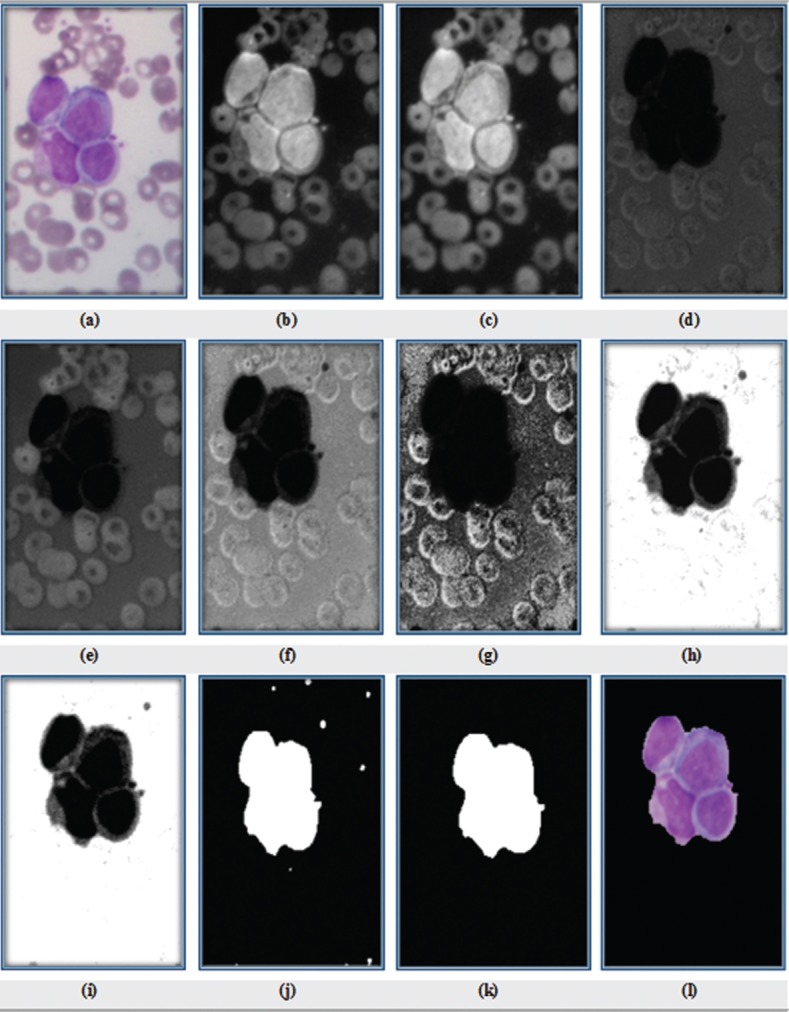
(a) Original RGB image; (b) C sub-band; (c) M sub-band; (d) Y sub-band; (e) K sub-band; (f) linear contrast stretching of Y image (L); (g) histogram equalization of Y image (H); (h) enhanced image; (i) filtered image of h; (j) mask cells after thresholding; (k) result of cell segmentation after applying morphological operations; and (l) RGB image of cells
EI = 2 × L + H (1)
where EI is the enhanced image, L is linear contrast stretching of Y image, and H is histogram equalization of Y image. Equation (1) has been obtained after testing several combinations of contrast enhancement methods with different coefficients on our data set. This equation has best result for our data set. After enhancing the contrast, a 3 × 3 minimum filter[23] is applied to decrease spot noise. Minimum filter is repeated three times for getting the best result. The result of the enhancement procedure of Figure 2d is presented in Figure 2f–i.
Thresholding
In the proposed method, the Otsu thresholding method is used to extract WBCs. The segmentation results of WBCs are indicated in Figure 2j.
Morphological operations
After thresholding, various morphological operations are applied on the WBC image to remove false objects, smooth edge, and purify cell mask. The morphological opening operation is done with a 11 pixel-diameter disk followed by closing with a 28 pixel-diameter disk to clear the border of WBCs and fill holes to enhance the segmentation results. This pixel-diameter is selected based on the resolution of input image. Then, to remove extra objects, the objects with area lower than 30,000 pixels are ignored. This threshold value has been determined according to the minimum size of WBCs. The result of applying morphological operations has been presented in Figure 2k and RGB image of cells has been shown in Figure 2l.
Nucleus segmentation
The proposed method for nucleus segmentation is indicated in Figure 1. Nucleus segmentation algorithm is performed in three steps. We describe these steps as preprocessing, k-mean algorithm, and morphological operations in the next subparts.
Preprocessing
In this subpart our goal is to segment the nuclei. The darker regions of cells are corresponding to nuclei. The nuclei are represented in L*a*b* color space better than RGB color space. So, the image is converted from RGB color space [Figure 3a] to L*a*b* color space. In this color space, the intensity is represented by lightness (L*), and two color channels are denoted by (a*) and (b*). L*a*b* color domain can discriminate nuclei from the cell image. Figure 3b–e indicates the L*a*b* image of Figure 3a and their sub-bands.
Figure 3.

(a) RGB image of cells; (b) L*a*b* image; (c) L* sub-band; (d) a* sub-band; (e) b* sub-band; (f) cluster 1: cytoplasm; (g) cluster 2: nucleus; and (h) binary image of nucleus cluster
K-means
We use k-means[26] algorithm with three clusters using Euclidean distance metric on a* and b* subspaces. The a* and b* color domains can discriminate nuclei from cytoplasm in the cell image. In microscopic images of blood cells, the nuclei are darker than the other parts of cell and consequently, so we select the cluster with the minimum of the mean value of b* channel in L*a*b* color space as candidate of nucleus. Two clusters corresponding to cytoplasm and nucleus are displayed in Figure 3f and g, respectively.
Morphological operations
After segmentation of nucleus, we use morphological operation to clear the mask of nucleus. To remove small objects connected to mask, the morphological opening operation is used with a 5 pixel-diameter disk followed by closing with an 8 pixel-diameter disk to join disconnected pixels of mask and fill holes to enhance the segmentation results. Then, the objects lower than 200 pixels are omitted. The binary image of nucleus cluster is shown in Figure 3h.
Splitting of touching nuclei and cells
One common challenge in the segmentation of cell is to separate touching multiple nuclei and/or cells in microscopic images. Thus, in third section of the proposed algorithm, we introduce an algorithm to separate them. In the first stage of the proposed algorithm, all touching nuclei are split. The proposed method includes two steps: (1) detection overlapping nuclei and (2) separation of overlapping nuclei.
For the detection of the overlapping nuclei, the area[27] and solidity[10] features of the nuclei are evaluated. The area of an object can be defined by counting all the pixels in the object that is calculated as (2), and solidity is a scalar that is computed as (3).

For touched nuclei, area is more than 5000 pixels and solidity is more than 0.7. Figure 4b demonstrates the application of our method to select touching nuclei in the nuclei’s mask [Figure 4a]. In step 2, we separate touching nuclei by a modified watershed transform method.[23] At first, to perform this purpose, the distance transform of touching nuclei mask is computed. The distance transform of a binary image is a distance from every pixel to the nearest nonzero-valued pixel. Figure 4c shows inverse of the distance transform (D1) of the touching nuclei image. Then to perform splitting, the watershed algorithm is used. When the watershed algorithm is directly applied on D1, undesirable over-segmentation results are produced as shown in Figure 4d. This problem is solved by modifying the distance transform. To do this work, the Matlab function, imextendedmin, is applied on the inverse of the inner distance to filter tiny local minima and obtain a marker as mask [Figure 4e]. Next, D1 is imposed to obtained marker mask. Consequently, the obtained image has only minima at the desired locations, and then watershed transform is utilized on it. The result of watershed transform has been shown in Figure 4f.
Figure 4.
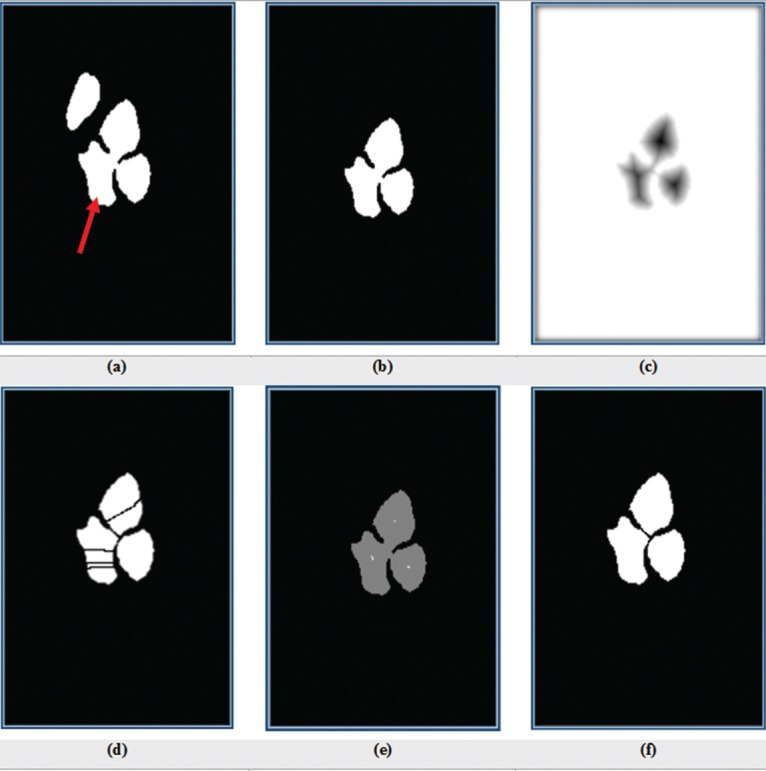
(a) Binary image of nuclei (red arrow shows touching nuclei); (b) binary image of touching nuclei; (c) inverse of the distance transform of b; (d) applying watershed on c; (e) identified markers, each of them represents a single nuclei location; and (f) binary image of nuclei splitting after imposing e on c and applying watershed on it
For cell splitting, the watershed algorithm based on previous method cannot separate cells correctly. Therefore, another modified watershed transform based on gradient method[28] is used. For achieving best accuracy in cell splitting, at first, RGB image of WBCs [Figure 2l] which is extracted from cell segmentation step, is converted to the gray level image [Figure 5a]. Next, the Sobel operator[23] is applied to obtain gradient image as shown in Figure 5b. Directly employ of the watershed transform to the gradient image will cause over segmentation [Figure 5c]. To prevent over segmentation, we utilize watershed algorithm based on marker-controlled using the gradient image. To perform it, the regional maximums[29] of the gradient image [Figure 5d] are obtained to eliminate all maximums that exist within the nuclei. Next, the splitted nuclei-mask image is imposed to it as shown in Figure 5e. Then watershed transform is applied on the obtained image. The result of splitted cell mask image has been exposed in Figure 5i.
Figure 5.
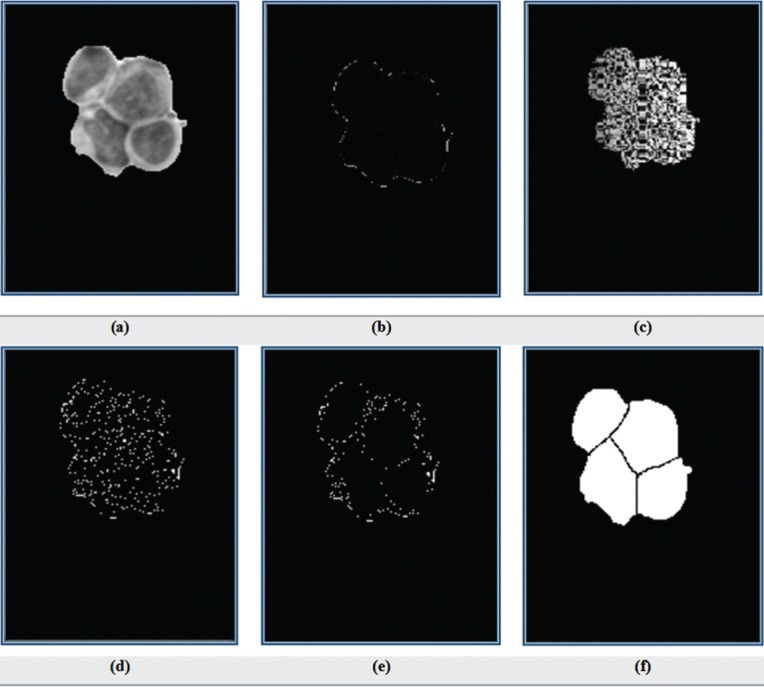
(a) Gray level image of cells; (b) gradient image of a; (c) applying watershed on b; (d) regional maximums of gradient image; (e) imposing binary image of nuclei splitting mask on d; and (f) output of watershed on e
Experimental Data and Results
In this study, blood samples were taken of six normal patients. Images were obtained from microscope slides by a light microscope after smeared and stained by Gismo. The WBC images of laboratory slides were captured with Nikon1 V1 camera which is mounted on Nikon Eclipse 50i microscope with a total magnification of 1000. The data set contains 45 images with 431 of WBCs. All images are in RGB color space and saved in the JPG format with 3024 × 4032 pixels and they were prepared by a pathologist expert in the Al-Zahra Hospital, Isfahan, Iran.
To indicate the strength of the proposed methods rather than previous approaches, we compared the proposed method with one of the recent works[24] for segmentation of WBCs. Figure 6 shows the results of manual segmentation and automatic segmentation. In this figure, the green contours are the borders of nuclei and the red contours are the borders of cells. Selected images with different color condition are displayed in Figure 6 (column 1). Second column of Figure 6 indicates the borders of manual segmentation. The results of automatic segmentation (our algorithm) have been shown in Figure 6 (column 3). As it is visible in columns 2 and 3, the automatic segmentation results of the proposed method are fairly close to the manual segmentation result with high accuracy. The segmentation results of applying Saeedizadeh et al. method[24] on our data set have been shown in Figure 6 (column 4). As seen in this column, row 1, the nuclei in the image, due to color similarity of cytoplasm and background, were not identified. In addition, in this column, row 1 and row 2, the Saeedizadeh et al. algorithm could not separate the nuclei and cells. Thus, by comparing column 3 with column 4 of Figure 6, it can be obviously seen that our proposed scheme could yield better performance than the method of Saeedizadeh et al.[24]
Figure 6.
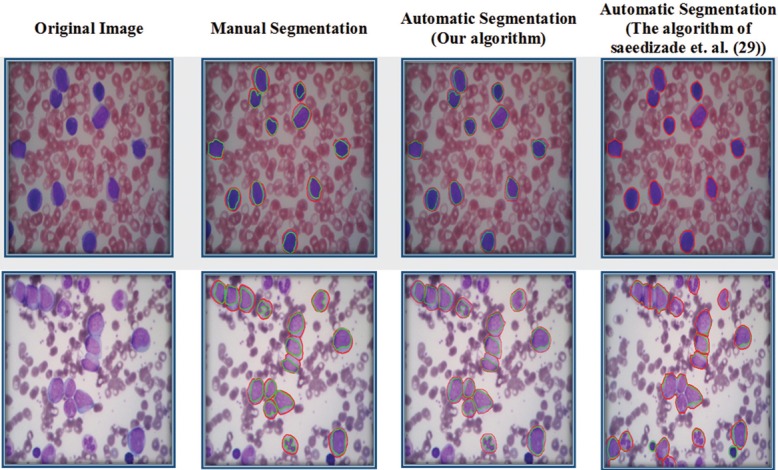
From left to right: original images, visual results of manual segmentation by the expert, results of automatic segmentation by proposed method, and results of automatic segmentation by the algorithm of Saeedizadeh et al.[24]
To evaluate the proposed algorithm, we calculated similarity measures (Ts), sensitivity, and precision as performance measures between the manual segmentation by the expert and the results obtained using the proposed approach. Definitions of the evaluation parameters and calculated results corresponding to them have been presented in Table 1. In formulae of Ts, Aautomatic is the area of the binary image detected by algorithm, Amanual is the area of the binary image detected by manual segmentation. Ts is 100, when these two areas are completely equal.
Table 1.
Performance of evaluation parameters and results

Applied parameters in the calculation of sensitivity and precision in Table 1 are shown in Figure 7. According to the Figure 7a, yellow contour shows the area of automatic segmentation, and gray contour has been drawn by the expert. As seen in the Figure 7b, TP (true positive), green region, displays the correct cell area detected automatically, and the violet region illustrated FP (false positive) that is the incorrect cell area detected automatically. FN (false negative), pink region, indicates the correct cell area that did not detect automatically. Finally, a part of background that is a joint between both manual and automatic segmentation is specified by TN (true negative) or black region.
Figure 7.
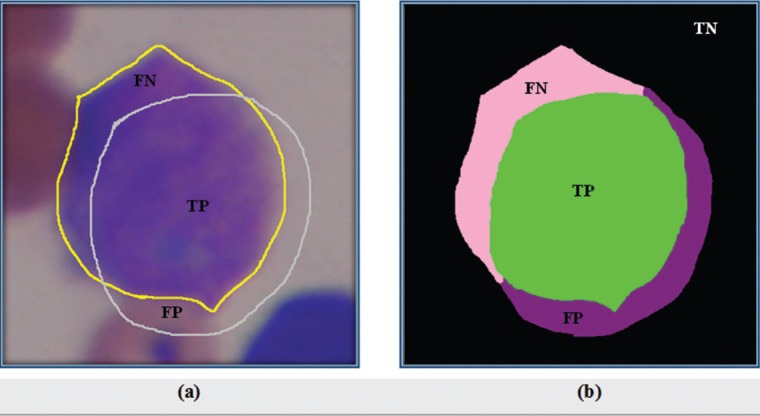
Applied parameters in the evaluation terms
Consequently, as can be seen from Table 1, the calculated results for Ts, precision, and sensitivity respectively were 92.07, 96.07, and 94.30% for nucleus segmentation and 92.93, 97.41, and 93.78% for cell segmentation that demonstrate the good effectiveness of the proposed method for nucleus and cell segmentation.
In addition, we performed the linear regression analyses[30,31] as a powerful technique to consider correlation of our method and ground truth. For this purpose, in each of the 45 images, we calculated the area of WBCs and nuclei that were obtained by using the proposed method and determined by an expert. Then, we performed linear regression analysis for WBCs and nuclei separately. The results are graphically depicted in Figure 8. According to this figure, the slope (S) and correlation coefficient (R) for WBCs were S = 0.9968 and R = 0.9860, respectively [Figure 8a]. In addition, S = 0.9141 and R = 0.9750 have achieved for nuclei [Figure 8b]. The obtained slopes are close to one and the correlation coefficients are more than 0.97. These results verify that there was a strong correlation between the results of proposed method and manual segmentation.
Figure 8.
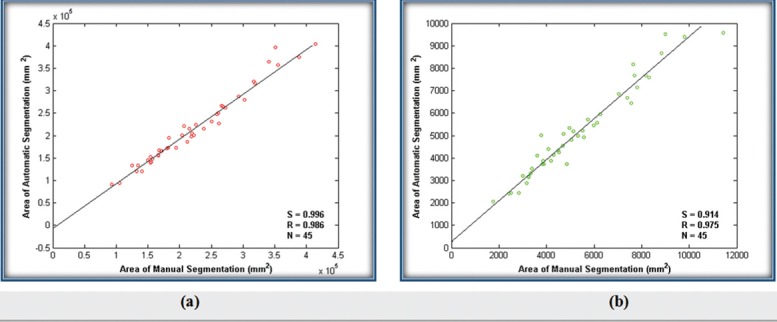
Comparison of manual and automatic segmentation by area for: (a) WBCs and (b) nuclei
Conclusion
In this paper, a simple novel combination image processing method was proposed for the automatic segmentation of both cells and nuclei of WBCs in three steps based on thresholding, k-means clustering, and modified watershed algorithms. The proposed scheme is applied on 431 WBCs of our data set and compared to manual segmentation by three parameters: Ts, sensitivity, and precision in Table 1. According to this table, the results of our algorithm are highly similar to the results of segmentation achieved by the expert. In addition, the statistical analysis by linear regression was performed that verified high correlation and consistency between automatically and manually results. The properly obtained results indicate that this method can be used as suitable tool for helping a pathologist for making diagnosis of diseases. As a future work, we are going to test our method on other data sets and will also try to adaptively determine some parameters of the algorithm.
Financial support and sponsorship
Nil.
Conflicts of interest
There are no conflicts of interest.
References
- 1.Mohan H. Textbook of Pathology. New Delhi: Jaypee Brothers; 2005. [Google Scholar]
- 2.Chastine F, Tangel ML, Widyanto MR, Hirota K. Parameter optimization of local fuzzy patterns based on fuzzy contrast measure for white blood cell texture feature extraction. J Adv Comput Intell Intell Inform. 2012;16:412–9. [Google Scholar]
- 3.Mohamed M, Far B, Guaily A. An efficient technique for white blood cells nuclei automatic segmentation.2012 IEEE International Conference on Systems, Man, and Cybernetics (SMC) IEEE; 2012. pp. 220–5. [Google Scholar]
- 4.Wu J, Zeng P, Zhou Y, Olivier C. A novel color image segmentation method and its application to white blood cell image analysis.2006 8th International Conference on Signal Processing. IEEE; 2006. [Google Scholar]
- 5.Otsu N. A threshold selection method from gray-level histograms. Automatica. 1975;11:23–7. [Google Scholar]
- 6.Tosta TA, de Abreu AF, Travençolo BA, do Nascimento MZ, Neves LA. Unsupervised segmentation of leukocytes images using thresholding neighborhood valley-emphasis. 2015 IEEE 28th International Symposium on Computer-Based Medical Systems. IEEE; 2015. pp. 93–4. [Google Scholar]
- 7.Fan J-L, Lei B. A modified valley-emphasis method for automatic thresholding. Pattern Recognit Lett. 2012;33:703–8. [Google Scholar]
- 8.Soltanzadeh R, Rabbani H, Talebi A. Extraction of nucleolus candidate zone in white blood cells of peripheral blood smear images using curvelet transform. Comput Math Methods Med. 2012;2012:12. doi: 10.1155/2012/574184. Article ID 574184. [DOI] [PMC free article] [PubMed] [Google Scholar]
- 9.Ma J, Plonka G. The curvelet transform. IEEE Signal Process Mag. 2010;27:118–33. [Google Scholar]
- 10.Sarrafzadeh O, Rabbani H, Talebi A, Banaem HU. Selection of the best features for leukocytes classification in blood smear microscopic images. SPIE Medical Imaging. International Society for Optics and Photonics. 2014:90410. [Google Scholar]
- 11.Ghosh M, Das D, Chakraborty C, Ray AK. Automated leukocyte recognition using fuzzy divergence. Micron. 2010;41:840–6. doi: 10.1016/j.micron.2010.04.017. [DOI] [PubMed] [Google Scholar]
- 12.Chaira T, Ray AK. Segmentation using fuzzy divergence. Pattern Recognit Lett. 2003;24:1837–44. [Google Scholar]
- 13.Liao Q, Deng Y. An accurate segmentation method for white blood cell images. Biomedical Imaging, 2002. Proceedings 2002 IEEE International Symposium on IEEE. 2002:245–8. [Google Scholar]
- 14.Ongun G, Halici U, Leblebicioglu K, Atalay V, Erkmen A, Beksaç S. An automated differential blood count system. 23rd Annual International Conference of the IEEE Engineering in Medicine and Biology Society. 2001;3:2583–6. [Google Scholar]
- 15.Sinha N, Ramakrishnan AG. Automation of differential blood count. IEEE Reg 10 Tech Conf Converg Technol Asia-Pacific Reg (TENCON 2003) 2003;2:547–51. [Google Scholar]
- 16.Kass M, Witkin A, Terzopoulos D. Snakes: Active contour models. Int J Comput Vis. 1988;1:321–31. [Google Scholar]
- 17.Sadeghian F, Seman Z, Ramli AR, Abdul Kahar BH, Saripan M-I. A framework for white blood cell segmentation in microscopic blood images using digital image processing. Biol Proced Online. 2009;11:196–206. doi: 10.1007/s12575-009-9011-2. [DOI] [PMC free article] [PubMed] [Google Scholar]
- 18.Yang L, Meer P, Foran DJ. Unsupervised segmentation based on robust estimation and color active contour models. IEEE Trans Inf Technol Biomed. 2005;9:475–86. doi: 10.1109/titb.2005.847515. [DOI] [PubMed] [Google Scholar]
- 19.Zack GW, Rogers WE, Latt SA. Automatic measurement of sister chromatid exchange frequency. J Histochem Cytochem. 1977;25:741–53. doi: 10.1177/25.7.70454. [DOI] [PubMed] [Google Scholar]
- 20.Rezatofighi SH, Soltanian-Zadeh H. Automatic recognition of five types of white blood cells in peripheral blood. Comput Med Imaging Graph. 2011;35:333–43. doi: 10.1016/j.compmedimag.2011.01.003. [DOI] [PubMed] [Google Scholar]
- 21.Sarrafzadeh O, Dehnavi AM. Nucleus and cytoplasm segmentation in microscopic images using K-means clustering and region growing. Adv Biomed Res. 2015;4:174–84. doi: 10.4103/2277-9175.163998. [DOI] [PMC free article] [PubMed] [Google Scholar]
- 22.Xing F, Yang L. Robust nucleus/cell detection and segmentation in digital pathology and microscopy images: A comprehensive review. IEEE Rev Biomed Eng. 2016;9:234–63. doi: 10.1109/RBME.2016.2515127. [DOI] [PMC free article] [PubMed] [Google Scholar]
- 23.Gonzalez RC, Woods RE, Masters BR. Digital image processing, third edition. J Biomed Opt. 2009;14:029901. [Google Scholar]
- 24.Saeedizadeh Z, Mehri Dehnavi A, Talebi A, Rabbani H, Sarrafzadeh O, Vard A. Automatic recognition of myeloma cells in microscopic images using bottleneck algorithm, modified watershed and SVM classifier. J Microsc. 2015;261:46–56. doi: 10.1111/jmi.12314. [DOI] [PubMed] [Google Scholar]
- 25.Putzu L, Caocci G, Di Ruberto C. Leucocyte classification for leukaemia detection using image processing techniques. Artif Intell Med. 2014;62:179–91. doi: 10.1016/j.artmed.2014.09.002. [DOI] [PubMed] [Google Scholar]
- 26.Verma NK, Roy A, Vasikarla S. Medical image segmentation using improved mountain clustering technique version-2. Information Technology: New Generations (ITNG), 2010 Seventh International Conference on IEEE. 2010:156–61. [Google Scholar]
- 27.Olson E. Particle shape factors and their use in image analysis − Part 1: Theory. J GXP Compliance. 2011;15:85. [Google Scholar]
- 28.Bala A. An improved watershed image segmentation technique using MATLAB. Int J Sci Eng Res. 2012;3:1–4. [Google Scholar]
- 29.Gonzalez RC, Woods RE. Digital Image Processing. 3rd ed. NJ: Prentice Hall; 2008. [Google Scholar]
- 30.Seber GA, Lee AJ. Linear Regression Analysis. John Wiley & Sons; 2012. [Google Scholar]
- 31.Vard A, Jamshidi K, Movahhedinia N. An automated approach for segmentation of intravascular ultrasound images based on parametric active contour models. Australas Phys Eng Sci Med. 2012;35:135–50. doi: 10.1007/s13246-012-0131-7. [DOI] [PubMed] [Google Scholar]


