Abstract
Mycobacterium tuberculosis (Mtb) can persist in the human host in a latent state for decades, in part because it has the ability to withstand numerous stresses imposed by host immunity. Prior studies have established the essentiality of the periplasmic protease MarP for Mtb to survive in acidified phagosomes and establish and maintain infection in mice. However, the proteolytic substrates of MarP that mediate these phenotypes were unknown. Here, we used biochemical methods coupled with supravital chemical probes that facilitate imaging of nascent peptidoglycan to demonstrate that during acid stress MarP cleaves the peptidoglycan hydrolase RipA, a process required for RipA's activation. Failure of RipA processing in MarP‐deficient cells leads to cell elongation and chain formation, a hallmark of progeny cell separation arrest. Our results suggest that sustaining peptidoglycan hydrolysis, a process required for cell elongation, separation of progeny cells, and cell wall homeostasis in growing cells, may also be essential for Mtb's survival in acidic conditions.
Keywords: acid resistance, mycobacteria, peptidoglycan, protease
Subject Categories: Microbiology, Virology & Host Pathogen Interaction; Post-translational Modifications, Proteolysis & Proteomics
Introduction
The alarming rise of antibiotic resistance has challenged the efficacy of antimicrobial therapies and underscored the need for new therapeutics. This need is particularly acute for tuberculosis (TB), the leading bacterial cause of death worldwide in 2014 (http://www.who.int/tb/en).
The etiologic agent of TB, Mycobacterium tuberculosis (Mtb), is a facultative intracellular pathogen that enters the human host through the airways and initially colonizes the lungs. In pulmonary alveoli, macrophages and dendritic cells phagocytize invading microbes and sequester them in a phagosome, a specialized cellular compartment where they are usually eliminated. During its maturation, the phagosome acquires bactericidal properties and intraphagosomal microbes are exposed to reactive oxygen and nitrogen species, antimicrobial peptides, acidic pH, and nutrient deprivation (Flannagan et al, 2009; Weiss & Schaible, 2015). Mtb can stall the maturation of the phagosome until macrophages have been activated by the T‐cell‐derived cytokine IFN‐γ, enhancing acidification of the phagosomal milieu, a stress with which Mtb must cope to survive (Schaible et al, 1998; Via et al, 1998; MacMicking et al, 2003). Moreover, Mtb and M. marinum have been found in acidic phagolysosomes early during infection of mice and zebrafish larvae (Levitte et al, 2016).
To withstand acidic environments, Mtb requires the serine protease MarP (Mycobacterium acid resistance protease). Mtb that lacks MarP (ΔmarP) is hypersensitive to acidic pH and fails to maintain its intracellular neutral pH when subjected to pH 4.5 (Vandal et al, 2008). The MarP‐deficient mutant is attenuated in immunocompetent mice. It did not replicate to the same extent as wild‐type (WT) Mtb and failed to persist during chronic infection (Vandal et al, 2008). Similarly, M. marinum lacking the homolog of MarP does not survive in acidified phagosomes and is unable to successfully establish infection in zebrafish larvae (Levitte et al, 2016). This attenuation phenotype underlined the importance of MarP to cope with host‐imposed stresses in vitro and in vivo. However, the mechanisms by which this protease mediates resistance to acidic environments, including the proteolytic substrates of MarP, remained unknown.
Here, we identified RipA—a peptidoglycan hydrolase (Hett et al, 2008; Martinelli & Pavelka, 2016)—as a MarP substrate. MarP cleaves RipA and this processing is essential for RipA's activity. Using co‐immunoprecipitation, we confirmed that MarP and RipA interact in vivo. Cells lacking MarP or RipA share similar phenotypes; both mutants display increased cell length and form chains when subjected to an acidic condition. Our data suggest that the inability of MarP‐deficient cells to survive acidic stress originates from their incapacity to maintain RipA‐dependent PG hydrolysis.
Results
MarP‐deficient cells elongate during acid stress
First, we determined the impact of pH on the morphology of MarP‐deficient mycobacteria because Mtb ΔmarP is hypersensitive to acid (Vandal et al, 2008; Biswas et al, 2010). We deleted marP in M. smegmatis (Msm; Appendix Fig S1A and B) and verified that the mutant was hypersensitive to acid (Appendix Fig S1C). We subjected WT, ΔmarP, and ΔmarP::marP of Mtb and Msm to minimal media at neutral or acidified pH. Next, we measured the size of bacterial cells along their longitudinal axis. The cell length of Mtb WT and ΔmarP::marP TB cells was similar, either at neutral or at acidic pH. However, Mtb ΔmarP cells elongated when perfused with minimal medium at pH 5 for 7 days (Fig 1A and Appendix Table S1). Although incubation of Msm WT and ΔmarP::marP smeg cells for 24 h at pH 4.5 minimally affected cell length compared to pH 7.2, Msm ΔmarP cells were abnormally long after 24 h of incubation in acidified minimal medium (Fig 1B and Appendix Table S1). Using the supravital fluorescent D‐alanine analog NBD‐amino‐D‐alanine (NADA) that incorporated into the peptidoglycan (PG) of bacteria (Fig EV1A, Appendix Fig S2; Kuru et al, 2012, 2015), we labeled the septa of all three Msm strains that were incubated at pH 7.2 or pH 4.5 for 24 h. Unlike WT and ΔmarP::marP smeg, Msm ΔmarP formed chains at pH 4.5 (Fig 1C). We further quantified the number of septa per bacterium and observed that 33.9% of Msm ΔmarP cells contained at least two septa at pH 4.5, in contrast to only 2.7% and 3.5% for Msm WT and ΔmarP::marP smeg, respectively (Fig 1D).
Figure 1. ΔmarP subjected to acidic medium elongates abnormally.
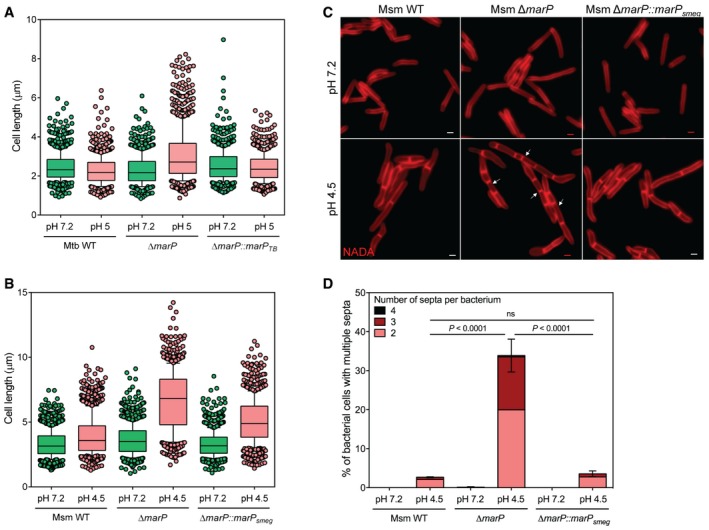
- Boxplot of the lengths (μm) of Mtb WT, ΔmarP, and ΔmarP::marP TB incubated for 7 days in Sauton's medium at pH 7.2 or pH 5 measured in three independent experiments. Lower and upper whiskers extend to the 10th and 90th percentiles, respectively. The middle bar represents the median and the lower and upper box limits are the 25th and 75th percentiles. For Mtb WT pH 7.2, n = 186, 343, 351; pH 5, n = 298, 278, 238. For ΔmarP pH 7.2, n = 210, 183, 422; pH 5, n = 180, 419, 365. For ΔmarP::marP TB pH 7.2, n = 163, 235, 305; pH 5, n = 247, 258, 297. n indicates the number of cells in experiments 1, 2, and 3. Adjusted P‐values compared to WT pH 7.2: ΔmarP pH 7.2, P = 1; ΔmarP::marP TB pH 7.2, P = 5.8 × 10⁻⁴. Adjusted P‐values compared to WT pH 5: ΔmarP pH 5, P = 1.8 × 10−56 ; ΔmarP::marP TB pH 5, P = 1.4 × 10⁻⁶. P‐values have been computed using the Ranksum test adjusted for multiple testing.
- Boxplot of the lengths (μm) of Msm WT, ΔmarP, and ΔmarP::marP smeg incubated for 24 h in Sauton's medium at pH 7.2 or pH 4.5, measured in three independent experiments. Lower and upper whiskers extend to the 10th and 90th percentiles, respectively. The middle bar represents the median and the lower and upper box limits are the 25th and 75th percentiles. For Msm WT pH 7.2, n = 309, 431, 444; pH 4.5, n = 142, 327, 546. For ΔmarP pH 7.2, n = 205, 465, 610; pH 4.5, n = 259, 268, 279. For ΔmarP::marP smeg pH 7.2, n = 249, 464, 577; pH 4.5, n = 239, 358, 234. n indicates the number of cells in experiments 1, 2, and 3. Adjusted P‐values compared to WT pH 7.2: ΔmarP pH 7.2, P = 1.3 × 10⁻⁴ ; ΔmarP::marP smeg pH 7.2, P = 0.22. Adjusted P‐values compared to WT pH 4.5: ΔmarP pH 4.5, P = 3.3 × 10−124 , ΔmarP::marP smeg pH 4.5, P = 4.2 × 10⁻²⁵. P‐values have been computed using the Ranksum test adjusted for multiple testing.
- Representative images of Msm WT, ΔmarP, and ΔmarP::marP TB incubated for 24 h in Sauton's medium at pH 7.2 or pH 4.5 in the presence of 1 mM of the D‐alanine analog NADA (red). Arrows show examples of bacteria that formed chains. Scale bars, 1 μm.
- Quantification of the number of bacteria that contained at least two septa for Msm WT, ΔmarP, and ΔmarP::marP TB after 24 h of incubation at pH 7.2 or pH 4.5 in three independent experiments. Error bars represent SEM. P‐values were determined using a logistic regression model and were adjusted for multiple comparisons.
Figure EV1. Peptidoglycan labeling using the probes HADA and NADA in Mtb and Msm (related to Fig 2).
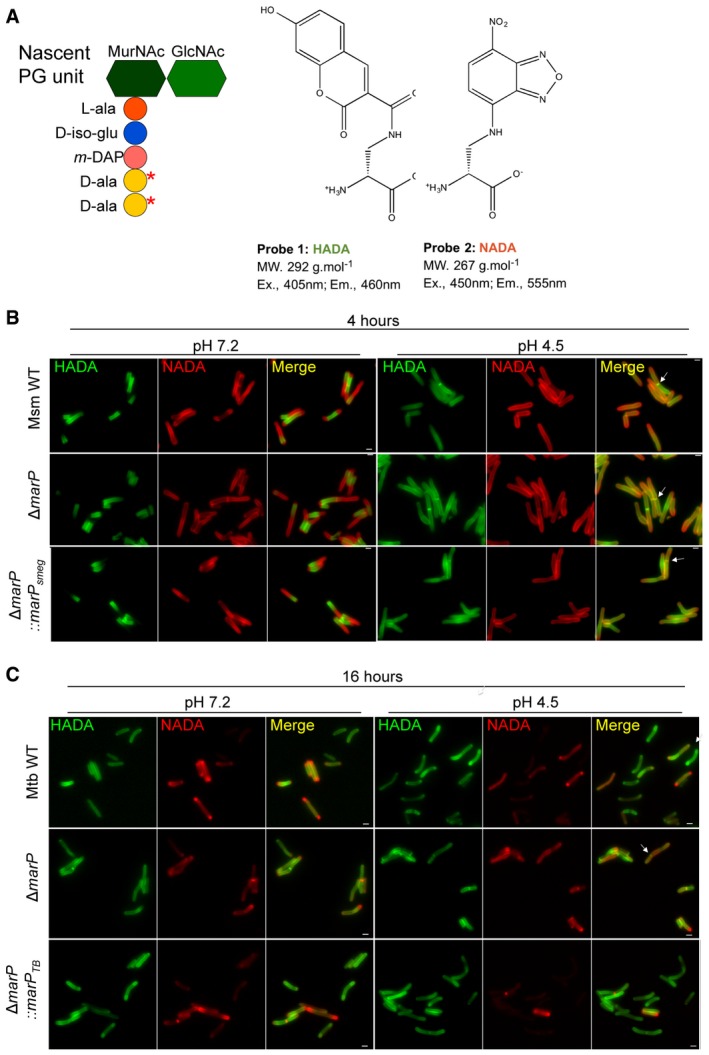
- Schematic representing a PG unit and the structure of the fluorescent D‐alanine analogs HADA and NADA. Red stars indicate where the D‐alanine analogs incorporate. MurNAc, N‐acetylmuramic acid; GlcNAc, N‐acetylglucosamine; L‐ala, L‐alanine; D‐iso‐glu, D‐isoglutamic acid; m‐DAP, meso‐diaminopimelic acid; D‐ala, D‐alanine.
- Representative images of Msm WT, ΔmarP, and ΔmarP::marP smeg incubated in 7H9 medium containing 1 mM HADA for 4 h, washed, and further incubated in Sauton's medium at pH 7.2 or at pH 4.5 containing 1 mM NADA for 4 h. Arrows point to septa labeled with both HADA and NADA. Scale bars, 1 μm.
- Representative images of Mtb WT, ΔmarP TB , and ΔmarP::marP TB incubated in 7H9 medium containing 1 mM HADA for 24 h, washed, and further incubated in Sauton's medium at pH 7.2 or at pH 4.5 containing 1 mM NADA for 16 h. Arrow points to bacterium with a septum. Scale bars, 1 μm.
The separation of progeny cells is impaired in Msm MarP‐deficient cells at acidic pH
The formation of chains of Msm ΔmarP exposed to acidic medium suggested impaired cell separation. Thus, we evaluated the dynamics of septum formation and separation of a progeny pair during acid challenge. We monitored the formation and resolution of septa in single cells subjected to pH 7.2 and pH 4.5 using NADA and HADA, another fluorescent D‐alanine analog (Figs 2A and EV1A; Kuru et al, 2015). Bacteria were incubated in regular growth medium containing 1 mM HADA for 4 h. Cells were then washed to remove excess HADA and incubated in Sauton's medium at pH 7.2 or pH 4.5 supplemented with 1 mM NADA (Figs 2B and EV1B). Next, we counted the number of septa per bacterium and we quantified the number of septa labeled with HADA, NADA, or both to determine when the septum had formed. A septum labeled with HADA alone or co‐labeled with NADA indicated that it had formed before the switch to Sauton's medium, while labeling with NADA alone indicated that a septum had formed after the switch. Statistical analysis of the data is summarized in Appendix Table S2.
Figure 2. The separation of progeny cells is impaired in ΔmarP mutants during acid stress.
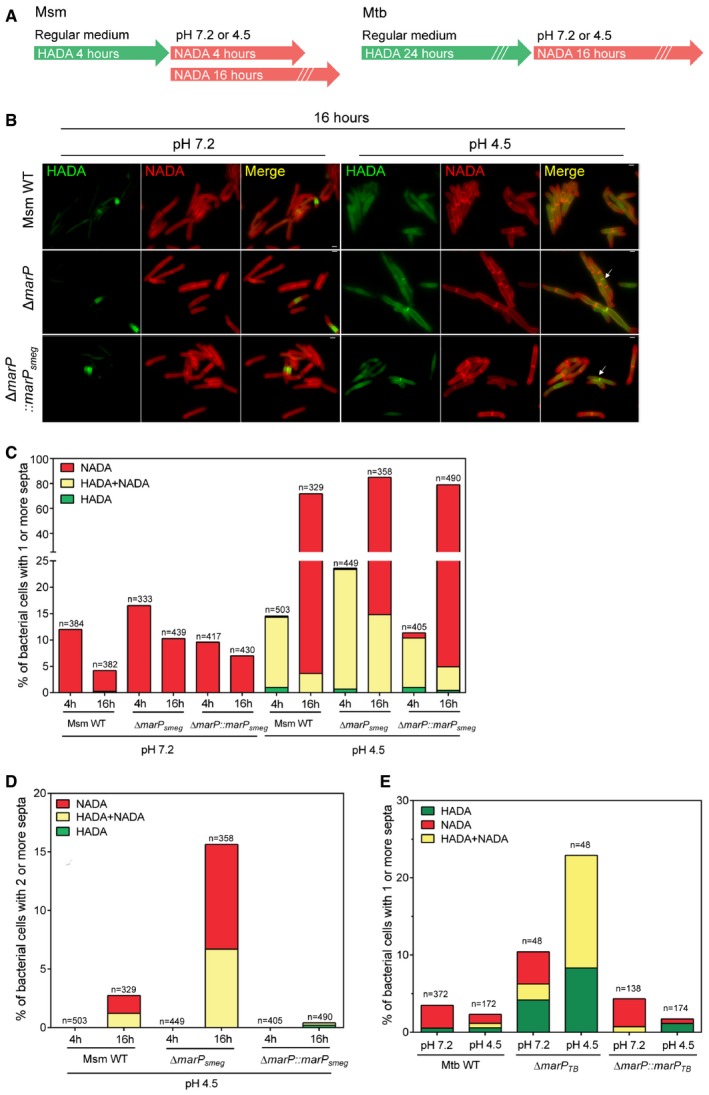
- Schematic of peptidoglycan labeling experiments for Msm and Mtb.
- Representative images of Msm WT, ΔmarP, and ΔmarP::marP smeg incubated in 7H9 medium containing 1 mM HADA for 4 h, washed, and further incubated in Sauton's medium at pH 7.2 or at pH 4.5 containing 1 mM NADA for 16 h. Arrows show examples of septa labeled with both HADA and NADA. Scale bars, 1 μm. See also Fig EV1B.
- Proportion of bacteria that contained at least one septum. All septa labeled with HADA only (green), with NADA only (red), or with at least one septum labeled with both probes (yellow) are reported for Msm WT, ΔmarP, and ΔmarP::marP smeg. The bacteria were incubated in 7H9 medium containing 1 mM HADA for 4 h, washed, and further incubated in Sauton's medium at pH 7.2 or pH 4.5 containing 1 mM NADA for 4 or 16 h.
- Proportion of bacteria in (C) that contained at least two septa after incubation in Sauton's medium at pH 4.5 for 4 or 16 h. Green, red, and yellow indicate bacteria for which all septa were labeled with HADA only, NADA only, or that had at least one septum labeled with both probes, respectively.
- Proportion of bacteria with a septum labeled with HADA only (green), NADA only (red), or both HADA and NADA (yellow). Mtb WT, ΔmarP, and ΔmarP::marP TB cells were incubated in 7H9 medium containing 1 mM HADA for 24 h, washed, and further incubated in Sauton's medium at pH 7.2 or at pH 4.5 containing 1 mM NADA for 16 h. See also Fig EV1C.
After incubation at pH 7.2 for 4 and 16 h, Msm WT, ΔmarP, and ΔmarP::marP smeg contained septa labeled with NADA only (Fig 2C). After 4 h at pH 4.5, all three strains presented almost exclusively septa stained with HADA only or both probes. This suggested that few new septa had formed within the 4 h following the transition to acidic pH and that cells in which septa had appeared prior to transition to acidic pH had an impaired ability to complete separation (Fig 2C). After 16 h at pH 4.5, all three strains presented a large number of cells that contained at least one septum. In ΔmarP, 17.4% of the septa remained labeled with HADA, whereas only 5.1 and 6.2% were HADA‐labeled in WT and complemented mutant, respectively (Fig 2C). We next looked at the proportion of cells forming chains at acidic pH and we assessed how they were labeled. Only 2.7 and 0.4% of Msm WT and ΔmarP::marP smeg cells formed chains after 16 h at pH 4.5, respectively. In contrast, 15.6% of Msm ΔmarP had multiple septa; 1.2 and 0.4% of Msm WT and ΔmarP::marP smeg septa were labeled with HADA. This number increased to 6.7% in ΔmarP cells (Fig 2D).
Collectively, these results indicated that exposure to acidic stress led to transiently impaired cell separation of a progeny pair. In Msm WT and ΔmarP::marP smeg , cell separation was delayed at acidic pH, but eventually sibling cells separated. However, this phenotype was exacerbated in cells lacking MarP, and culminated in the formation of chains, as new septa formed in cells that had not yet completed prior division.
Cell separation is impaired in Mtb ΔmarP
Next, we used the D‐alanine analogs to study the formation and resolution of septa in Mtb. We incubated Mtb WT, ΔmarP, and ΔmarP::marP TB cells in regular growth medium containing 1 mM HADA for 24 h. Cells were washed to remove excess HADA prior to incubation for 16 h in Sauton's medium at pH 7.2 or pH 4.5 supplemented with 1 mM NADA (Fig EV1C). At pH 7.2, the proportion of bacteria that had at least one septum was 10.4% in MarP‐deficient Mtb and 3.5 and 4.3% in the WT and complemented strains, respectively (Fig 2E). Almost all septa in Mtb WT and ΔmarP::marP TB were labeled only with NADA, while 40% of septa in MarP‐deficient cells were labeled with NADA, 20% with both HADA and NADA, and 40% with HADA only. The proportion of cells bearing a septum increased at pH 4.5 in ΔmarP (22.9%) and no new septa formed, whereas this proportion decreased to 2.7 and 1.7% in Mtb WT and ΔmarP::marP TB, respectively, and they were newly formed septa. This suggested that septum resolution was delayed in the absence of MarP at acidic pH, extending the time required for completion of cell separation.
Catalytically inactive MarP‐S343A leads to the formation of chains in MarP‐deficient cells
MarP consists of four N‐terminal transmembrane helices and a serine protease domain that is located in the periplasm (Biswas et al, 2010; Small et al, 2013). The catalytic amino acid triad His235, Asp264, and Ser343 is required for MarP's protease activity (Biswas et al, 2010). A Ser343 to Ala343 point mutant of MarP (MarP‐SA) is catalytically inactive in vitro and fails to complement the acid hypersensitivity of ΔmarP TB (Vandal et al, 2008; Biswas et al, 2010). We transformed Msm and Mtb WT and marP‐deficient mutants with flag‐tagged marP‐SA. Expression of the inactive mutant protein induced by the addition of anhydrotetracycline (Atc) impaired growth of marP‐deficient cells at neutral pH (Fig 3A and B, Appendix Fig S3A and B). In Msm ΔmarP, the growth defect caused by MarP‐S343A expression was associated with elongated cells containing numerous septa (Fig 3C). The toxicity of MarP‐S343A in the absence of wild‐type MarP suggested that its substrate(s) may be required for optimal separation of dividing cells. This process requires PG degradation, a reaction catalyzed in mycobacteria by the PG hydrolases RipA and RipB (Hett et al, 2008; Martinelli & Pavelka, 2016). Using an Atc‐regulated Msm strain, Hett et al showed that transcriptional silencing of ripA smeg in response to Atc removal is associated with a loss of viability (Hett et al, 2008). This phenotype is likely caused by silencing of ripA smeg and ripB smeg—which is located downstream of ripA smeg—as ripA smeg has recently been reported to be dispensable for growth if ripB is expressed (Hett et al, 2008; Martinelli & Pavelka, 2016). We further refer to this strain as RipAB knockdown (KD). Of note, this strain forms chains, branches, and bulges in the absence of the inducer, a consequence of defective PG hydrolysis (Hett et al, 2008).
Figure 3. Expression of catalytically inactive MarPS343A in MarP‐deficient cells impairs growth and causes the formation of chains.
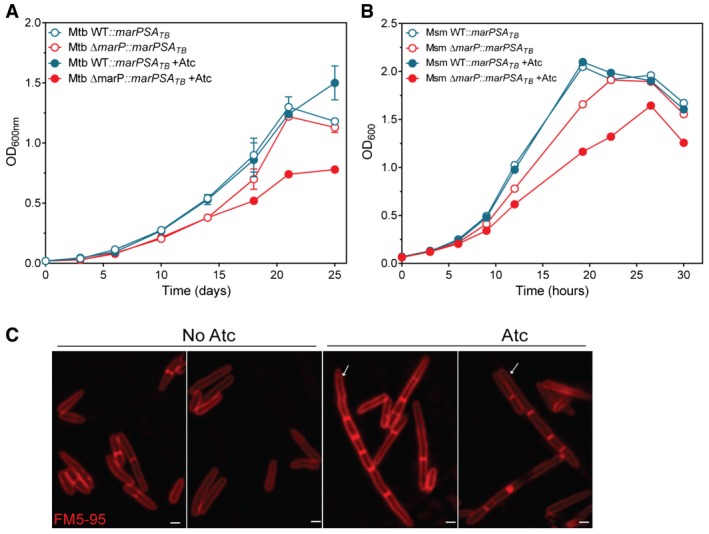
- Mtb growth curve in Sauton's medium at pH 7.2. Mtb WT and ΔmarP expressing marPS343A from an Atc‐inducible promoter; 1 μg/ml of Atc was added at day 6 (closed symbols). Data are means of triplicate cultures and error bars represent SD.
- Growth of Msm in 7H9 medium. Msm WT and ΔmarP expressing marPS343A from an Atc‐inducible promoter; 200 ng/ml of Atc was added after 3 h of incubation (closed symbols).
- Representative images of Msm ΔmarP expressing marPS343A from an Atc‐inducible promoter, with no Atc (2 panels on the left) or 200 ng/ml of Atc (2 panels on the right). Arrows show examples of bacteria that formed chains. Scale bars, 1 μm.
MarP cleaves RipA in vitro to release RipA's PG hydrolase domain
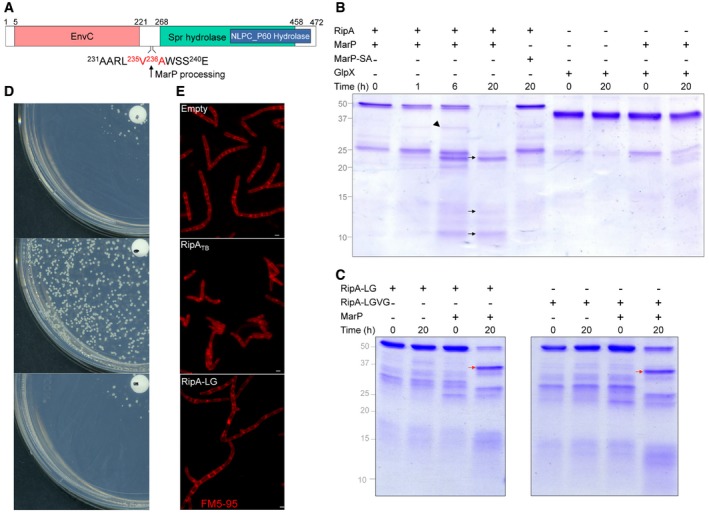
RipA possesses a PG hydrolase domain located at its C‐terminus and its N‐terminal domain is EnvC‐like. EnvC is a coil‐coiled domain involved in protein–protein interactions critical for cell division (Fig 4A; Uehara et al, 2010; Yang et al, 2011; Peters et al, 2013). Previous studies suggested that RipA needs to be proteolytically processed for optimal PG hydrolase activity (Ruggiero et al, 2010; Chao et al, 2013). Processed forms of RipA have been reported in vivo in Msm, but proteases that activate RipA have not been identified (Chao et al, 2013). The phenotypes shared by RipAB KD cells and MarP‐deficient cells in acidic medium led us to hypothesize that MarP cleaves and activates RipA at acidic pH.
Figure 4. MarP cleaves RipA in vitro and mutation of the cleavage site inhibits RipA activity in vivo .
-
ASchematic of RipA representing its domains predicted by BLASTP (https://blast.ncbi.nlm.nih.gov/). The amino acid sequence of the region where MarP cleaves RipA is indicated. MarP cleaves between the two residues shown in red.
-
B, C10 μg of RipA (B), RipA‐LG, or RipA‐LGVG (C) was incubated with 1 μg of MarP or MarP‐S343A at 37°C. Reactions were run on SDS–PAGE and gels were stained with Coomassie blue. Size of uncleaved RipA, RipA‐LG, and RipA‐LGVG: 49 kDa, size of MarP179–397: 24 kDa. Arrowhead points to the partially processed form of RipA. Black arrows point to the fully processed forms of RipA. Red arrows point to incompletely processed RipA.
-
DMsm RipAB knockdown transformed with an empty plasmid, a plasmid encoding RipATB, or RipA‐LG expressed from a constitutive promoter was plated on 7H10 plates. The disk in the center of the plate contains 50 ng of Atc; the concentration of Atc decreases from the center to the periphery of the plate.
-
EMicrographs of Msm RipAB KD‐empty, RipAB KD‐RipATB, RipAB KD‐RipA‐LG incubated for 24 h in 7H9 medium without Atc. Membranes were stained with FM5‐95 (red). Scale bars, 1 μm.
To test this, we first assessed the ability of MarP to cleave RipA in vitro. We purified RipATB without the signal sequence that targets it to the periplasm and incubated it with the protease domain of MarPTB and MarP‐S343A purified as reported (Small et al, 2013). Under conditions that were optimal for its activity (Small et al, 2013), MarPTB cleaved RipATB into three fragments with approximate molecular weights of 25, 14, and 10 kDa (Fig 4B, black arrows). An intermediate fragment of RipATB of ~35 kDa was detected after 6 h of incubation prior to further processing into the ~25‐kDa and ~10‐kDa fragments (Fig 4B, arrowhead). We generated two truncated versions of RipATB and determined whether MarPTB could process them: RipA‐Nter consisting of residues 42 to 235 and RipA‐Cter consisting of residues 263 to 472. We observed ~14‐kDa and ~10‐kDa species of RipA after cleavage of RipA‐Nter by MarPTB but no processing of RipA‐Cter by MarPTB (Fig EV2). Collectively, this suggests that RipATB may be cleaved at two different sites by MarPTB, generating fragments of about 25, 14, and 10 kDa. The specificity of the proteolytic event was further evidenced by the failure of MarPTB to process an unrelated enzyme, 1,3‐fructose bisphosphatase (GlpX), and the inability of MarP‐S343A to cleave RipA (Fig 4B).
Figure EV2. Analysis of RipA processing by MarP (related to Fig 4).
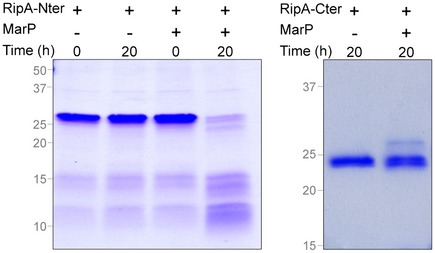
RipA‐Nter and RipA‐Cter were incubated with 1 μg of MarP at 37°C. Reactions were run on SDS–PAGE and gels were stained with Coomassie blue. Sizes: MarP179‐397, 24 kDa; RipA‐Nter, 23 kDa; RipA‐Cter, 24.8 kDa.
Using mass spectrometry, we identified the major fragment generated upon MarPTB cleavage. The 25‐kDa fragment corresponded to the C‐terminus of RipATB (236A to 472Q), indicating that MarPTB cleaves RipATB after valine 235 (Fig 4A, Appendix Fig S4A and B). Peptide substrate profiling had revealed that MarPTB cleaves preferentially after a residue that is preceded by a leucine or a tryptophan and followed by an alanine or an asparagine (Small et al, 2013). Consistent with this, a leucine (234Leu) precedes 235V and an alanine (236A) follows 235V. We further introduced the substitutions L234G (RipA‐LG) and L234G‐V235G (RipA‐LGVG) in the amino acid sequence of RipATB. MarPTB did not effectively process these mutant proteins, as the ~25‐kDa fragment of RipA was less abundant after prolonged incubation of MarPTB with either mutant. Moreover, the ~35‐kDa fragment appeared more stable when we used the two mutant proteins as substrates of MarPTB (Fig 4C, red arrows). These results confirmed the specificity of MarPTB for the cleavage sequence in RipATB and identified the MarPTB cleavage site in the N‐terminus of RipATB.
The 25‐kDa processed form of RipA contains the peptidoglycan hydrolase domain. We thus hypothesized that the impaired cleavage of RipA‐LG and RipA‐LGVG by MarP may prevent the release of the active hydrolase domain. Therefore, we sought to determine the biological impact of impaired RipA processing on Msm and Mtb.
RipALG fails to rescue the growth defect of Msm RipAB KD
To test the consequence of the cleavage site mutation on RipA's activity in vivo, we monitored the ability of RipA‐LG to phenotypically complement the RipAB KD after Atc was removed. To do so, we constitutively expressed RipATB and RipA‐LG fused to an HA tag in Msm RipAB KD and monitored the growth of colonies on agar plate deprived of Atc. RipATB, but not RipA‐LG, allowed the growth of RipAB KD without the inducer (Fig 4D). Western blot analysis verified that both RipATB and RipA‐LG were expressed in Msm RipAB KD (Appendix Fig S4C). Finally, we inspected by photomicroscopy the morphology of Msm RipAB KD and Msm RipAB KD expressing RipATB or RipA‐LG incubated in the absence of Atc. As expected, while constitutive expression of functional RipA (RipATB) resulted in wild‐type morphology, expression of RipA‐LG led to chaining, bulging, and branching, as documented for the RipAB KD (Hett et al, 2008; Fig 4E). Altogether, these results suggest that RipA's activity in vivo required its cleavage at a site that is recognized by the protease MarP.
RipATB and MarPTB interact in acid‐stressed cells
Because GFP is prone to unfolding and degradation when expressed in the periplasm, we codon‐adapted a superfolder GFP (sfGFP) and fused it to MarPTB (Pédelacq et al, 2006). We co‐expressed MarPTB‐GFPSF and RipATB‐HA in Msm ΔmarP. Whole‐cell lysates were extracted after 4 h of incubation in minimal medium at pH 4.5 and MarPTB‐sfGFP was immunoprecipitated using anti‐GFP‐coated magnetic beads. A strain that expressed sfGFP instead of MarP‐sfGFP served as a negative control. Using an anti‐HA antibody, we detected different forms of RipATB in Msm protein lysates (Fig 5, second panel); the strongest signal was attributed to the full‐length RipATB (Fig 5, blue arrow). Full‐length RipATB was also present in the MarPTB‐sfGFP eluate, but not in the sfGFP eluate, indicating that RipATB co‐immunoprecipitated with MarPTB (Fig 5, fourth panel). To determine whether MarP and RipA specifically interact at acidic pH, we immunoprecipitated MarPTB‐sfGFP after cells were incubated at acidic or neutral pH. A greater amount of RipATB‐HA co‐immunoprecipitated with MarPTB‐sfGFP when cells were subjected to pH 4.5 compared to pH 7.2 (Fig EV3). We conclude that RipATB and MarPTB chiefly interact in vivo when cells are exposed to acidic pH.
Figure 5. RipATB and MarPTB interact in vivo .
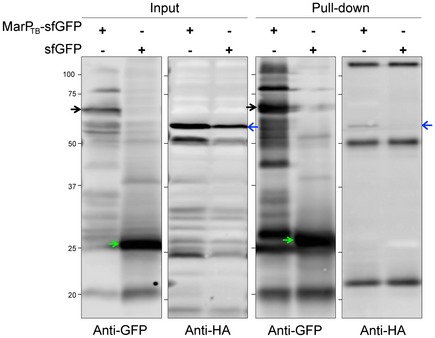
Co‐immunoprecipitation of RipATB and MarPTB from whole‐cell protein lysates of Msm ΔmarP::MarP TB ‐sfGFP::RipA TB ‐HA incubated for 4 h at pH 4.5. Whole‐cell protein lysates of Msm ΔmarP::sfGFP::RipA TB ‐HA cells served as a control. MarP‐sfGFPSF and sfGFP were pulled down using anti‐GFP‐coated magnetic beads. Whole‐cell lysates (input) and GFP eluates (pull‐down) were analyzed by SDS–PAGE, and MarPTB‐sfGFP (black arrows), sfGFP (green arrows), and RipATB‐HA (full‐length RipA, blue arrows) were detected by Western blot using anti‐GFP or anti‐HA antibodies. Data are representative of three independent experiments. Source data are available online for this figure.
Figure EV3. RipATB and MarPTB interact specifically at acidic pH (related to Fig 5).
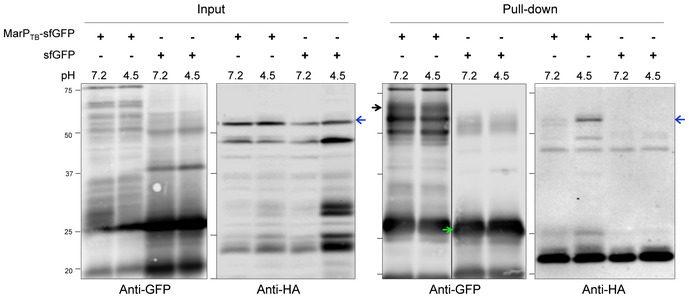
Co‐immunoprecipitation from whole‐cell protein lysates of Msm ΔmarP::MarP TB ‐sfGFP::RipA TB ‐HA and ΔmarP::sfGFP::RipA TB ‐HA incubated for 4 h at pH 4.5 or pH 7.2. MarP‐sfGFP and sfGFP were pulled down using anti‐GFP‐coated magnetic beads. Whole‐cell lysates (input) and GFP eluates (pull‐down) were analyzed by SDS–PAGE, and MarPTB‐sfGFP (black arrow), sfGFP (green arrow), and RipATB‐HA (full‐length RipA, blue arrows) were detected by Western blot using anti‐GFP or anti‐HA antibodies. Data are representative of two independent experiments.Source data are available online for this figure.
RipA is essential for cell separation during acid stress
If the protease MarP activates RipA at acidic pH, we hypothesized that a RipA mutant must recapitulate the phenotype of MarP‐deficient cells perfused with acidic medium. To test this, we incubated Msm WT, ΔripA, and ΔripA/ripA smeg (Martinelli & Pavelka, 2016) in Sauton's medium at pH 7.2 or pH 4.5 supplemented with 1 mM NADA for 24 h. At pH 7.2, the length distribution of the bacterial cells was similar for the three strains, whereas a significant number of ΔripA cells were longer at pH 4.5 compared to Msm WT and ΔripA/ripA smeg (Fig 6A and Appendix Table S3). We counted the number of bacteria containing more than two septa (Fig 6B and C). Only 2.4 and 4.1% of WT and complemented cells, respectively, presented multiple septa at pH 4.5. In contrast, 19% of ΔripA cells formed chains, indicating that RipA's activity is essential in acidic environment to mediate cell separation.
Figure 6. Msm ΔripA forms chains during acidic stress.
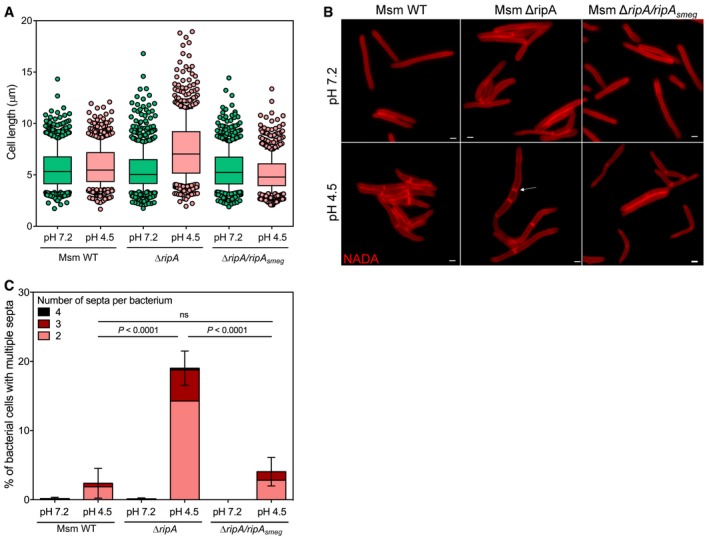
- Boxplot of the lengths (μm) of Msm WT, ΔripA, and ΔripA/ripA smeg incubated for 24 h in Sauton's medium at pH 7.2 or pH 4.5, measured in three independent experiments. Lower and upper whiskers extend to the 10th and 90th percentiles, respectively. The middle bar represents the median and the lower and upper box limits are the 25th and 75th percentiles. The P‐values have been computed using the Ranksum test adjusted for multiple testing. For Msm WT pH 7.2, n = 335, 213, 202; pH 4.5, n = 395, 216, 180. For ΔripA pH 7.2, n = 367, 214, 207; pH 4.5, n = 404, 149, 113. For ΔripA/ripA smeg pH 7.2, n = 323, 281, 181; pH 4.5, n = 350, 186, 192. n indicates the number of cells in experiments 1, 2, and 3. Adjusted P‐values compared to WT pH 7.2: ΔripA pH 7.2 P = 8.4 × 10⁻⁵ ; ΔripA/ripA smeg pH 7.2, P = 6.7 × 10⁻³. Adjusted P‐values compared to WT pH 4.5: ΔripA pH 4.5, P = 1.3 × 10⁻¹⁵; ΔripA/ripA smeg pH 4.5, P = 7.7 × 10⁻⁴.
- Representative images of Msm WT, ΔripA, and ΔripA/ripA smeg incubated in Sauton's medium at pH 7.2 or at pH 4.5 containing 1 mM NADA for 24 h. Arrows show examples of bacteria that formed chains. Scale bars, 1 μm.
- Quantification of the number of bacteria presenting two, three or four septa for Msm WT, ΔripA, and ΔripA/ripA smeg after 24‐h incubation at pH 7.2 or pH 4.5 from three independent experiments. Error bars represent SEM. P‐values were determined using a logistic regression model and adjusted for multiple comparisons.
Discussion
Many bacteria face acidic environments within their ecological niche or during their infectious cycle and have evolved mechanisms to withstand this stress (reviewed in Foster, 2004; Krulwich et al, 2011; De Biase & Lund, 2015). For example, Escherichia coli (E. coli) uses amino acid decarboxylase/antiporter systems that utilize glutamate, arginine, and lysine as substrates to increase its cytoplasmic pH (Lin et al, 1995; Foster, 2004). Additionally, the periplasmic chaperones HdeA and HdeB, and the cytoplasmic chaperone Hsp31, help preserve protein structure and activity in acidic conditions and the nucleoid binding protein Dps maintains DNA integrity (Choi et al, 2000; Gajiwala & Burley, 2000; Mujacic & Baneyx, 2007). Mechanisms in other microorganisms include the modification of the cell envelope, the formation of biofilms, the hydrolysis of ATP by the F1F0 ATPase, the activation of K+Na+/H+ antiporters, or the production of molecules with alkali power (Kullen & Klaenhammer, 1999; Li et al, 2001; Martín‐Galiano et al, 2001; Wen & Burne, 2004; Kim et al, 2005; Maroncle et al, 2006; Shabala & Ross, 2008; Williams & Cámara, 2009).
Mtb limits its exposure to acidic pH in infected hosts by blocking the fusion of the phagosome with lysosomes. If halting phagosomal maturation fails, Mtb possesses mechanisms by which it can survive in acidified phagosomes. Several proteins have been implicated in Mtb's adaptation to acid stress, such as the two‐component system PhoP/PhoR and the outer membrane protein OmpATB (Walters et al, 2006; Abramovitch et al, 2011; Song et al, 2011; Baker et al, 2014). A screen of an Mtb transposon mutant library for genes controlling Mtb's ability to survive a 6‐day exposure to pH 4.5 identified the periplasmic protease MarP as essential to resist acid stress (Vandal et al, 2008). In the absence of MarP, Mtb cannot maintain a neutral intracellular pH and dies in vitro at pH 4.5 and in activated macrophages (Vandal et al, 2008). The molecular mechanisms by which MarP protects mycobacteria against acid stress remain to be elucidated.
Here, we report that exposure of Mtb and Msm lacking MarP to an acidic medium resulted in significant cell elongation and led to a large increase in the proportion of cells containing one or more septa. These phenotypes may originate from an overall reduction in cell division processes combined with impaired cell separation. The labeling of nearly all septa after 4 h at pH 4.5 with D‐alanine analogs with which cells were pulsed prior to the switch to acidic pH supports this hypothesis and excludes that cell division was promoted. The effect of acid stress on cell separation was exacerbated in the mutant resulting in chain formation. Collectively, these results suggested that MarP plays a role in cell separation when cells are subjected to acid stress (Fig 7).
Figure 7. Model for the activation of RipA‐mediated PG hydrolysis by MarP in acid‐stressed Mtb.
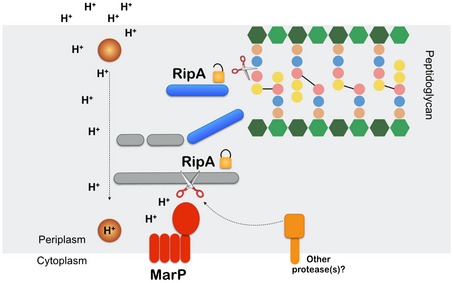
When Mtb faces an acidic environment, the periplasmic protease MarP (red) may sense the stress. Alternatively, MarP might be activated by an unknown protein (brown circle) that senses pH reduction. MarP cleaves the inactive full‐length RipA (gray). RipA processing leads to the release of its C‐terminal fragment that contains a PG hydrolase domain (blue). In other conditions, other proteases (orange) may activate RipA. Ultimately, PG hydrolysis by activated RipA mediates PG remodeling and/or separation of the progeny pair, processes that may sustain Mtb's survival when subjected to acid stress.
Cell separation requires the coordinated activities of lytic transglycosylases, amidases, and PG‐cleaving endopeptidases (Typas et al, 2012). In mycobacteria, the endopeptidase RipA has been shown to be important for cell separation, as Msm cells in which ripA expression was repressed failed to complete separation and formed chains (Hett et al, 2008). However, a recent study has reported that the silencing of ripA affects the expression of the downstream gene ripB (Martinelli & Pavelka, 2016). RipB is homologous to the C‐terminal amino acid sequence of RipA, which comprises the PG hydrolysis activity domain (NLPC_P60 hydrolase) and possesses PG hydrolysis activity (Böth et al, 2011). Hence, it is very likely that the phenotype of the RipA KD in Hett et al, dubbed in this study RipAB KD, was caused by a polar effect on ripB when ripA was inactivated. This implies that RipA and RipB have redundant activities and that maintaining the activity of at least one peptidoglycan hydrolase is indispensable for cell viability. Indeed, the in‐frame deletion of ripA alone did not lead to the death of Msm cells, although they were hypersensitive to vancomycin, erythromycin, rifampin, and detergents (Martinelli & Pavelka, 2016). Interestingly, ΔmarP is similarly hypersensitive to antibiotics that target PG homeostasis—vancomycin and faropenem (Appendix Table S4)—and also to erythromycin, rifampin, and detergent (Vandal et al, 2008).
RipA and RipB may also have unique properties, as ripB expression rescued the impact of ripA deletion on antibiotic and detergent‐induced stresses partially (Martinelli & Pavelka, 2016). This might be explained by the presence of additional domains in RipA, and potentially different interacting partners. Indeed, the C‐terminal domain of RipA binds other proteins that modify PG, such as RpfB and PBP1. These interactions modulate its hydrolase activity (Hett et al, 2007, 2008, 2010). Moreover, processed forms of RipA have been detected in Msm in vivo, and it has been shown that proteolytic activation was required to activate RipA (Ruggiero et al, 2010; Chao et al, 2013). The protease remained to be identified. The nature of the RipA fragment that has optimal PG hydrolase activity is unknown; in vitro studies had led to conflicting results that may originate from the sources of PG substrates used in those studies (Ruggiero et al, 2010; Böth et al, 2011). The hydrolytic activity on the PG from Bacillus subtilis of a RipA fragment containing only the NLPC_P60 domain (residues 332–472) and a larger fragment (residues 263–472) encompassing a loop prone to cleavage was similar (Ruggiero et al, 2010). The RipA fragment released by the periplasmic protease MarP (residues 236–472) is similar to the latter. Thus, MarP either releases a 236‐amino acid fragment that possesses PG hydrolysis activity or MarP matures prepro‐RipA into pro‐RipA, the aforementioned 236‐amino acid fragment, exposing a second cleavage site in the loop for other proteases.
The inability of RipALG that cannot be cleaved by MarP to complement RipA and RipB depletion in Msm implies that processing of RipA at the amino acid sequence that is recognized by the protease MarP is essential for its activity. Moreover, RipA and MarP are essential for the separation of progeny cells in acidic medium and the two proteins interact in vivo in acidic conditions. Collectively, these results suggest that MarP activates RipA to mediate PG hydrolysis at low pH. The enhanced interaction between MarP and RipA at acidic pH may depend on post‐translational modifications of either or both proteins, as both proteins were constitutively expressed in our experimental system. At neutral pH, MarP might be inhibited and other proteases may regulate RipA. In agreement with this, a benzoxazinone was shown to inhibit MarP and also bind the periplasmic protease and chaperone HtrA1 (Zhao et al, 2015). Moreover, RipB is sufficient to ensure cell separation in rich medium at neutral pH in M. smegmatis (Martinelli & Pavelka, 2016).
So far, two other PG‐hydrolyzing enzymes have been described to be regulated by proteolytic processing. The N‐acetylglucosaminidase Auto, essential for Listeria monocytogenes entry into host cells, requires proteolytic cleavage by an unidentified protease (Bublitz et al, 2009). Additionally, the activity of the D, D‐endopeptidase MepS from E. coli is modulated by the periplasmic protease Prc (Singh et al, 2015). However, unlike the action of MarP on RipA, PrC controls the level of MepS in E. coli by degrading it when it is no longer needed, such as in stationary phase. Thus, our study provides a unique example of a protease that activates a PG‐degrading enzyme by proteolytic cleavage.
Our results suggest that sustaining PG hydrolysis may be essential to Mtb's survival in acidic conditions, a stress that it faces in mature phagosomes. Further work will aim to determine whether RipA's activity during acid exposure helps maintain cell division or mediates PG remodeling. Assuring a few rounds of replication events subsequently to stress exposure may be a form of altruism evolved by Mtb to increase cell density and form bacterial structures so that bacilli at the periphery will protect the ones in the center from a stress (Davis et al, 2015). Alternatively, it may favor bet‐hedging by permitting the distribution of damaged macromolecules between progeny cells so that some sub‐population with altered fitness can better adapt to the stress (Manina et al, 2015; Vaubourgeix et al, 2015). Finally, activation of RipA by MarP may assure PG remodeling, rearrangement, or repair, all of which may be vital to Mtb's survival during stress.
Materials and Methods
Bacterial strains and culture conditions
Strains were cultured at 37°C in Middlebrook 7H9 medium with 0.2% glycerol, 0.5% bovine serum albumin fraction V, 0.05% Tween 80, 0.2% dextrose, 0.085% NaCl, and 0.02% tyloxapol, or Sauton's base medium (0.05% potassium phosphate monobasic, 0.05% magnesium sulfate heptahydrate, 0.2% citric acid, 0.005% ferric ammonium citrate, 0.05% ammonium sulfate, 0.2% glycerol, 0.0001% zinc sulfate, and 0.02% tyloxapol) with the pH adjusted as indicated. For pH 7.2, 0.1 mM MOPS (3‐(N‐morpholino)propanesulfonic acid) was added. For pH 5 and pH 4.5, 0.1 mM MES (2‐(N‐morpholino)ethanesulfonic acid) was added. Strains bearing antibiotic cassettes were cultured with hygromycin (50 μg/ml), zeocin (25 μg/ml), or streptomycin (25 μg/ml). For solid media, Middlebrook 7H11 media with 0.5% glycerol and 10% Middlebrook OADC supplement (final concentration of 0.5% bovine serum albumin fraction V, 0.2% glucose, 0.085% NaCl, 0.006% oleic acid, 0.0003% catalase) were used. For the Msm ΔripA, ΔripA/ripA smeg and the WT counterpart, liquid and solid media were supplemented with 40 μg/ml of L‐lysine (Martinelli & Pavelka, 2016).
Construction of expression vectors for MarPTB‐Flag, MarPSA‐Flag, MarPTB‐GFPSF, RipATB‐HA, and RipALG‐HA
Plasmids were constructed using Gateway® Cloning Technology (Life Technologies). sfGFP was codon‐adapted to mycobacterial codon usage with the Codon Adaptation Tool at www.jcat.de, synthesized, and cloned into a pUC57 vector (BioBasics). sfGFP was amplified by PCR using primers containing a sequence encoding the linker SGSGSG for the forward primer (linker‐GFP 5′‐tcgggctcgggctcgggctcgaagggcgaggagctgttcaccgg‐3′) and the attB3 site for the reverse primer (GFP‐attB3r 5′‐ggggacaactttgtataataaagttgtctacttgtacagctcgtccatgcc‐3′). The sequence encoding MarP was amplified from Mtb chromosomal DNA with primers allowing addition of the attB2 site upstream (marP‐attB2 5′‐ggggacagctttcttgtacaaagtggcacagaaaggaggttaataatgaccccgtcgcagtggctggatatcg‐3′) and the sequence encoding the linker downstream (marP‐linker 5′‐gcccgagcccgagcccgagctgacgcaggccccggtgccgaccg‐3′). A third PCR using these two fragments as templates and marP‐attB2 and GFP‐attB3 as primers generated a sequence encoding a fusion protein MarP‐sfGFP that was inserted in an episomal expression plasmid under the constitutive ptb38 promoter. A C‐terminal flag tag (DYKDDDDK) was introduced by PCR after MarPTB and MarPS343A coding sequence without their stop codon using the primers marP‐attB2, marP‐Flag‐Rv (5′‐acttatcgtcatcgtccttgtagtcgctgacgcaggccccggtgccgacc‐3′), then attB3‐Flag‐Rv (5′‐ggggacaactttgtataataaagtttcacttatcgtcatcgtccttgtagtcg‐3′). These coding sequences were then inserted after an Atc‐inducible promoter (T10‐P1) in an episomal plasmid. RipATB and RipA‐HA were amplified from Mtb DNA using primers containing attB sites (ripA‐attB2, 5′‐ggggacagctttcttgtacaaagtggcacagaaaggaggttaataatgagacggaatcgccgtggctcgcc‐3′; RipA‐attB3r, 5′‐ggggacaactttgtataataaagttgtctagtactcgatgtatcggac‐3′; or ripA‐HA‐attB3r 5′‐ggggacaactttgtataataaagttgtctaggcatagtccgggacgtcatacggatagtactcgatgtatcggaccacatacg‐3′). The LG mutation was introduced in RipA coding sequence using primers coding for the mutation (ripA‐LG‐Fd 5′‐aggcggccaggggcgttgcctgg‐3′ and ripA‐LG‐Rv 5′‐aggaccaggcaacgcccctggc‐3′). RipATB, RipA‐HA, and RipALG‐HA sequences were cloned under the ptb38 promoter in chromosomal expression plasmids that integrate in the Tweety site of the mycobacterial chromosome (Pham et al, 2007).
Confocal fluorescence microscopy
For length measurements, Mtb and Msm cultures were inoculated at OD600 0.3 in Sauton's media adjusted at indicated pHs. For growth curve experiments, Mtb cultures were inoculated at OD600 0.01 and Msm cultures at OD600 0.05. At indicated time points, aliquots were removed and washed once with PBS–0.05% Tween 80. Mtb strains were fixed with 4% paraformaldehyde for 4 h before removing from BSL‐3 containment. For PG labeling, 1 mM HADA or 1 mM NADA was added to the culture when indicated. Aliquots were removed, washed three times with PBS–0.05% Tween 80, and then fixed with 4% paraformaldehyde for 30 min for Msm and 4 h for Mtb. Bacterial suspensions were then spread on agar pad and visualized using an inverted Olympus IX‐70 microscope equipped with appropriate filter sets, a Photometrics CoolSnap QE cooled CCD camera, and an Insight SSI 7 color solid‐state illumination system.
Images were analyzed using ImageJ and the open source image analysis software Icy (Ting et al, 1999).
PG labeling probes synthesis
The PG labeling probes HCC‐amino‐D‐alanine (HADA) and NBD‐amino‐D‐alanine (NADA) were synthesized following the procedure described by Kuru et al (2015).
Overexpression and purification of RipATB, RipA‐Nter, RipA‐Cter, RipA‐LG, and RipA‐LGVG
RipATB (from 42Q to 472Y), RipA‐Nter (from 42Q to 235V), and RipA‐Cter (from 235V to 472Y) were amplified by PCR from M. tuberculosis genomic DNA and mutations were generated by PCR to amplify RipALG (234L to G), RipALGVG (234L to G and 235V to G) using the primers ripA‐LG‐Fd and ripA‐LG‐Rv, and ripA‐LGVG‐Fd (5′‐gcaggcggccaggggcggcgcct) and ripA‐LGVG‐Rv (5′‐tccgaggaccaggcgccgcccctgg). The fragments were cloned into pET300/NT‐DEST (Invitrogen) using Gateway Cloning Technology. The resulting vectors allowed isopropyl‐D‐1‐thiogalactopyranoside (IPTG)‐inducible expression of N‐terminal 6×His‐tagged proteins in E. coli BL21 (DE3) (Invitrogen). Expression of the proteins was induced with 0.5 mM IPTG at 30°C for 6 h. Cultures were then centrifuged at 4,000 g for 20 min at 4°C. Cell pellets were washed once in 15 ml buffer A (20 mM Tris–HCl, 500 mM NaCl, 25 mM imidazole) and then resuspended in buffer A supplemented with 0.5 μg of lysozyme and 5 μl of DNase I (Invitrogen) and incubated for 30 min at 4°C. The suspension was then subjected to sonication on ice using a Virtis Virsonic 600 sonicator (output setting 6, eight 10‐s pulses with 20‐s breaks) and centrifuged at 13,000 g for 20 min at 4°C to remove cell debris. The supernatant was clarified using a 0.45‐μm PVDF filter. A His Trap HP 5‐ml column (GE Healthcare) was equilibrated with 1 column volume of buffer A, loaded with lysate, and then washed with 20 column volumes (100 ml) of buffer A. His‐tagged proteins were eluted from the column using a gradient of imidazole from 25 to 500 mM in buffer A. Purity of the sample was assessed by SDS–PAGE. The fractions containing the protein were pooled and concentrated using Amicon Ultra centrifugal devices (Millipore). The sample was dialyzed against buffer A without imidazole using Thermo Slide‐A‐Lyzer Cassette (12 ml capacity, 10‐kDa cutoff). Part of the final sample was stored with 50% glycerol at −20°C for use in in vitro cleavage assay or flash‐frozen with liquid nitrogen and stored at −80°C for use in antibody generation.
In vitro cleavage assay
1 μg of MarP_179‐397 was incubated for 10 min at 37°C in 50 mM Tris, 0.5 M NaCl, 0.01% Triton X‐100, pH 7.4; 10 μg of RipATB, RipA‐Nter, RipA‐Cter, RipALG, RipALGVG, or GlpX was added and further incubated at 37°C for the indicated times. Reactions were stopped by adding SDS sample buffer (2% SDS, 2 mM β‐mercaptophenol, 4% glycerol, 40 mM Tris–HCl, pH 6.8, 0.01% bromophenol blue) and boiling for 10 min.
Immunoprecipitation of sfGFP and MarP‐sfGFP
Cultures were washed twice with lysis buffer (50 mM Tris–HCl pH 7.4, 50 mM NaCl) containing protease inhibitor cocktail (Roche) and then resuspended in lysis buffer at a ratio of 1 ml/g of pellet. The cells were broken by bead beating (Precellys®24, Bertin Technologies or Mini‐Beadbeater‐1, Bio Spec Products Inc.) and 1% dodecyl maltoside was added. The lysates were incubated for 2 h on ice. Beads were removed by centrifugation for 15 s at 7,500 g and unbroken cells were removed by centrifugation for 5 min at 7,500 g; 5–10 mg of total proteins in lysate was incubated with 30 μl of anti‐GFP mAb‐magnetic beads (MBL) at 4°C under gentle shaking. After overnight incubation, the supernatant was removed using a DynaMag‐Magnet 2 rack (Thermo Fisher scientific). The samples were centrifuged for 30 s at 5000 g to remove the supernatant and then washed three times with PBS. Proteins bound to the beads were then eluted by boiling for 10 min in SDS sample buffer.
MIC determinations
Minimum inhibitory concentrations for the various Mtb strains were determined using the microbroth dilution technique—briefly, Mtb was grown to mid‐log‐phase and diluted to an OD600 of 0.05. Equal volumes of the suspension were dispensed into a twofold antibiotic dilution series in Middlebrook 7H9 media to a final OD600 of 0.025 per well. Optical density was measured after 10 days of outgrowth, and the minimum inhibitory concentration was defined to be the concentration of antibiotic at which bacterial growth was inhibited by 90% relative to the antibiotic‐free control wells. Vancomycin, faropenem, and D‐cycloserine were purchased from Sigma Aldrich (St. Louis, MO).
Additional methods can be found in the Appendix Supplementary Methods.
Author contributions
HB, JV, and SE designed the study and analyzed the data. HB, JV, WX, HM, and NS performed experiments. MHL and HB performed the statistical analysis. MSG provided reagents. HB, JV, and SE wrote the manuscript with input from MSG and WX.
Conflict of interest
The authors declare that they have no conflict of interest.
Supporting information
Appendix
Expanded View Figures PDF
Source Data for Expanded View and Appendix
Review Process File
Source Data for Figure 5
Acknowledgements
We are grateful to Dr. Carl Nathan for discussions and critical reading of the manuscript. We thank Dr. Dirk Schnappinger and Dr. Kyu Rhee for helpful discussions and insightful advice. We thank Dr. Eric Rubin (Harvard School of Public Health) for the Msm RipAB KD strain, Dr. Martin Pavelka for the RipA‐KO strains, and Dr. Ouathek Ouerfelli and Guangli Yang (Organic Synthesis Core Facility at Memorial Sloan Kettering Cancer Center) for the synthesis of the fluorescent D‐alanine analogs. We thank Dr. Henrik Molina and Joe Fernandez of the Proteomics Resource Center at The Rockefeller University for LC‐MS/MS analysis and Drs. Alison North and Kaye Thomas at the Bio‐Imaging Resource Center (Rockefeller University) for invaluable help and advice. This work was supported by National Institutes of Health (NIH) R01 AI081725 and U19 AI107774. H.B. was supported by a 2‐year fellowship from The Potts Memorial Foundation. MSG is supported by P30 CA008748.
The EMBO Journal (2017) 36: 536–548
References
- Abramovitch RB, Rohde KH, Hsu FF, Russell DG (2011) aprABC: a Mycobacterium tuberculosis complex‐specific locus that modulates pH‐driven adaptation to the macrophage phagosome. Mol Microbiol 80: 678–694 [DOI] [PMC free article] [PubMed] [Google Scholar]
- Baker JJ, Johnson BK, Abramovitch RB (2014) Slow growth of Mycobacterium tuberculosis at acidic pH is regulated by phoPR and host‐associated carbon sources. Mol Microbiol 94: 56–69 [DOI] [PMC free article] [PubMed] [Google Scholar]
- Biswas T, Small J, Vandal O, Odaira T, Deng H, Ehrt S, Tsodikov OV (2010) Structural insight into serine protease Rv3671c that protects M. tuberculosis from oxidative and acidic stress. Structure 18: 1353–1363 [DOI] [PMC free article] [PubMed] [Google Scholar]
- Böth D, Schneider G, Schnell R (2011) Peptidoglycan remodeling in Mycobacterium tuberculosis: comparison of structures and catalytic activities of RipA and RipB. J Mol Biol 413: 247–260 [DOI] [PubMed] [Google Scholar]
- Bublitz M, Polle L, Holland C, Heinz DW, Nimtz M, Schubert WD (2009) Structural basis for autoinhibition and activation of Auto, a virulence‐associated peptidoglycan hydrolase of Listeria monocytogenes . Mol Microbiol 71: 1509–1522 [DOI] [PubMed] [Google Scholar]
- Chao MC, Kieser KJ, Minami S, Mavrici D, Aldridge BB, Fortune SM, Alber T, Rubin EJ (2013) Protein complexes and proteolytic activation of the cell wall hydrolase RipA regulate septal resolution in mycobacteria. PLoS Pathog 9: e1003197 [DOI] [PMC free article] [PubMed] [Google Scholar]
- Choi SH, Baumler DJ, Kaspar CW (2000) Contribution of dps to acid stress tolerance and oxidative stress tolerance in Escherichia coli O157:H7. Appl Environ Microbiol 66: 3911–3916 [DOI] [PMC free article] [PubMed] [Google Scholar]
- Davis KM, Mohammadi S, Isberg RR (2015) Community behavior and spatial regulation within a bacterial microcolony in deep tissue sites serves to protect against host attack. Cell Host Microbe 17: 21–31 [DOI] [PMC free article] [PubMed] [Google Scholar]
- De Biase D, Lund PA (2015) The Escherichia coli acid stress response and its significance for pathogenesis. Adv Appl Microbiol 92: 49–88 [DOI] [PubMed] [Google Scholar]
- Flannagan RS, Cosío G, Grinstein S (2009) Antimicrobial mechanisms of phagocytes and bacterial evasion strategies. Nat Rev Microbiol 7: 355–366 [DOI] [PubMed] [Google Scholar]
- Foster JW (2004) Escherichia coli acid resistance: tales of an amateur acidophile. Nat Rev Microbiol 2: 898–907 [DOI] [PubMed] [Google Scholar]
- Gajiwala KS, Burley SK (2000) HDEA, a periplasmic protein that supports acid resistance in pathogenic enteric bacteria. J Mol Biol 295: 605–612 [DOI] [PubMed] [Google Scholar]
- Hett EC, Chao MC, Steyn AJ, Fortune SM, Deng LL, Rubin EJ (2007) A partner for the resuscitation‐promoting factors of Mycobacterium tuberculosis . Mol Microbiol 66: 658–668 [DOI] [PubMed] [Google Scholar]
- Hett EC, Chao MC, Deng LL, Rubin EJ (2008) A mycobacterial enzyme essential for cell division synergizes with resuscitation‐promoting factor. PLoS Pathog 4: e1000001 [DOI] [PMC free article] [PubMed] [Google Scholar]
- Hett EC, Chao MC, Rubin EJ (2010) Interaction and modulation of two antagonistic cell wall enzymes of mycobacteria. PLoS Pathog 6: e1001020 [DOI] [PMC free article] [PubMed] [Google Scholar]
- Kim BH, Kim S, Kim HG, Lee J, Lee IS, Park YK (2005) The formation of cyclopropane fatty acids in Salmonella enterica serovar Typhimurium. Microbiology 151: 209–218 [DOI] [PubMed] [Google Scholar]
- Krulwich TA, Sachs G, Padan E (2011) Molecular aspects of bacterial pH sensing and homeostasis. Nat Rev Microbiol 9: 330–343 [DOI] [PMC free article] [PubMed] [Google Scholar]
- Kullen MJ, Klaenhammer TR (1999) Identification of the pH‐inducible, proton‐translocating F1F0‐ATPase (atpBEFHAGDC) operon of Lactobacillus acidophilus by differential display: gene structure, cloning and characterization. Mol Microbiol 33: 1152–1161 [DOI] [PubMed] [Google Scholar]
- Kuru E, Hughes HV, Brown PJ, Hall E, Tekkam S, Cava F, de Pedro MA, Brun YV, Van Nieuwenhze MS (2012) In situ probing of newly synthesized peptidoglycan in live bacteria with fluorescent D‐amino acids. Angew Chem Int Ed 51: 12519–12523 [DOI] [PMC free article] [PubMed] [Google Scholar]
- Kuru E, Tekkam S, Hall E, Brun YV, Van Nieuwenhze MS (2015) Synthesis of fluorescent D‐amino acids and their use for probing peptidoglycan synthesis and bacterial growth in situ . Nat Protoc 10: 33–52 [DOI] [PMC free article] [PubMed] [Google Scholar]
- Levitte S, Adams KN, Berg RD, Cosma CL, Urdahl KB, Ramakrishnan L (2016) Mycobacterial acid tolerance enables phagolysosomal survival and establishment of tuberculous infection in vivo. Cell Host Microbe 20: 250–258 [DOI] [PMC free article] [PubMed] [Google Scholar]
- Li YH, Hanna MN, Svensäter G, Ellen RP, Cvitkovitch DG (2001) Cell density modulates acid adaptation in Streptococcus mutans: implications for survival in biofilms. J Bacteriol 183: 6875–6884 [DOI] [PMC free article] [PubMed] [Google Scholar]
- Lin J, Lee IS, Frey J, Slonczewski JL, Foster JW (1995) Comparative analysis of extreme acid survival in Salmonella typhimurium, Shigella flexneri, and Escherichia coli . J Bacteriol 177: 4097–4104 [DOI] [PMC free article] [PubMed] [Google Scholar]
- MacMicking JD, Taylor GA, McKinney JD (2003) Immune control of tuberculosis by IFN‐gamma‐inducible LRG‐47. Science 302: 654–659 [DOI] [PubMed] [Google Scholar]
- Manina G, Dhar N, McKinney JD (2015) Stress and host immunity amplify Mycobacterium tuberculosis phenotypic heterogeneity and induce nongrowing metabolically active forms. Cell Host Microbe 17: 32–46 [DOI] [PubMed] [Google Scholar]
- Maroncle N, Rich C, Forestier C (2006) The role of Klebsiella pneumoniae urease in intestinal colonization and resistance to gastrointestinal stress. Res Microbiol 157: 184–193 [DOI] [PubMed] [Google Scholar]
- Martinelli DJ, Pavelka MS (2016) The RipA and RipB peptidoglycan endopeptidases are individually non‐essential to Mycobacterium smegmatis . J Bacteriol 198: 1464–1475 [DOI] [PMC free article] [PubMed] [Google Scholar]
- Martín‐Galiano AJ, Ferrándiz MJ, de la Campa AG (2001) The promoter of the operon encoding the F0F1 ATPase of Streptococcus pneumoniae is inducible by pH. Mol Microbiol 41: 1327–1338 [DOI] [PubMed] [Google Scholar]
- Mujacic M, Baneyx F (2007) Chaperone Hsp31 contributes to acid resistance in stationary‐phase Escherichia coli . Appl Environ Microbiol 73: 1014–1018 [DOI] [PMC free article] [PubMed] [Google Scholar]
- Pédelacq JD, Cabantous S, Tran T, Terwilliger TC, Waldo GS (2006) Engineering and characterization of a superfolder green fluorescent protein. Nat Biotechnol 24: 79–88 [DOI] [PubMed] [Google Scholar]
- Peters NT, Morlot C, Yang DC, Uehara T, Vernet T, Bernhardt TG (2013) Structure‐function analysis of the LytM domain of EnvC, an activator of cell wall remodelling at the Escherichia coli division site. Mol Microbiol 89: 690–701 [DOI] [PMC free article] [PubMed] [Google Scholar]
- Pham TT, Jacobs‐Sera D, Pedulla ML, Hendrix RW, Hatfull GF (2007) Comparative genomic analysis of mycobacteriophage Tweety: evolutionary insights and construction of compatible site‐specific integration vectors for mycobacteria. Microbiology 153: 2711–2723 [DOI] [PMC free article] [PubMed] [Google Scholar]
- Ruggiero A, Marasco D, Squeglia F, Soldini S, Pedone E, Pedone C, Berisio R (2010) Structure and functional regulation of RipA, a mycobacterial enzyme essential for daughter cell separation. Structure 18: 1184–1190 [DOI] [PubMed] [Google Scholar]
- Schaible UE, Sturgill‐Koszycki S, Schlesinger PH, Russell DG (1998) Cytokine activation leads to acidification and increases maturation of Mycobacterium avium‐containing phagosomes in murine macrophages. J Immunol 160: 1290–1296 [PubMed] [Google Scholar]
- Shabala L, Ross T (2008) Cyclopropane fatty acids improve Escherichia coli survival in acidified minimal media by reducing membrane permeability to H+ and enhanced ability to extrude H +. Res Microbiol 159: 458–461 [DOI] [PubMed] [Google Scholar]
- Singh SK, Parveen S, SaiSree L, Reddy M (2015) Regulated proteolysis of a cross‐link‐specific peptidoglycan hydrolase contributes to bacterial morphogenesis. Proc Natl Acad Sci USA 112: 10956–10961 [DOI] [PMC free article] [PubMed] [Google Scholar]
- Small JL, O'Donoghue AJ, Boritsch EC, Tsodikov OV, Knudsen GM, Vandal O, Craik CS, Ehrt S (2013) Substrate specificity of MarP, a periplasmic protease required for resistance to acid and oxidative stress in Mycobacterium tuberculosis . J Biol Chem 288: 12489–12499 [DOI] [PMC free article] [PubMed] [Google Scholar]
- Song H, Huff J, Janik K, Walter K, Keller C, Ehlers S, Bossmann SH, Niederweis M (2011) Expression of the ompATb operon accelerates ammonia secretion and adaptation of Mycobacterium tuberculosis to acidic environments. Mol Microbiol 80: 900–918 [DOI] [PMC free article] [PubMed] [Google Scholar]
- Ting LM, Kim AC, Cattamanchi A, Ernst JD (1999) Mycobacterium tuberculosis inhibits IFN‐gamma transcriptional responses without inhibiting activation of STAT1. J Immunol 163: 3898–3906 [PubMed] [Google Scholar]
- Typas A, Banzhaf M, Gross CA, Vollmer W (2012) From the regulation of peptidoglycan synthesis to bacterial growth and morphology. Nat Rev Microbiol 10: 123–136 [DOI] [PMC free article] [PubMed] [Google Scholar]
- Uehara T, Parzych KR, Dinh T, Bernhardt TG (2010) Daughter cell separation is controlled by cytokinetic ring‐activated cell wall hydrolysis. EMBO J 29: 1412–1422 [DOI] [PMC free article] [PubMed] [Google Scholar]
- Vandal OH, Pierini LM, Schnappinger D, Nathan CF, Ehrt S (2008) A membrane protein preserves intrabacterial pH in intraphagosomal Mycobacterium tuberculosis . Nat Med 14: 849–854 [DOI] [PMC free article] [PubMed] [Google Scholar]
- Vaubourgeix J, Lin G, Dhar N, Chenouard N, Jiang X, Botella H, Lupoli T, Mariani O, Yang G, Ouerfelli O, Unser M, Schnappinger D, McKinney J, Nathan C (2015) Stressed mycobacteria use the chaperone ClpB to sequester irreversibly oxidized proteins asymmetrically within and between cells. Cell Host Microbe 17: 178–190 [DOI] [PMC free article] [PubMed] [Google Scholar]
- Via LE, Fratti RA, McFalone M, Pagan‐Ramos E, Deretic D, Deretic V (1998) Effects of cytokines on mycobacterial phagosome maturation. J Cell Sci 111(Pt 7): 897–905 [DOI] [PubMed] [Google Scholar]
- Walters SB, Dubnau E, Kolesnikova I, Laval F, Daffe M, Smith I (2006) The Mycobacterium tuberculosis PhoPR two‐component system regulates genes essential for virulence and complex lipid biosynthesis. Mol Microbiol 60: 312–330 [DOI] [PubMed] [Google Scholar]
- Weiss G, Schaible UE (2015) Macrophage defense mechanisms against intracellular bacteria. Immunol Rev 264: 182–203 [DOI] [PMC free article] [PubMed] [Google Scholar]
- Wen ZT, Burne RA (2004) LuxS‐mediated signaling in Streptococcus mutans is involved in regulation of acid and oxidative stress tolerance and biofilm formation. J Bacteriol 186: 2682–2691 [DOI] [PMC free article] [PubMed] [Google Scholar]
- Williams P, Cámara M (2009) Quorum sensing and environmental adaptation in Pseudomonas aeruginosa: a tale of regulatory networks and multifunctional signal molecules. Curr Opin Microbiol 12: 182–191 [DOI] [PubMed] [Google Scholar]
- Yang DC, Peters NT, Parzych KR, Uehara T, Markovski M, Bernhardt TG (2011) An ATP‐binding cassette transporter‐like complex governs cell‐wall hydrolysis at the bacterial cytokinetic ring. Proc Natl Acad Sci USA 108: E1052–E1060 [DOI] [PMC free article] [PubMed] [Google Scholar]
- Zhao N, Darby CM, Small J, Bachovchin DA, Jiang X, Burns‐Huang KE, Botella H, Ehrt S, Boger DL, Anderson ED et al (2015) Target‐based screen against a periplasmic serine protease that regulates intrabacterial pH homeostasis in Mycobacterium tuberculosis . ACS Chem Biol 10: 364–371 [DOI] [PMC free article] [PubMed] [Google Scholar]
Associated Data
This section collects any data citations, data availability statements, or supplementary materials included in this article.
Supplementary Materials
Appendix
Expanded View Figures PDF
Source Data for Expanded View and Appendix
Review Process File
Source Data for Figure 5


