

Abstract
Most of computerized cognitive behavioral therapy targeted restoration and few have targeted primary prevention. The purpose of this study is to obtain the knowledge for further development on preventive mental healthcare application. We developed a personal mental healthcare application which aimed to give users the chance to manage their mental health by self-monitoring and regulating their behavior. Through the 30-day field trial, the results showed improvement of mood score through conducting of suggested action, and the depressive mood of the participants was significantly decreased after the trial. The possibility of application and further problem was confirmed.
Keywords: behavioral self-regulation, cognitive behavioral therapy, computerized cognitive behavioral therapy, mental healthcare, self-monitoring
Introduction
Mental illnesses such as depression and anxiety disorders are diseases with high prevalence. Once people miss an opportunity to recover, they take a long time to get back into society. However, some people will avoid going to a clinic to see a psychologist because of the stigma associated with these illnesses, and sometimes their condition has become rather severe by the time they get to the clinic. Therefore, preventive interventions and self-management are important for addressing these problems. Self-management is based on operant conditioning, which aims to relieve stress people are incurring by rewarding them for actions they take to improve their condition. There is also a technique known as cognitive behavioral therapy (CBT), which is a proven method for recovering from depression and anxiety disorders (Butler et al., 2006; Tolin, 2010). Integrating self-management and CBT enables patients to deal with their disease on a daily basis at low cost.
One of the goals of CBT is to enable people to regulate their behavior. The idea behind this form of therapy is to enable patients to activate and/or deactivate their actions, that is, their behavior. A fundamental factor in behavioral activation is getting people to continuously do things that will bring better results to them. It aims to help them increase their activities with positive reinforcement rather than decrease their activities with negative reinforcement. However, simply helping people to increase their activities will not solve the problem. For people who have difficulty in activating their behavior or are too active, it is better to support them in a gentler manner by, for example, encouraging them to try small tasks or take short rest periods. This is the key idea behind behavioral regulation.
Computerized cognitive behavioral therapy
Many researchers have confirmed evidence of the effect of computerized cognitive behavioral therapy (CCBT), and it is used in treating several mental diseases (Bardram et al., 2012, 2013; Doherty et al., 2012). In particular, it is an effective way to improve the state of mind of those with mild to moderate depression, dysphoria, and anxiety disorder (Andrews et al., 2010; Christensen et al., 2004; Clarke et al., 2005; Iloabachie et al., 2011). The National Institute for Health and Clinical Excellence (NICE) in the United Kingdom recommends CCBT for these mental illnesses. In recent years, many uses of CCBT that utilize more convenient mobile applications have been developed (e.g. Birney et al., 2016; Watts et al., 2013), and there have been continuous extensions of target-specific programs to address illnesses such as eating disorders (Nitsch et al., 2016), social anxiety disorders (Miloff et al., 2015), posttraumatic stress disorder (PTSD) (Kuhn et al., 2014), or fibromyalgia (De la Vega et al., 2016). Gamification of clinical techniques such as attention-bias modification training (Dennis and O’Toole, 2014) has also been developed, and the possibilities that various treatment methods show have been expanded. However, using these methods for treatment poses various risks. These risks have been discussed, and summaries of the ethical issues they involve have been reported (Prentice and Dobson, 2014).
Self-monitoring applications
Matthews et al. reported that a self-monitoring method on a mobile phone was more effective than the paper-based methods that have been reported, and that it helped users to understand self-awareness (Matthews and Doherty, 2011). Other approaches have been reported, such as a real-time monitoring application for attention-deficit/hyperactivity disorder (ADHD) children when symptoms appear (Gringras et al., 2006), and monitoring symptoms of bipolar disorders that have been shown to be effective compared to the paper-based approach (Bauer et al., 2006). As for self-assessment and screening, there are specialized applications for bipolar disorders (Bardram et al., 2013), anxiety (Bauer et al., 2006), mental illness including depression and anxiety disorder (Donker et al., 2009), behavioral problems of young men (Diamond et al., 2010), eating disorders (Fairburn and Rothwell, 2015), and insomnia (Koffel et al., 2016; Kuhn et al., 2016).
Applications for patients with major depressive disorders, bipolar disorders, and schizophrenia use voice-based input and graphs to display the data to reduce the monitoring workload for self-assessment (Chinman et al., 2007). Recently, possibilities have been examined for effectively using wearable systems for self-monitoring (Lanata et al., 2015; Martinez et al., 2016).
Behavioral regulation applications
Applications for behavioral activation have been developed mainly in the context of physical health promotion (Payne et al., 2015). In such circumstances, MONARCA is one of the famous self-monitoring applications for psychological treatment, but it addresses behavioral activation (Bardram et al., 2012). “BeWell” aims to activate behavior by graphically showing physical exertion feedback to the user, for such factors as sleeping and physical conditions (Lane et al., 2011). There are other applications that automatically correct physical exertion data of depressed patients from a mobile phone and give feedback to activate behavior (Burns et al., 2011). These applications use games to encourage users to do such things such as raising a virtual pet or take long walks (Lin et al., 2006) or eat healthily and regularly (Pollak et al., 2010). One application that has been reported is the “Positive Activity Jackpot,” which helps depressed people to become more activated by scheduling pleasant events they can participate in and using augmented reality technology (Edwards-Stewart, 2012). These applications and services encourage behavioral activation and regulation. When they are used, however, it is important to not only activate behavior but also to manage the behavior quantity and quality by adjusting the user’s physical and mental conditions. For example, when users overexert themselves (i.e. by becoming too activated), behavior deactivation is preferable to behavior activation. This suggests there is a real need for a system that has the capability to understand users’ physical and mental conditions by self-monitoring them and giving them feedback with which they can regulate their behavior.
This research work has mainly focused on supporting patients and clinician interaction; they assumed that system users were ill and needed to visit a clinic. On the other hand, prevention is also an important issue to be addressed in mental healthcare (Cuijpers et al., 2005). We therefore focused on personal mental healthcare, assuming that our system’s users would be not only people who were mentally ill but also people who were in good mental health. We wanted our system to enable users to use it anytime and anywhere—at their home, office, or wherever—to check their mental health. We also wanted it to be personal, that is, one they could use on the web with the device of their preference (personal computer, mobile device, etc.).
In accordance with our objectives, we here present the personal mental healthcare application we propose, which we call “SABORI” (self-monitoring application for behavioral observation and regulation by interaction), which integrates self-monitoring and behavioral self-regulation. This article discusses the possibilities for applying it to people for whom field trials have not motivated their interest in mental healthcare and further developing it for preventive mental health applications.
Materials and methods
We conducted a field trial to understand how the application supports people to prevent them from incurring mental illness and how well its interactive design works. Note that this field trial was performed under close supervision by clinical psychologists and that it received ethical permission.1 Participants were told that they could stop using the application anytime if they wanted.
Participants
We used an open participation process, in which we recruited participants through our website, paper flyers, and emails. In total, 98 volunteers participated in the field trial, aged 19–69 (average: 34.46, standard deviation (SD): 13.16) years. There were 53 males and 45 females; 51 were office workers and 31 were university students. None of them had any prior associations or experience with our lab, group, or project. They used the SABORI application on their personal computer and whatever mobile device they had (e.g. a smartphone).
Before starting the trial, each participant was asked to answer a Kessler Psychological Distress Scale questionnaire (K10) (Kessler et al., 2002). The K10 questionnaire is a simple 10-item screening scale for psychological distress (range: 10–50). We performed this non-mandatory test before (pre-test) and after (post-test) the trial to investigate the improvement in the psychological state that had been obtained with the application. The obtained results showed that 83 of the participants answered the questionnaire before the trial (pre-test), and that 23 of them (28%) were recognized as having mild depression (threshold score is 25 in K10), but the others were in good health. For quantitative analysis, we mainly analyzed the following: (1) the mood score that was collected by the self-monitoring and (2) the K10 score before and 30 days after the trial. For qualitative analysis, we asked participants to answer a free-form questionnaire on-site or online; 29 of them answered it. The questionnaire items were about the participants’ impressions of the application, its points they had found useful or not useful, its points they had enjoyed, and its functions they preferred.
SABORI system
All the feedback, suggestions, interfaces, interactions, and tokens for the application (including gamification functionality) were designed by psychotherapists who had completed CBT training. This application was created for Japanese; all figures in this article include Japanese text with English captions. The application was deployed on a web server, and it was itself a web application. The users used it on whatever device they preferred, such as a personal computer or a mobile device. The application was implemented by adopting a responsive method to display the appropriate design on various devices.
Self-monitoring (morning)
We designed two questionnaires to determine the user’s psychological state; they were used for self-monitoring (Figure 1). The first questionnaire was for the mood score, which comprised three items: (1) depressed feeling, represented on the “depressed—cheerful” axis, (2) anxious feeling, represented on the “anxious—relaxed” axis, and (3) frantic feeling, represented on the “angry—calm” axis. Each axis has a 0–100 point scale, and the mood score sum (maximum 300) was used for the analysis of the field trial.
Figure 1.
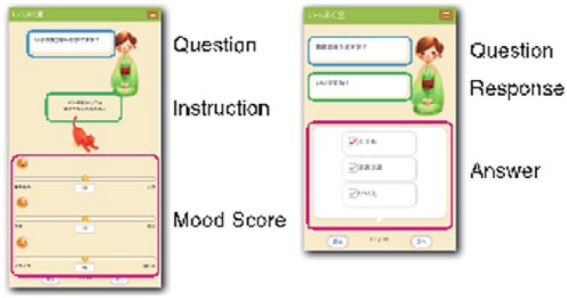
Self-monitoring interface.
The second questionnaire aimed to collect self-monitoring data focusing on “busyness, physical condition, and mental condition.” This 14-item questionnaire was used for giving feedback and suggestions and was only displayed in the morning (Figure 1, left). For a good starting point, the first item was about the weather condition. The details of the other 13 items were as follows: (1) five items about busyness (Yes/No) (e.g. “Do you have some plans today?”), (2) five items about physical condition (Yes/So-so/No) (e.g. “Did you sleep well?”), and (3) three items about mental condition (Yes/So-so/No) (e.g. “Are you thinking positively?”). Since answering the same questions every day is boring for the user, there were variations (having the same meaning) for each item. The application selected one of the variations randomly.
Feedback and suggestions
On the basis of the self-monitoring data collected in the morning, the application gave feedback and suggestions. Usually, the feedback and suggestions given by a computer program are non-individualized; all users get the same tasks many times. However, feedback and suggestions for behavioral regulation should be different because they are based on the users’ mental state, so the application needs to have functionality to give feedback/suggestions on a case-by-case basis. In a face-to-face interview, a therapist is able to give appropriate suggestions by talking with the patient individually. However, our application is able to present variations in feedback/suggestions by analyzing the results obtained in self-monitoring.
For suggestions, we first listed four types for behavioral regulation (Table 1). The application selected two of them using the weighting of the scores for busyness, physical condition, and mental condition. There were three weighting levels for the physical and mental conditions (good, moderate, and bad) and there were nine patterns for combinations of them (Table 2). Additionally, the busyness score had two levels (heavy and light), so there were 18 patterns in total. Each pattern had three suggested actions, so the application had 54 suggested actions in total.
Table 1.
Types of suggestion.
| Type | Action and target user |
|---|---|
| Activate action (AA) | Action that activates mental condition without containing oneself. Displays response for user who is relatively fine both mentally and physically |
| Activate physical action (AP) | Action that activates mental condition by taking physical exercise, for example. Displays response for user who is relatively fine physically but has minor depressed mood |
| Activate mental action (AM) | Action that encourages refreshment. Displays response for user who is relatively fine mentally but feels tired |
| Deactivate action (DA) | Actions that encourage body relaxation. Displays response for user who feels very tired |
Table 2.
Combinations of suggestion types.
| Mental condition |
||||
|---|---|---|---|---|
| Good | Moderate | Bad | ||
| Physical condition | Good | DA or AM | DA or AM | DA or AM |
| Moderate | AP or AA | AP or AA | AM or AA | |
| Bad | AP or AA | AP or AA | AA or AP | |
AA: activate action; DA: deactivate action; AP: activate physical action; AM: activate mental action.
After users got the feedback comment based on the analysis of the self-monitoring results (e.g. “You need a rest today.”), then the application selected two of the three actions that are considered as appropriate patterns for users. Finally, the user chose one action as that suggested for the day from the presented actions.
Self-monitoring (evening)
When the user logged into the application in the evening, a different interface was displayed if the user had completed the self-monitoring in the morning. At this time, the virtual agent in the kimono first asked the user whether he or she had completed the suggested action. There were three answer options: (1) “Yes,” (2) “Only partially,” and (3) “No.” Once users had selected an option, a reward item was given to them. Finally, the users were asked to work out their mood score using the same questionnaire that was used in the morning.
Review
We designed a couple of graphs to show self-monitoring data. Figure 2 shows an example graph of the application. The graph on the left represents the three elements of the mood score, and that on the right shows the busyness and physical conditions. We used six graphs to show mood score, busyness, and physical condition (three graphs) in a week and a month view (two types). The highest and lowest scores of each condition were highlighted to support the user to understand self-awareness.
Figure 2.
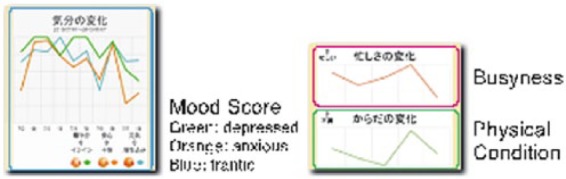
Graph representation in weekly style.
Results
Usage frequency
We analyzed the 30-day login history, which started from the first login day of the user. The average number of logins was 9.35 times and the median was 5 times. During the 30 days, 14 participants logged in 21–30 times, 23 were logged in 11–20 times, and 34 were logged in 2–10 times. A total of 27 participants logged into the application only once. The average number of logins was 12.52 times (excluding participants who logged in only once). By looking at the login interval (the number of days between two consecutive logins, one being the minimum), we analyzed participants who were logged in at least two times, and the average was 2.50 days. This means that not the long login interval but the dropout causes the low frequency of login times.
Completion rate of suggested action
Next, we analyzed the collected data to ascertain how many suggested actions had been completed in the trial. There were 797 time–day data sets for the 73 participants who reported both mood scores in the morning/evening and whether they had completed the suggested actions. We prepared 54 actions for the suggestions, but two actions were never presented to the participants. Among the 52 actions for whom the actions had been presented at least once, 4 had never been chosen by the participants, so 48 of them were included in the analysis. First, we calculated the completion rate (completed times/presented times). The overall completion rate was sufficiently high, the average completion rate was 71.52 percent, and the 40 actions were completed over 60 percent of the time (Table 3). On the other hand, there were six actions with a completion rate of 40 percent or less. Next, we calculated the completion rate for individuals. The overall completion rate was sufficiently high as well; 57 of the participants completed 60 percent or more of the actions, and the median was 77 percent.
Table 3.
Types of suggestion and completion rate.
| Type | No. selected | Completion rate (%) |
|---|---|---|
| Activate action (AA) | 137 | 62.77 |
| Activate physical action (AP) | 117 | 61.54 |
| Activate mental action (AM) | 187 | 80.21 |
| Deactivate action (DA) | 356 | 73.60 |
| 797 | 71.52 |
Looking at the suggestion distribution types, we found that though the deactivate action (DA) was frequently selected, the other suggestions were selected nearly as often. These included suggestions for improving heath both “mentally and physically” and suggestions pertaining to the use of “activating and deactivating action” functions. These indicate that participants activated and deactivated actions on the same basis, and that the application well guided them with respect to their behavior.
Mood improvement by completing suggested action
First, we calculated the differences in mood scores between morning and evening for each set of 797 time–day data. We then averaged the different scores for individuals who had completed the action and those who had not. For the former case, the mood score increased daily, the average change score being 12.7 points (N = 71, SD = 33.3). For the latter case, the mood score decreased, and the average was −2.8 points (N = 52, SD = 23.2). We analyzed the relationship between doing the suggested action and mood improvement. We used HLM 7.01 (http://www.ssicentral.com/hlm/) and the hierarchical linear model for this analysis (details are presented in Appendix 1). The results showed that the estimate of the mood improvement difference between a completed case and a not completed case was 13.4 points, and the difference was significant (standard error (SE) = 3.57, t(72) = 3.76, p < .001). These results enabled us to deduce that the user’s mood in the evening was improved as a result of doing the action suggested in the morning.
Mood improvement after 30-day trial
To consider the long-term changes in mood associated with using the application continuously, we first compared the K10 scores obtained in the pre-test with those obtained in the post-test. We received both pre- and post-test K10 data from 31 participants. Table 4 compares the results obtained from participants who took both tests and those who only took the pre-test. There was a significant difference in the number of logins between the two groups, so caution should be taken when interpreting the results.
Table 4.
K10 results (Welch’s method).
| Without post-test | With post-test | p-value | |
|---|---|---|---|
| Participants | n = 36 | n = 31 | |
| Gender: male, n (%) | 21 (58.3) | 13 (42.0) | .22 |
| Age, mean (SD) | 33.1 (12.6) | 32.9 (13.1) | .94, t (62.5) = .06 |
| Pre-test, mean (SD) | 21.6 (8.0) | 20.8 (7.8) | .71, t (64.0) = .38 |
| No. logins, mean (SD) | 9.0 (6.7) | 17.4 (9.2) | <.001, t (53.9) = −4.18 |
SD: standard deviation.
In the K10 questionnaire, a lower score is better and represents mental well-being; if the participant’s mental health improves, the score will decrease. We conducted an analysis including participants who only took the pre-test and logged into the application at least two times. In this test, we considered only 67 participants for purposes of accuracy. In this situation, hierarchical linear models (Appendix 1) can be used to include the data from participants who did not take the post-test. As a result, we were able to confirm that there was a significant decrease in the K10 score (t(66) = −2.21, p = .003). The average score decreased by 1.75 points. These results suggest that the mental state of participants tended to get better the longer they used the application continuously.
We also found that a correlation occurred between the change in K10 and the initial status of K10 (r = −.87). Participants with a high K10 score at the pre-test tended to show good improvement. Finally, we analyzed the mood improvement in individual participants. The participants for this analysis were those who took both the pre- and post-tests, so this was a within-subject design analysis. There were two groups for the analysis; one was a group of participants who were recognized as having mild depression (K10 ⩾ 25, n = 10), and the other was a group of participants who did not have depression (K10 ⩽ 24, n = 21). The results showed that the average score of the depressed group was significantly decreased by 4.5 (t(9) = −2.40, p = .04). Effect size d (Appendix 1) was −1.03. On the other hand, we found no significant differences between the results of the pre- and post-test in the non-depression group (t(20) = −0.28, p = .78) and d = −.06.
Discussion
The purpose of this study was to obtain knowledge that will enable further development to be pursued on preventive mental healthcare application through field trials of the SABORI system. We will discuss these points below.
Here, we will provide a brief summary of the field trial results. The participants used the application frequently and completed the suggested actions at a sufficiently high rate. Their mood scores significantly improved if they carried out the suggested actions. The K10 scores of the depression group significantly improved after using our application for 30 days. Judging from the overall results obtained, we feel that our application has very good possibilities to make significant contributions to managing personal mental health management even though we did not compare it with any control groups.
Mood improvement
The results we obtained that suggested the users’ mood was improved when they performed the actions suggested allowed us to deduce that our behavioral self-regulation system was able to at least to a certain degree help users to improve their state of mind.
In comparing the K10 scores, we got for the participants between the pre- and post-tests, a period of time that lasted for 30 days, and we found that there was no significant improvement for the people in the non-depression group. The post-test results we obtained for them were significantly lower than the pre-test results we obtained for the depression group. In this trial, however, we did not prepare any control group. Thus, we cannot deny the possibility that participants had recovered naturally. Ideally, a follow-up study should be performed on the incidence of mental disease to strictly verify the preventive effect.
Utilization
One of the biggest issues in CCBT personal mental healthcare application is the dropout rate. A survey by Kaltenthaler et al. reported that 18–38 percent of participants drop out during the session (Kaltenthaler et al., 2008). According to extensive meta-analysis, only 17 percent of users completed all CCBT treatment modules (Karyotaki et al., 2015). Participants dropped out due to multiple factors, for example, they felt that they could not be rewarded sufficiently or they felt clinicians would not recommend them as use cases. In any case, the CCBT dropout rate was higher than that of face-to-face psychological therapy. In our work, we found that 27 of the 98 participants (27.6%) logged into the application only once, which is in the range of the usual CCBT dropout rate. This was not a bad result and in fact was slightly higher than we had expected. As mentioned beforehand, in face-to-face therapy therapeutic alliance helps to maintain adherence to treatment (Lambert, 1992). It has also been confirmed that a therapeutic alliance was formed between people and an embodied conversational agent (Bickmore et al., 2010). Such an alliance could have been formed in the SABORI system between a user and a virtual agent in the same way as had been reported in previous work.
The SABORI application targets people who are not motivated by mental healthcare because the latter aims to prevent them from becoming victims of depression or anxiety. Therefore, it is difficult to compare the dropout rate in this study with other therapeutic applications. The therapeutic applications that have been described need high usage frequency to provide sufficient intervention; in contrast, our approach does not necessarily need high usage frequency. At this point, we cannot discuss whether the utilization rates we obtained in this study were sufficiently high by comparing them with those obtained in previous research. This is because there have been few studies on preventive mental health application, and thus, it is necessary to take long-term considerations into account.
Limitations and further problems
Since we did not prepare any control groups, we were not able to confirm the effects produced when the user did not use our application. Our findings were as follows: (1) the mental condition of depressed users was improved after the 30-day trial and (2) the mental condition of users who were recognized as being well by the pre-test was stable after the 30-day trial. The results suggested that the application has valid possibilities for being able to help regulate mildly depressive moods, but that it needs more trials and analysis to validate the validity of its concept. By the same token, we did not analyze users who did not start to use the application and why they did not choose to do so. Neither did we study how many and what types of users would like to use it continuously. Although we used an open participation process, there were 27 users who logged into the application only once. This indicates that we need to conduct a study on how we can make the application suitable for public use using it on a widespread basis.
The application did not compel participants to complete the suggested actions. Furthermore, since it was based on the participants’ decision on whether or not they would try to perform the suggested action, confounding variables might be the result. For example, they might try to perform the suggested action if they thought their mood would be improved. Further trials and analysis will be necessary to clarify these points. It will also be necessary to focus on data that were missing in the post-test. Almost all the participants who did not take the post-test stopped using the application after less than 30 days. The low number of usage cases reported suggests the strong possibility that the users’ mood was not improved as much as it would have been if they had taken a longtime use test. However, this application did not aim to provide a treatment environment; it aimed to give users an opportunity to execute self-management. It is natural that when users dropped out early, it was because they did not want to continue using the application because we did not force them to use it. Finally, we did not conduct any follow-ups. The effect of longtime usage beyond the 30-day trial needs to be evaluated before the application can be made more widely available.
Conclusion
We presented a personal preventive mental healthcare application that we call SABORI, which aimed to give users the chance to manage their mental health by monitoring their mental/physical conditions and regulating their behavior by performing actions suggested by the application. The application, as well as a field trial conducted on and discussions about it, enabled us to obtain knowledge about further development and problems on preventive mental healthcare application.
Acknowledgments
M.H., K.O., and H.S. designed the study and collected assembly of data. M.K. contributed to analysis and interpretation of data. D.S. wrote the draft of the manuscript. All authors have contributed to interpretation, and critically reviewed the manuscript. The authors are thankful to their colleagues who provided expertise that greatly assisted the research.
Appendix 1
Analyzing diurnal mood variation with hierarchical linear model
Mood improvement in a day (mood difference between morning and evening) of an individual i on day t: yit is an individual’s repeated measurement data, and we can analyze it with the hierarchical linear model. The relation between diurnal mood variation and whether the participant did or did not do the suggestion of the day is modeled as follows
| (A1) |
where xit is an indicator variable for whether the participant did or did not do the suggestion of the day. β0i represents the average of diurnal mood variation where individual i is did not do (xit = 0) the suggested action of the day. The diurnal mood variation that individual i did do the suggested action on a day (xit = 1) is represented by β0i + β1i, so β1i is the difference between diurnal mood variations (morning and evening) of did and did not do the suggested action, and it represents the effect of doing the suggested action for individual i. rit is the error.
It is assumed that there is a difference among individuals in the value of two parameters, β0i and β1i, and these two parameters follow the bivariate normal distribution. Therefore, the average of β1i represents the average effect of completing the suggested action.
Analyzing mood improvement after 30-day trial
The K10 score of pre-test and post-test was analyzed with the hierarchical linear model. The K10 score of individual i at time t (t = 0 for pre-test, t = 1 for post-test); yit is also modeled as equation A1. In this situation, xit is an indicator variable for time (xit = 0 for pre-test, xit = 1 for post-test). In the same manner as Appendix 1, β1i can be interpreted as the difference between the K10 score of pre-test and post-test for individual i, and the average of β1i represents the average of those differences.
Effect size
There are variations for the index of the effect size d. In our work, we define the effect size as follows
where Mpre and Mpost are the average score before and after the trial. SDpre is the SD before the trial.
Ethical permission for the study was obtained from the Office for Life Science Research Ethics and Safety, The University of Tokyo (#14-48).
Footnotes
Funding: This research was supported by Graduate Program for Social ICT Global Creative Leaders (GCL) of The University of Tokyo by Japan Society for the Promotion of Science.
References
- Andrews G, Cuijpers P, Craske MG, et al. (2010) Computer therapy for the anxiety and depressive disorders is effective, acceptable and practical health care: A meta-analysis. PLoS ONE 5(10): e13196. [DOI] [PMC free article] [PubMed] [Google Scholar]
- Bardram JE, Frost M, Faurholt-Jepsen M, et al. (2013) Designing mobile health technology for bipolar disorder: A field trial of the MONARCA system. In: Proceedings of the SIGCHI conference on human factors in computing systems (CHI 2013), Paris, 27 April–2 May, pp. 2627–2636. New York: ACM. [Google Scholar]
- Bardram JE, Frost M, Szántó K, et al. (2012) The MONARCA self-assessment system: A persuasive personal monitoring system for bipolar patients.In: Proceedings of the 2nd ACM SIGHIT international health informatics symposium (IHI 2012), Miami, FL, 28–30 January, pp. 21–30. New York: ACM. [Google Scholar]
- Bauer M, Grof P, Rasgon N, et al. (2006) Mood charting and technology: New approach to monitoring patients with mood disorders. Current Psychiatry Reviews 2: 423–429. [Google Scholar]
- Bickmore TW, Mitchell SE, Jack BW, et al. (2010) Response to a relational agent by hospital patients with depressive symptoms. Interacting with Computers 22: 289–298. [DOI] [PMC free article] [PubMed] [Google Scholar]
- Birney AJ, Gunn R, Russell JK, et al. (2016) MoodHacker mobile Web app with email for adults to self-manage mild-to-moderate depression: Randomized controlled trial. JMIR mHealth and uHealth 4(1): e8. [DOI] [PMC free article] [PubMed] [Google Scholar]
- Burns MN, Begale M, Duffecy J, et al. (2011) Harnessing context sensing to develop a mobile intervention for depression. Journal of Medical Internet Research 13(3): e55. [DOI] [PMC free article] [PubMed] [Google Scholar]
- Butler AC, Chapman JE, Forman EM, et al. (2006) The empirical status of cognitive-behavioral therapy: A review of meta-analyses. Clinical Psychology Review 26: 17–31. [DOI] [PubMed] [Google Scholar]
- Chinman M, Hassell J, Magnabosco J, et al. (2007) The feasibility of computerized patient self-assessment at mental health clinics. Administration and Policy in Mental Health 34: 401–409. [DOI] [PubMed] [Google Scholar]
- Christensen H, Griffiths KM, Jorm AF. (2004) Delivering interventions for depression by using the internet: Randomised controlled trial. BMJ 328: 265. [DOI] [PMC free article] [PubMed] [Google Scholar]
- Clarke G, Eubanks D, Reid E, et al. (2005) Overcoming depression on the Internet (ODIN) (2): A randomized trial of a self-help depression skills program with reminders. Journal of Medical Internet Research 7: e16. [DOI] [PMC free article] [PubMed] [Google Scholar]
- Cuijpers P, Van Straten A, Smit F. (2005) Preventing the incidence of new cases of mental disorders. The Journal of Nervous and Mental Disease 193: 119–125. [DOI] [PubMed] [Google Scholar]
- De la Vega R, Roset R, Galan S, et al. (2016) Fibroline: A mobile app for improving the quality of life of young people with fibromyalgia. Journal of Health Psychology. Epub ahead of print 24 May DOI: 10.1177/1359105316650509. [DOI] [PubMed] [Google Scholar]
- Dennis TA, O’Toole LJ. (2014) Mental health on the go: Effects of a gamified attention-bias modification mobile application in trait-anxious adults. Clinical Psychological Science 2(5): 576–590. [DOI] [PMC free article] [PubMed] [Google Scholar]
- Diamond G, Levy S, Bevans KB, et al. (2010) Development, validation, and utility of Internet-based, behavioral health screen for adolescents. Pediatrics 126: e163–e170. [DOI] [PubMed] [Google Scholar]
- Doherty G, Coyle D, Sharry J. (2012) Engagement with online mental health interventions: An exploratory clinical study of a treatment for depression. In:Proceedings of the SIGCHI conference on human factors in computing systems (CHI 2012), Austin, TX, 5–10 May, pp. 1421–1430. New York: ACM. [Google Scholar]
- Donker T, Van Straten A, Marks I, et al. (2009) A brief Web-based screening questionnaire for common mental disorders: Development and validation. Journal of Medical Internet Research 11(3): e19. [DOI] [PMC free article] [PubMed] [Google Scholar]
- Edwards-Stewart A. (2012) Using technology to enhance empirically supported psychological treatments: Positive activity jackpot. Journal of the Academy of Medical Psychology 3(2): 60–66. [Google Scholar]
- Fairburn CG, Rothwell ER. (2015) Apps and eating disorders: A systematic clinical appraisal. International Journal of Eating Disorders 48(7): 1038–1046. [DOI] [PMC free article] [PubMed] [Google Scholar]
- Gringras P, Santosh P, Baird G. (2006) Development of an Internet-based real-time system for monitoring pharmacological interventions in children with neurodevelopmental and neuropsychiatric disorders. Child: Care, Health and Development 32: 591–600. [DOI] [PubMed] [Google Scholar]
- Iloabachie C, Wells C, Goodwin B, et al. (2011) Adolescent and parent experiences with a primary care/Internet-based depression prevention intervention (CATCH-IT). General Hospital Psychiatry 33: 543–555. [DOI] [PMC free article] [PubMed] [Google Scholar]
- Kaltenthaler E, Parry G, Beverley C, et al. (2008) Computerised cognitive–behavioural therapy for depression: Systematic review. The British Journal of Psychiatry: The Journal of Mental Science 193: 181–184. [DOI] [PubMed] [Google Scholar]
- Karyotaki E, Kleiboer A, Smit F, et al. (2015) Predictors of treatment dropout in self-guided web-based interventions for depression: An “individual patient data” meta-analysis. Psychological Medicine 45(13): 2717–2726. [DOI] [PubMed] [Google Scholar]
- Kessler RC, Andrews G, Colpe LJ, et al. (2002) Short screening scales to monitor population prevalence and trends in non-specific psychological distress. Psychological Medicine 32: 959–976. [DOI] [PubMed] [Google Scholar]
- Koffel E, Kuhn E, Petsoulis N, et al. (2016) A randomized controlled pilot study of CBT-I coach: Feasibility, acceptability, and potential impact of a mobile phone application for patients in cognitive behavioral therapy for insomnia. Health Informatics Journal. Epub ahead of print 27 June DOI: 10.1177/1460458216656472. [DOI] [PubMed] [Google Scholar]
- Kuhn E, Greene C, Hoffman J, et al. (2014) Preliminary evaluation of PTSD coach, a smartphone app for post-traumatic stress symptoms. Military Medicine 179: 1–12. [DOI] [PubMed] [Google Scholar]
- Kuhn E, Weiss BJ, Taylor KL, et al. (2016) CBT-I Coach: A description and clinician perceptions of a mobile app for cognitive behavioral therapy for insomnia. Journal of Clinical Sleep Medicine 12(4): 597–606. [DOI] [PMC free article] [PubMed] [Google Scholar]
- Lambert MJ. (1992) Implications of Outcome Research for Psychotherapy Integration. Handbook of Psychotherapy Integration. New York: Basic Books. [Google Scholar]
- Lanata A, Valenza G, Nardelli M, et al. (2015) Complexity index from a personalized wearable monitoring system for assessing remission in mental health. IEEE Journal of Biomedical and Health Informatics 19(1): 132–139. [DOI] [PubMed] [Google Scholar]
- Lane ND, Choudhury T, Campbell A, et al. (2011) BeWell: A smartphone application to monitor, model and promote wellbeing. In: Proceedings of the pervasive health 2011, Dublin, 23–26 May. [Google Scholar]
- Lin JJ, Mamykina L, Lindtner S, et al. (2006) Fish“n”Steps: Encouraging physical activity with an interactive computer game. In: Dourish P, Friday A. (eds) UbiComp 2006: Ubiquitous Computing (UbiComp 2006, LNCS), vol. 4206 Berlin: Springer, pp. 261–278. [Google Scholar]
- Martinez SG, Badillo-Urquiola KA, Leis RA, et al. (2016) Investigation of multimodal mobile applications for improving mental health. In: Schmorrow D, Fidopiastis C. (eds) Foundations of Augmented Cognition: Neuroergonomics and Operational Neuroscience (AC 2016, Lecture Notes in Computer Science), vol. 9744 Berlin: Springer, pp. 333–343. [Google Scholar]
- Matthews M, Doherty G. (2011) In the mood: Engaging teenagers in psychotherapy using mobile phones. In: Proceedings of the SIGCHI conference on human factors in computing systems (CHI 2011), Vancouver, BC, Canada, 7–12 May, pp. 2947–2956. New York: ACM. [Google Scholar]
- Miloff A, Marklund A, Carlbring P. (2015) The challenger app for social anxiety disorder: New advances in mobile psychological treatment. Internet Interventions 2(4): 382–391. [Google Scholar]
- Nitsch M, Dimopoulos CN, Flaschberger E, et al. (2016) A guided online and mobile self-help program for individuals with eating disorders: An iterative engagement and usability study. Journal of Medical Internet Research 18(1): e7. [DOI] [PMC free article] [PubMed] [Google Scholar]
- Payne HE, Lister C, West JH, et al. (2015) Behavioral functionality of mobile apps in health interventions: A systematic review of the literature. JMIR mHealth and uHealth 3(1): e20. [DOI] [PMC free article] [PubMed] [Google Scholar]
- Pollak J, Gay G, Byrne S, et al. (2010) It’s time to eat! Using mobile games to promote healthy eating. IEEE Pervasive Computing 9(3): 21–27. [Google Scholar]
- Tolin DF. (2010) Is cognitive-behavioral therapy more effective than other therapies? A meta-analytic review. Clinical Psychology Review 30: 710–720. [DOI] [PubMed] [Google Scholar]
- Watts S, Mackenzie A, Thomas C, et al. (2013) CBT for depression: A pilot RCT comparing mobile phone vs. computer. BMC Psychiatry 13(1): 49. [DOI] [PMC free article] [PubMed] [Google Scholar]