

Abstract
Mycobacterium tuberculosis (Mtb) is the causative agent of tuberculosis, which kills 1.8 million annually. Mtb RNA polymerase (RNAP) is the target of the first-line antituberculosis drug rifampin (Rif). We report crystal structures of Mtb RNAP, alone and in complex with Rif, at 3.8–4.4 Å resolution. The results identify an Mtb-specific structural module of Mtb RNAP and establish that Rif functions by a steric-occlusion mechanism that prevents extension of RNA. We also report non-Rif-related compounds–Nα-aroyl-N-aryl-phenylalaninamides (AAPs)–that potently and selectively inhibit Mtb RNAP and Mtb growth, and we report crystal structures of Mtb RNAP in complex with AAPs. AAPs bind to a different site on Mtb RNAP than Rif, exhibit no cross-resistance with Rif, function additively when co-administered with Rif, and suppress resistance emergence when co-administered with Rif.
INTRODUCTION
Rifampin (Rif) is the cornerstone of current antituberculosis therapy (World Health Organization, 2016; Rothstein, 2016; Aristoff et al., 2010). The emergence and spread of Rif-resistant Mycobacterium tuberculosis (Mtb) is an urgent public-health crisis (0.6 million new cases annually; World Health Organization, 2016). Rif-resistance in Mtb arises from substitution of residues of the binding site for Rif on its molecular target, Mtb RNA polymerase (RNAP; Rothstein, 2016; Aristoff et al., 2010). Intensive efforts are underway to identify Rif derivatives that are unaffected by substitutions in the Rif binding site, and to identify novel, non-Rif-related RNAP inhibitors that function through binding sites on RNAP that do not overlap the Rif binding site and thus are unaffected by substitutions in the Rif binding site (Aristoff et al., 2010; Lee and Borukhov, 2016). However, these efforts have been hampered by the unavailability of structural information for Mtb RNAP or a closely related bacterial RNAP. Crystal structures of bacterial RNAP hitherto have been available only for Thermus aquaticus (Taq), Thermus thermophilus (Tth), and Escherichia coli (Eco) RNAP, which have ≤40% sequence identity with Mtb RNAP (Murakami, 2015), although a paper reporting a structure of Mycobacterium smegmatis RNAP has appeared (Hubin et al., 2017).
Here, we report a series of crystal structures of Mtb RNAP transcription initiation complexes at 3.8–4.4 Å resolution. We report structures of Mtb RNAP transcription initiation complexes alone, in complex with Rif, in complex with a non-Rif-related RNAP inhibitor, and in complex with both Rif and a non-Rif-related RNAP inhibitor.
RESULTS AND DISCUSSION
To determine crystal structures of Mtb RNAP transcription initiation complexes, we uused a strategy analogous to the strategy used previously to determine structures of Tth RNAP transcription initiation complexes (Zhang et al., 2012): i.e., crystallization of Mtb RNAP σA holoenzyme in complex with a synthetic nucleic-acid scaffold that mimics the ssDNA transcription bubble and downstream dsDNA of a catalytically competent RNAP promoter open complex (RPo), or with the same synthetic nucleic-acid scaffold in the presence of synthetic RNA oligomers corresponding to 2, 3, and 4 nt RNA products (RNAP-promoter initial transcribing complexes, RPitc2, RPitc3, and RPitc4; Table 1; Fig. 1).
Table 1.
Structure data collection and refinement statistics.
| complex | Mtb RPo | Mtb RPo + 2 nt RNA | Mtb RPo + 3 nt RNA | Mtb RPo + 4 nt RNA | Mtb RPo + Rif | Mtb RPo + Rif + 2 nt RNA | Mtb RPo + Rif + 3 nt RNA | Mtb RPo + Rif + 4nt RNA | Mtb RPo + AAP1 | Mtb RPo + D-IX336 | Mtb RPo + Rif + D-AAP1 | Mtb Se-β′MtbSI |
|---|---|---|---|---|---|---|---|---|---|---|---|---|
| PDB code | 5UHA | 5UH9 | 5UH5 | 5UH8 | 5UHB | 5UH6 | 5UHC | 5UHD | 5UHE | 5UHF | 5UHG | 5UH7 |
| data collection source | APS 19-ID | APS 19-ID | APS 19-ID | APS 19-ID | APS 19-ID | APS 19-ID | APS 19-ID | APS 19-ID | APS 19-ID | APS 19-ID | APS 19-ID | APS 19-ID |
| data collection | ||||||||||||
| space group | P212121 | P212121 | P212121 | P212121 | P212121 | P212121 | P212121 | P212121 | P212121 | P212121 | P212121 | P21 |
| cell dimensions | ||||||||||||
| a, b, c (Å) | 150.2,163.5,195.6 | 154.5,164.6,201.9.0 | 150.3,163.6,195.5 | 152.0,163.7,197.8 | 154.4,164.2,200.2 | 153.2,164.9,199.9 | 150.1,167.4,195.2 | 152.1,163.1,197.9 | 151.5,162.1,195.7 | 152.4,163.5,197.4 | 151.4,162.1,194.3 | 40.8, 97.5, 53.7 |
| α, β, γ (°) | 90.0, 90.0, 90.0 | 90.0, 90.0, 90.0 | 90.0, 90.0, 90.0 | 90.0, 90.0, 90.0 | 90.0, 90.0, 90.0 | 90.0, 90.0, 90.0 | 90.0, 90.0, 90.0 | 90.0, 90.0, 90.0 | 90.0, 90.0, 90.0 | 90.0, 90.0, 90.0 | 90.0, 90.0, 90.0 | 90.0, 93.3, 90.0 |
| resolution (Å) | 50.0–3.9 (4.0–3.9) | 50.0–4.4 (4.6–4.4) | 50.0–3.8 (3.9–3.8) | 50.0–4.2 (4.3–4.2) | 50.0–4.2 (4.4–4.2) | 50.0–3.8 (3.9–3.8) | 50.0–3.8 (3.9–3.8) | 50.0–4.0 (4.1–4.0) | 50.0–4.0 (4.2–4.0) | 50.0–4.3 (4.5–4.3) | 50.0–4.0 (4.1–4.0) | 50.0–2.2 (2.3–2.2) |
| number of unique reflections | 44080 | 31061 | 50207 | 35874 | 33,869 | 47,440 | 48,275 | 41,864 | 39805 | 32776 | 41653 | 21229 |
| Rmerge | 0.219 (0.837) | 0.191 (0.542) | 0.175 (0.710) | 0.172 (0.669) | 0.066 (0.543) | 0.134 (0.800) | 0.169 (0.903) | 0.096 (0.875) | 0.216 (0.716) | 0.203 (0.913) | 0.243 (0.801) | 0.075 (0.508) |
| Rmeas | 0.226 (0.877) | 0.202 (0.624) | 0.184 (0.764) | 0.183 (0.740) | 0.072 (0.609) | 0.142 (0.901) | 0.178 (0.965) | 0.101 (0.931) | 0.230 (0.781) | 0.212 (0.956) | 0.258 (0.862) | 0.086 (0.593) |
| Rpim | 0.057 (0.253) | 0.062 (0.300) | 0.055 (0.273) | 0.060 (0.299) | 0.028 (0.270) | 0.046 (0.401) | 0.053 (0.331) | 0.030 (0.312) | 0.076 (0.301) | 0.065 (0.428) | 0.087 (0.313) | 0.040 (0.302) |
| CC1/2 (highest resolution shell) | 0.422 | 0.539 | 0.471 | 0.489 | 0.697 | 0.432 | 0.343 | 0.413 | 0.524 | 0.632 | 0.490 | 0.791 |
| I/σI | 10.1 (1.5) | 7.6 (1.8) | 13 (2.0) | 8.8 (1.4) | 20.2 (2.0) | 14.2 (1.6) | 11.0 (2.0) | 23.5 (1.9) | 8.0 (1.9) | 10.3 (1.3) | 8.1(2.1) | 16.5 (5.4) |
| completeness (%) | 99.2 (99.4) | 93.3 (81.7) | 99.7 (99.3) | 96.1 (82.6) | 97.0 (89.0) | 97.7 (92.6) | 97.4 (94.3) | 99.8 (98.6) | 99.2 (96.7) | 99.0 (92.8) | 99.8 (99.9) | 99.4 (96.8) |
| redundancy | 15.0 (8.2) | 7.6 (3.4) | 10.4 (7.4) | 7.8 (4.4) | 5.9 (4.5) | 7.5 (4.3) | 9.9 (7.5) | 11.1 (8.2) | 7.4 (6.0) | 12.1 (8.5) | 8.3 (7.4) | 4.3 (3.5) |
| refinement | ||||||||||||
| resolution (Å) | 48.9–3.9 | 49.9–4.4 | 49.6–3.8 | 48.6–4.2 | 49.8–4.3 | 50.0–3.8 | 48.8–3.8 | 49.5–4.0 | 49.3–4.0 | 48.5–4.3 | 49.2–4.0 | 36.1–2.2 |
| number of unique reflections | 34564 | 28534 | 46464 | 29908 | 29,562 | 39,783 | 43,854 | 38,089 | 34622 | 28581 | 39399 | 18943 |
| number of test reflections | 1988 | 1993 | 1997 | 1987 | 2005 | 1996 | 2000 | 1990 | 2007 | 3135 | 2014 | 1835 |
| Rwork/Rfree | 0.22/0.27 (0.25/0.33) | 0.28/0.33 (0.30–0.34) | 0.19/0.24 (0.24–0.30) | 0.20/0.25 (0.21–0.25) | 0.21/0.26 (0.23–0.26) | 0.21/0.26 (0.25/0.31) | 0.20/0.26 (0.27–0.32) | 0.21/0.26 (0.26–0.32) | 0.21/0.26 (0.25/0.28) | 0.20/0.26 (0.24–0.30) | 0.22/0.26 (0.28–0.34) | 0.22/0.25 (0.30–0.34) |
| number of atoms | ||||||||||||
| protein | 25995 | 26033 | 26078 | 26098 | 25994 | 26033 | 26056 | 25973 | 25952 | 25973 | 25964 | 2153 |
| ligand/ion | 3 | 3 | 3 | 3 | 62 | 62 | 62 | 62 | 30 | 29 | 89 | |
| r.m.s.deviations | ||||||||||||
| bond lengths (Å) | 0.005 | 0.004 | 0.004 | 0.004 | 0.003 | 0.004 | 0.004 | 0.004 | ||||
| bond angles (°) | 0.793 | 0.681 | 0.763 | 0.692 | 0.709 | 0.730 | 0.733 | 0.737 | 0.005 | 0.003 | 0.003 | 0.010 |
| MolProbity statistics | ||||||||||||
| clashscore | 8.5 | 8.0 | 8.9 | 7.6 | 7.0 | 7.1 | 7.1 | 7.5 | 0.804 | 0.701 | 0.702 | 1.170 |
| rotamer | 1.8 | 1.4 | 2.2 | 1.4 | 1.3 | 1.6 | 1.7 | 1.6 | 9.4 | 8.0 | 7.4 | 5.4 |
| outliers(%) | ||||||||||||
| Cβ outliers (%) | 0 | 0 | 0 | 0 | 0 | 0 | 0 | 0 | 2.1 | 2.2 | 1.7 | 0.0 |
| Ramachandran plot | ||||||||||||
| favored (%) | 93.3 | 94.2 | 93.5 | 94.2 | 94.5 | 94.0 | 94.0 | 94.1 | 93.9 | 93.2 | 94.5 | 98.8 |
| outliers (%) | 0.7 | 0.5 | 0.7 | 0.6 | 0.5 | 0.5 | 0.5 | 0.5 | 0.5 | 0.8 | 0.5 | 0.0 |
Highest resolution shell in parentheses.
Fig. 1. Structure determination: Mtb RPo, Mtb RPitc2, Mtb RPitc3, and Mtb RPitc4.

(A) Structure determination. Top left, plasmids and strain for production of Mtb RNAP σA holoenzyme in E. coli (Jacques et al., 2006; Banerjee et al., 2014). Top right, Coomassie-stained SDS-polyacrylamide gel electrophoresis of Mtb RNAP σA holoenzyme produced in E. coli. Bottom, nucleic-acid scaffolds (left panels) and crystals (right panels).
(B) Overall structures and electron density. Left, overall structures. Gray, RNAP; yellow, σA; blue, −10 element of DNA nontemplate strand; light blue, discriminator element of DNA nontemplate strand; pink, rest of DNA nontemplate strand; red, DNA template strand; cyan, β′MtbSI; orange, σR1.1 H4; violet sphere, RNAP active-center Mg2+. Right, electron density and model for nucleic acids.
The resulting structures of Mtb RPo and RPitc are similar to previously reported structures of Tth RPo and RPitc (Zhang et al., 2012) in overall structural organization; in sequence-specific interactions between RNAP holoenzyme and promoter −10, discriminator, and core recognition elements; and in sequence-independent interactions between RNAP holoenzyme and template-strand ssDNA and downstream dsDNA (Figs. 1B–2, S1–S2).
Fig. 2. Conserved features of Mtb RPo and Tth RPo.

(A) Top, summary of protein-nucleic-acid interactions in Mtb RPo. Black residue numbers and lines, interactions by Mtb RNAP; green residue numbers and lines, interactions by Mtb σA; blue, −10 element of DNA nontemplate strand; light blue, discriminator element of DNA nontemplate strand; pink, rest of DNA nontemplate strand; red, DNA template strand; violet, Gray, RNAP; yellow, σA; blue, −10 element of DNA nontemplate strand; light blue, discriminator element of DNA nontemplate strand; pink, rest of DNA nontemplate strand; red, DNA template strand; cyan, taxon-specific sequence insertion β′MtbSI; orange, σR1.1 H4. active-center Mg2+; cyan boxes, bases unstacked and inserted into pockets. Residues numbered as in Mtb RNAP. Bottom, interactions of Mtb RNAP and Mtb σA with transcription-bubble non-template strand, transcription-bubble template strand, and downstream dsDNA.
(B) Top, summary of protein-nucleic-acid interactions in Tth RPo (Zhang et al., 2012). Residues numbered as in Eco RNAP. Bottom, interactions of Tth RNAP and Tth σA with transcription-bubble nontemplate strand, transcription-bubble template strand, and downstream dsDNA. Colors as in (A).
See Figs. S1–S2.
The structures reveal two distinctive features.
First, the structures reveal the conformation and interactions of a ~100 residue taxon-specific sequence insertion present in the β′ subunit of RNAP from Mycobacterial and closely related Acinetobacterial taxa (β′MtbSI; β′In1 in Lane and Darst. 2010; β′ residues Fig. 3A–C). The structures of Mtb RPo and RPitc show that β′MtbSI folds as an extraordinarily long (~70 Å) α-helical coiled-coil (Fig. 3A–B), and a structure at 2.2 Å resolution of an isolated protein fragment corresponding to β′MtbSI shows a superimposable conformation and thus shows that β′MtbSI folds independently (Fig. 3B; Table 1). In the structures of Mtb RPo and RPitc, the β′MtbSI coiled-coil emerges from the RNAP clamp module and extends across the RNAP active-center cleft (Fig. 3A,C). We infer that the β′MtbSI coiled-coil serves as a “gate” that helps trap and secure DNA within the active-center cleft. and that presumably must open, rotating about a “hinge” formed by the short unstructured segments connecting β′MtbSI to the remainder of β′, to allow DNA to enter the active-center cleft (Fig. 3C). Consistent with the inference from the structures that β′MtbSI helps trap and secure DNA within the active-center cleft, deletion of β′MtbSI strongly reduces the stability of Mtb RPo (10-fold defect; Fig. 3D). We suggest that the taxon-specific sequence insertion β′MtbSI, like the taxon-specific stabilizing general transcription factors CarD and RbpA (Davis et al., 2014; Hubin et al., 2017), is a Mycobacterial adaptation that helps overcome the unusual intrinsic instability of the Mycobacterial RPo (Davis et al., 2014).
Fig. 3. Distinctive features of Mtb RPo: taxon-specific sequence insertion β′MtbSI and σR1.1.

(A) Positions of taxon-specific sequence insertion β′MtbSI (cyan) and σR1.1 H4 (orange) in structure of Mtb RPo (two orthogonal views). Colors as in Fig. 1B.
(B) Structure of taxon-specific sequence insertion β′MtbSI. Top,, electron density and model for β′MtbSI from crystal structure of protein fragment Mtb β′(141–229). Blue sticks, β′MtbSI atoms; green mesh, mFo-Fc electron density omit map (contoured at 2.5σ). Bottom, Superimposition of β′MtbSI from structure of Mtb RPo (cyan) on β′MtbSI from structure of Mtb β′(141–229) (blue) (88 superimposed residues; rmsd = 0.65Å).
(C) Trapping of dsDNA in RNAP active-center cleft by β′MtbSI and σR1.1. Green and orange α-helices, σR1.1 in Eco RNA holoenzyme and Mtb RPo; green and orange dashed circles, approximate molecular volumes of σR1.1 in Eco RNAP holoenzyme and Mtb RPo. Other colors as in (A).
(D) Effects of deletion of β′MtbSI, σR1.1, or both on stability of Mtb RPo.
See Fig. S3.
Second, the structures provide information about the position of σR1.1, a σ module that, based on fluorescence resonance energy transfer (FRET) data, occupies the dsDNA binding site within the RNAP active-center cleft in RNAP holoenzyme but is displaced from the dsDNA binding site upon formation of RPo (Mekler et al., 2002; Fig. 3A,C). A structure of Eco RNAP holoenzyme shows that σR1.1 occupies the dsDNA binding site for dsDNA in RNAP holoenzyme (Bae et a., 2013), consistent with the FRET data (Mekler et al., 2002), but previous structures of bacterial RPo and RPitc have not resolved σR1.1 (Zhang et al., 2012). The structures of Mtb RPo and RPitc show clear, unambiguous electron density for one α-helix of σR1.1, the α-helix that connects σR1.1 to the remainder of σ (H4, numbered as in Zhang et al., 2012; Fig. 3A,C). Strikingly, whereas, in Eco RNAP holoenzyme, H4 is oriented perpendicular to the floor of the dsDNA binding site and occupies the dsDNA binding site (green in Figs. 1B, S8A), in Mtb RPo and RPitc, H4 is rotated by ~100°, about a “pivot” formed by the short unstructured segment between σR1.1 and the remainder of σ, and is oriented essentially parallel to the floor of the dsDNA binding site, outside the dsDNA binding site in Mtb RPo and RPitc (orange in Figs. 3C, S3). The rotation of H4 in RPo and RPitc displaces the center of H4 by ~30 Å from its position in RNAP holoenzyme, consistent with the FRET data (Mekler et al., 2002), and positions H4 between β′MtbSI and dsDNA (Figs. 3C, S3A). Assuming Mtb σR1.1 has approximately the same molecular volume as Eco σR1.1, σR1.1 in Mtb RPo and RPitc occupies essentially the entire space between β′MtbSI and dsDNA, potentially making a continuous chain of β′MtbSI-σR1.1-dsDNA interactions that close the active center and help trap and secure dsDNA in the active center (Figs. 3C, S3B). Consistent with this inference, deletion of Mtb σR1.1 strongly reduces the stability of Mtb RPo (5-fold defect), and deletion of both Mtb σR1.1 and β′MtbSI very strongly reduces the stability of RPo (>70-fold defect; Fig. 3D). We suggest that the stabilizing effect of Mtb σR1.1, functioning together with β′MtbSI, is a taxon-specific Mycobacterial adaptation that helps overcome the unusual intrinsic instability of Mycobacterial RPo (Davis et al., 2014). We note that, in Eco RNAP, in contrast to in Mtb RNAP, deletion of σR1.1 does not reduce the stability of RPo (Vuthoori et al. 2001).
We determined a crystal structure of Mtb RPo in complex with Rif using analogous procedures (Fig. 4A–C; Table 1). The experimental electron density for Rif could be fitted in a manner that placed the ansa ring of Rif in a ring-shaped density feature, placed the (4-methyl-1-piperazinyl)iminomethyl sidechain of Rif in an adjoining tab-shaped density feature, and positioned Rif H-bond-forming atoms adjacent to RNAP complementary H-bond-forming atoms (Fig. 4B–C). The resulting structure shows RNAP-Rif interactions similar to those in previously reported structures of Taq RNAP, Tth RNAP, and Eco RNAP in complex with rifamycins (Campbell et al., 2001; Artsimovitch et al., 2005; Molodtsov et al., 2013), but, in this case, with a Rif binding-site sequence from a bacterial species for which Rif is a clinically relevant antibacterial drug (Fig. 4B–C). The structure shows direct H-bonded contacts between Rif and two of the three residues most frequently substituted in Rif-resistant Mtb clinical isolates (β H526 and S531) and direct van der Waals interactions between Rif and the third (β D516) (Rothstein, 2016; Aristoff et al., 2010; Fig. 4B–C).
Fig. 4. Structural basis of Mtb RNAP inhibition by Rif.
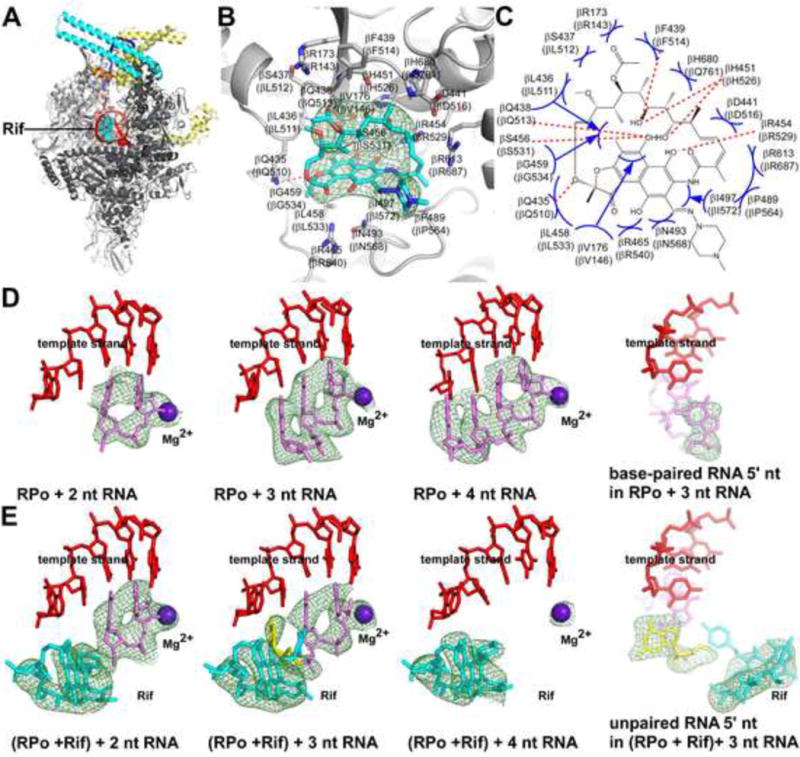
(A) Overall structure of Mtb RPo in complex with Rif. Cyan surface, Rif. Other colors as in Fig. 1B.
(B) Mtb RNAP-Rif interactions. Gray ribbons, RNAP backbone; gray and cyan sticks, RNAP and Rif carbon atoms; red and blue sticks, RNAP and Rif oxygen and nitrogen atoms; green mesh, mFo-Fc electron density omit map for Rif (contoured at 2.5σ). Residues numbered as in Mtb RNAP and, in parentheses, as in Eco RNAP.
(C) Summary of Mtb RNAP-Rif interactions. Red dashed lines, H-bonds; blue arcs, van der Waals interactions.
(D)–(E) “Steric occlusion” mechanism for RNAP inhibition by Rif. Subpanels 1–3 of (D), Mtb RNAP crystallized with nucleic-acid scaffolds containing 2, 3, and 4 nt RNAs; subpanel 4 of (D), orthogonal view of subpanel 2 showing base pairing of RNA 5′ nucleotide. Subpanels 1–3 of (E), Mtb RNAP-Rif crystallized with nucleic-acid scaffolds containing 2, 3, and 4 nt RNAs; subpanel 4 of (E), orthogonal view of subpanel 2 showing unpaired, unstacked, RNA 5′ nucleotide. Red, DNA template strand; pink, RNA; yellow, unpaired, unstacked RNA 5′ nucleotide; brown, Rif; violet sphere, active-center catalytic Mg2+; green mesh, mFo-Fc electron density omit map for Rif, RNA, and catalytic Mg2+ (contoured at 2.5σ).
A series of crystal structures of Mtb RPitc in complex with Rif, obtained by crystallizing a pre-formed Mtb RNAP-Rif complex with nucleic-acid scaffolds containing RNA oligomers corresponding to 2, 3, and 4 nt RNA products (Table 1). The results graphically demonstrate that Rif inhibits transcription through a “steric occlusion” mechanism that prevents extension of 2–3 nt RNA products to yield longer RNA products–a mechanism that previously had been proposed (Campbell et al., 2001; Mustaev et al., 1994; Feklistov et al. 2008), but that had not been directly demonstrated and had been controversial (Artsimovitch et al., 2005; Feklistov et al. 2008; Fig. 4D–E; Table 1). Thus, whereas, in the absence of Rif, 2, 3, and 4 nt RNA products fully base pair to the DNA template strand, (Fig. 4D), in the presence of Rif, the 5′ nucleotide of a 3 nt RNA is unpaired, unstacked, and rotated by ~40°, due to steric clash with Rif (Fig. 4E, second and fourth panels), and a 4 nt RNA appears to be unable to interact stably with the complex (i.e., shows no density; Fig. 4E, third panel). All the Mtb RPo-Rif and RPitc-Rif structures show clear, unambiguous electron density for the RNAP active-center catalytic Mg2+, unlike the structure of inconsistent with the alternative, “allosteric” mechanism for Rif function proposed in Artsimovitch et al., 2005 (Fig. 4D–E).
By high-throughput screening of a library of 114,000 synthetic compounds using a 384-well microplate-based fluorescence-detected assay of promoter-dependent transcription by Mtb RNAP σA holoenzyme (details to be provided elsewhere), we have identified a class of small-molecule inhibitors of Mtb RNAP: Nα-aroyl-N-aryl-phenylalaninamides (AAPs; Fig. 5A). The prototype of the class, D-AAP1, exhibits potent, selective, stereospecific activity against Mycobacterial RNAP (potent inhibition of Mtb RNAP, but poor inhibition of other bacterial RNAP and human RNAP I, II, and III; Figs. 5A, S4A) and exhibits potent, selective, stereospecific activity against Mycobacteria (potent activity against Mtb, M. avium, and M. smegmatis, but poor activity against other bacterial and mammalian cells; Figs. 5A, S4A).
Fig. 5. Structural basis of Mtb RNAP inhibition by AAPs.
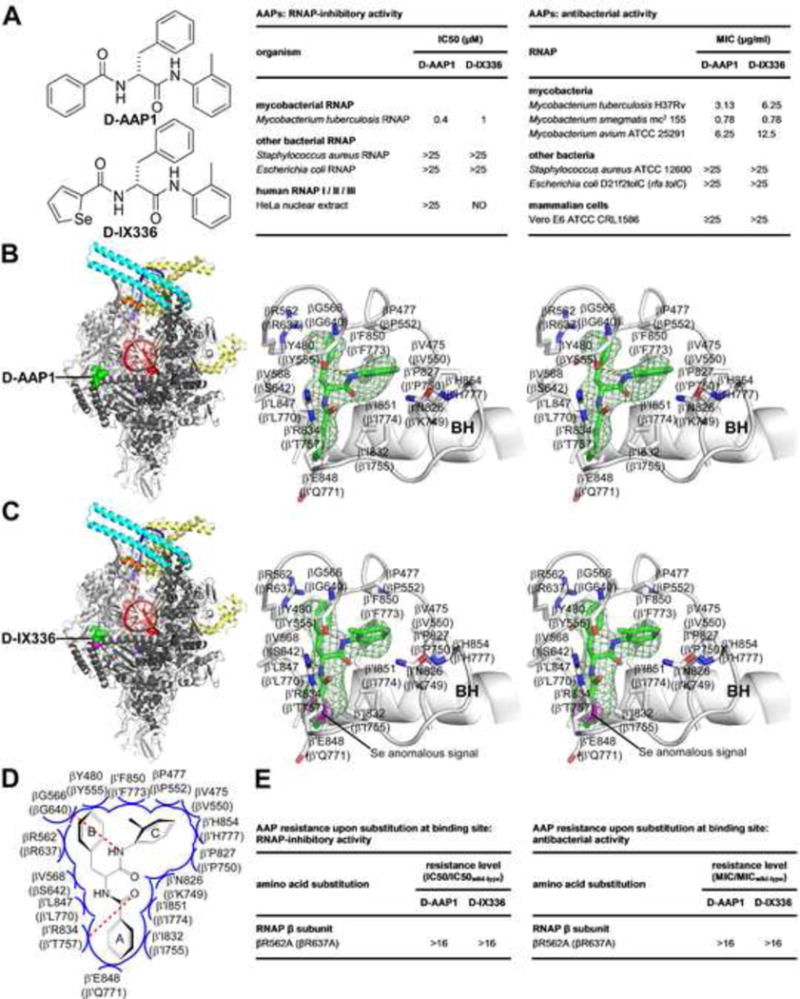
(A) Structures, RNAP-inhibitory activities, and antibacterial activities of D-AAP1 and selenium-containing analog D-IX336.
(B)–(C) Structures of Mtb RPo in complex with D-AAP1 and D-IX336 (left panels, overall structures; right subpanels, stereoviews of Mtb RNAP-inhibitor interactions). Green surface, inhibitor; pink surface, selenium; green and pink sticks, inhibitor carbon and selenium atoms; pink mesh, selenium anomalous difference density (contoured at 4.5σ); BH, RNAP bridge helix. Other colors and labels as in Fig. 4B.
(D) Summary of Mtb RNAP-inhibitor interactions. Colors and labels as in Fig. 2C.
(E) Effects of Ala substitution of binding-site residue.
See Figs. S4–S6.
A crystal structure of Mtb RPo in complex with D-AAP1, determined by soaking pre-formed crystals of Mtb RPo with D-AAP1, defines the binding site, orientation, and interactions of D-AAP1 (Fig. 5B; Table 1). Synthesis of a D-AAP1 analog containing a carbon-to-selenium substitution, D-IX336, followed by crystal soaking, X-ray diffraction analysis, and selenium-anomalous-dispersion analysis confirms the identified binding site, orientations, and interactions (Figs. 5A–C, S9B; Table 1). The structures reveal that AAPs bind to Mtb RNAP at a binding site centered on the N-terminus of the RNAP bridge helix (an α-helix that bridges the RNAP active-center cleft and forms one wall of the RNAP active center; Fig. 5B–C). The three aromatic rings of the AAP bind in three pocket-like subsites (Figs. 5B–D). Alanine substitution of a residue of the observed binding site results in AAP-resistance, both for RNAP-inhibitory activity and for antibacterial activity, confirming the functional importance of the observed interactions (Fig. 5E). The structures enable rational, structure-based optimization of AAPs to improve potencies and properties. In particular, the structures show that the methyl group of ring “C” of an AAP projects into an unoccupied area with volume sufficient to accommodate at least six non-H atoms (Figs. 5B–D), allowing substitution of this position with diverse chemical functionality, including both linear and cyclic substituents. Lead-optimization efforts (to be described elsewhere) confirm the utility of the structures for structure-based lead optimization, and, in particular, confirm the ability to improve potency and properties by substitution of the methyl group of ring “C.”
The structures in Fig. 5 show that the binding site on RNAP for AAPs differs from, and does not overlap, the binding site on RNAP for Rif (Figs. 4A, 5B–C). The binding site on RNAP for AAPs is similar in location to the binding site for CBRs, a class of compounds that inhibit Gram-negative bacterial RNAP but do not inhibit Mycobacterial RNAP; Artsimovitch et al., 2003; Feng et al., 2015; Bae et al., 2015; Fig. S11). Thus, both AAPs (in Mtb RNAP) and CBRs (in Gram-negative RNAP) interact with the RNAP bridge-helix N-terminus (Figs. 5B–D; S5). We infer that AAPs are Mycobacteria-selective inhibitors that function through the bridge-helix N-terminus target, and CBRs are Gram-negative-selective inhibitors that function through the bridge-helix N-terminus. Comparison of structures of Mtb RNAP-AAP complexes and Eco RNAP-CBR complexes reveals the basis for the difference in selectivity: i.e., because of sequence differences, Mtb RNAP has a three-pocket site complementary to an AAP, with three rings, but Eco RNAP has a two-pocket site complementary to a CBR, with two rings (Figs. S5–S6). The crucial sequence differences apparently include β residue 642 and β′ residues 757 and 771, which line or approach the pocket that is present, and accommodates AAP ring “A,” in Mtb RNAP, but is absent in Eco RNAP (residues numbered as in Eco RNAP; Figs. S5–S6). The binding site residues for AAPs and CBRs are not conserved in human RNAP I, RNAP II, and RNAP III (Fig. S6), consistent with, and accounting for, the observations that AAPs and CBRs do not inhibit human RNAP I, RNAP II, and RNAP III (Fig. 5A; Feng et al. 2015). Based on the similarity in binding sites of AAPs and CBRs, AAPs most likely inhibit RNAP through a mechanism similar to that of CBRs: i.e., interference with bridge-helix conformational dynamics required for nucleotide addition (Feng et al., 2015; Bae et al., 2015).
A structure of Mtb RPo in complex with both D-AAP1 and Rif further confirms unequivocally that the AAP binding site differs from, and does not overlap, the Rif binding site and shows that an AAP and Rif can bind simultaneously to RNAP (Fig. 6A; Table 1).
Fig. 6. Additive antibacterial activity and suppressed resistance emergence upon co-administration of D-AAP1 and Rif.

(A) Structure of Mtb RPo in complex with both D-AAP1 and Rif. Colors as in Figs. 4–5.
(B) Absence of cross-resistance of D-AAP1 and Rif.
(C) Additive antibacterial effects upon co-administration of D-AAP1 and Rif.
(D) Suppressed resistance emergence upon co-administration of D-AAP1 and Rif. BLD, below limit of detection.
The absence of overlap between the AAP and Rif binding sites (Fig. 6A) predicts that AAPs and Rif should not exhibit cross-resistance (since binding-site substitutions that interfere with binding of one compound should not affect binding of the other compound). Measurement of cross-resistance validates this prediction (Fig. 6B). Thus, a substitution in the AAP binding site confers AAP-resistance but not Rif-resistance, and substitutions in the Rif binding site confer Rif-resistance but not AAP-resistance (Fig. 6B).
The ability of AAPs and Rif to bind simultaneously to RNAP (Fig. 6A) predicts that co-administration of an AAP and Rif should result in additive antibacterial activity (since each compound should bind to its respective site and contribute to inhibition through its respective mechanism of inhibition). Measurement of inhibitor-inhibitor interactions in checkerboard interaction assays yields a fractional inhibitory concentration index (FICI) indicative of additive interactions, validating this prediction (Fig. 6C).
The absence of cross-resistance between AAPs and Rif (Fig 6B, together with the additive antibacterial activities of AAPs and Rif (Fig. 6C) predict that co-administration of an AAP and Rif should suppress resistance emergence (since resistance to co-administered AAP and Rif should require a rare double mutational hit inactivating two binding sites, rather than a single mutational hit inactivating one binding site). Luria-Delbrück fluctuation assays assessing spontaneous resistance rates for D-AAP1, Rif, and co-administered D-AAP1 and Rif, validate this prediction (Fig. 6D). Co-administering D-AAP1 and Rif results in a ≥750-fold reduction–to undetectable levels–in spontaneous resistance rates (Fig. 6D).
The structures presented here provide a foundation for understanding Mtb RNAP structure-function, for structure-based design of improved Rif derivatives effective against Rif-resistant Mtb, and for structure-based discovery and development of non-Rif-related Mtb RNAP inhibitors effective against Rif-resistant Mtb. The non-Rif-related Mtb RNAP inhibitors presented here–AAPs–exhibit potent antimycobacterial activity, no cross-resistance with Rif, additive antimycobacterial activity when co-administered with Rif, and suppression of resistance emergence–to undetectable levels–when co-administered with Rif. As such, AAPs represent exceptionally promising lead compounds for development of new antituberculosis drugs.
STAR*METHODS
CONTACT FOR REAGENT AND RESOURCE SHARING
Requests for further information or reagents should be directed to the corresponding author, Richard H. Ebright (ebright@waksman.rutgers.edu).
METHOD DETAILS
Nα-benzoyl-N-(2-methylphenyl)-D/L-phenylalaninamide (DL-AAP1)
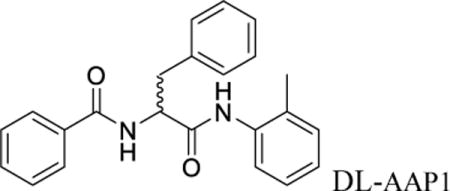
D/L-Benzoyl phenylalanine (32.2 mg; 120 μmol; Chem-Impex, Inc.) was dissolved in 2 ml anhydrous dimethylformamide at 25°C. To the solution, was added PS-carbodiimide (180 mg, 240 μmol; Biotage, Inc.) and hydroxybenzotriazole (24.3 mg; 180 μmol; Sigma-Aldrich, Inc.). The reaction mixture was stirred for 15 min under argon, o-toluidine (10.63 μl, 100 μmol; Sigma-Aldrich, Inc.) was added, and stirring was continued for 2 h. The mixture was filtered through a plug of glass wool and evaporated to dryness. The sample was re-dissolved in chloroform and purified by silica chromatography with chloroform as eluent. Yield: 31.9 mg, 89%. 1H-NMR (500 MHz, CDCl3): 3.25 (dd, 1H), δ 2.18 (s, 3H), 3.25 (dd, 1H), 3.35 (dd, 1H), 5.05 (dd, 1H), 6.8–7.8 (m; 14H, aryl protons). MS (MALDI): calculated: m/z 359.43 (MH+); found: 359.35, 381.33 (M+Na+).
Nα-benzoyl-N-(2-methylphenyl)-D-phenylalaninamide (D-AAP1)
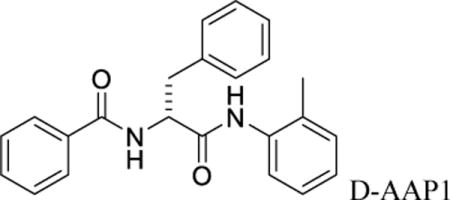
D-AAP1 was prepared as for DL-AAP1, but using D-benzoyl phenylalanine (Chem-Impex, Inc.) in place of D/L-benzoyl phenylalanine. The product (100 μg) was dissolved in isopropanol (100 μl) and purified by chiral HPLC on a 4.6 × 250 mm ChiralPak IA column (ChiralPak, Inc.) in 10% isopropanol in hexanes at 1 ml/min. Two peaks were observed, one exhibiting a retention time of 14 min and an integrated area of 1.1 arbitrary units (assigned as the D stereoisomer, D-AAP1; 10% enantiomeric excess), and another exhibiting a retention time of 17 min and an integrated area of 1.0 arbitrary unit (assigned as the L stereoisomer, L-AAP1). The peak assigned as the D stereoisomer was collected. MS (MALDI): calculated: m/z 359.43 (MH+); found: 359.35, 381.33 (M+Na+). Optical rotation in dimethylformamide, .
Nα-benzoyl-N-(2-methylphenyl)-L-phenylalaninamide (L-AAP1)
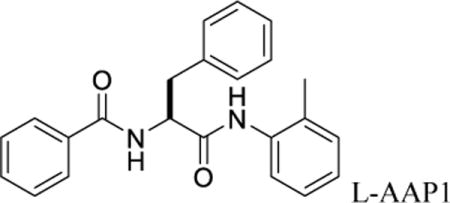
L-AAP1 was prepared as for D-AAP1, but using L-benzoyl phenylalanine (Chem-Impex, Inc.) in place of D-benzoyl phenylalanine. Two peaks were observed, one exhibiting a retention time of 14 min and an integrated area of 1.0 arbitrary unit (assigned as the D stereoisomer, D-AAP1), and another exhibiting a retention time of 17 min and an integrated area of 1.1 arbitrary units (assigned as the L stereoisomer, L-AAP1; 10% enantiomeric excess). The peak assigned as the L stereoisomer was collected. MS (MALDI): calculated: m/z 359.43 (MH+); found: 359.35, 381.33 (M+Na+). Optical rotation in dimethylformamide, .
Nα-selenophenoyl-N-(2-methylphenyl)-D-phenylalaninamide (D-IX336)

To a suspension of N-Fmoc-D-phenylalanine (2 g, 5.16 mmol; Chem-Impex, Inc.) in 20 ml dichloromethane was added oxalyl chloride (0.66 ml, 7.74 mmol; Sigma-Aldrich, Inc.) and 200 μl dimethylformamide. After stirring for 30 min, the reaction mixture was evaporated to dryness (to remove any trace of unreacted oxalyl chloride) and re-dissolved in 30 ml dichloromethane. O-toluidine (0.554 ml, 5.16 mm; Sigma-Aldrich, Inc.) was added drop-wise followed by addition of DIPEA (1.08 ml, 6.19 mm). The reaction was stirred for 2 h, and 0.5 M HCl was used to acidify the mixture, which was then extracted with 3 × 30 ml dichloromethane. The organic extract was filtered, washed with brine, dried with anhydrous sodium sulfate, and evaporated to a solid, providing (9H-fluoren-9-yl) methyl (R)-(1-oxo-3-phenyl-1-(o-tolylamino) propan-2-yl) carbamate, which was used without purification in the next step. Crude yield: 1.2 g, 49%. MS (MALDI): calculated: m/z 476.58 (MH+); found: 477.13.
To 0.2 g (9H-fluoren-9-yl) methyl (R)-(1-oxo-3-phenyl-1-(o-tolylamino)-propan-2-yl) carbamate in 15 ml dichloromethane was added 0.16 ml piperidine. The reaction mixture was stirred for 6 h, evaporated, and purified by silica chromatography with 2% methanol in dichloromethane. The lower-eluting fractions were pooled and re-purified by silica chromatography (25–100% ethyl acetate/hexanes), providing (R)-2-amino-3-phenyl-N-(o-tolyl)propanamide. Yield: 17.6 mg, 17%. MS (MALDI): calculated: m/z 412.36 (MH+); found: 413.01.06, 434.99 (M+Na+).
To (R)-2-amino-3-phenyl-N-(o-tolyl)-propanamide (17.6 mg, 69 μmol) in 0.5 ml dichloromethane, was added selenophene-2-carboxylic acid (18.2 mg in 0.5 ml dichloromethane, 104 μmol, LabNetwork), DIPEA (18.2 μl, 104 μmol) and propane phosphonic acid anhydride (T3P; 88.6 μl, 140 μmol; Sigma-Aldrich, Inc. as 50% solution in ethyl acetate). The reaction mixture was stirred for 22 h and then evaporated to an oil. The resulting oil was re-dissolved in 10 ml ethyl acetate, washed with 5 ml 0.5M HCl, 5 ml saturated sodium bicarbonate, 5 ml brine, dried with anhydrous sodium sulfate, and evaporated to dryness. The crude material was purified by semi-preparative reverse-phase HPLC (25 × 10 mm Jupiter C18, 10 μm, 300 Å; 30–60% B in 30 min; A = 0.1% trifluoroacetic acid; B = 0.1% trifluoroacetic acid in acetonitrile; 4 ml/min; Phenomenex, Inc.), providing D-IX336. Yield: 7 mg, 25%. MS (MALDI): calculated: m/z 254.33 (MH+); found: 255.06, 277.03 (M+Na+). 1H-NMR (500 MHz, CDCl3): δ 8.22 (d, 1H), 7.79 (d, 1H), 7.65 (s, 1H), 7.55(br s, 1H), 7.00–7.40 (m, 9H), 6.70 (d, 1H), 4.80 (m, 1H), 3.20 (dd, 1H), 3.38 (dd, 1H), 1.99 (s, 3H).
M. tuberculosis σA
E. coli strain BL21(DE3) (Invitrogen, Inc.) was transformed with plasmid pET30a-Mtb-σA (Jacques et al., 2006), encoding N-terminally hexahistidine-tagged Mtb σA under control of the bacteriophage T7 gene 10 promoter. Single colonies of the resulting transformants were used to inoculate 50 ml LB broth containing 50 μg/ml kanamycin, and cultures were incubated 16 h at 37°C with shaking. Aliquots (10 ml) were used to inoculate 1 L LB broth containing 50 μg/ml kanamycin, cultures were incubated at 37°C with shaking until OD600 = 0.8, cultures were induced by addition of IPTG to 1 mM, and cultures were incubated overnight at 16°C. Cells were harvested by centrifugation (4,000 × g; 15 min at 4 °C), re-suspended in 20 ml buffer A (10 mM Tris-HCl, pH 7.9, 0.2 M NaCl, 5% glycerol), and lysed using an EmulsiFlex-C5 cell disrupter (Avestin, Inc.). The lysate was centrifuged (20,000 × g; 30 min at 4°C), and the supernatant was loaded onto a 5 ml column of Ni-NTA-agarose (Qiagen, Inc.) equilibrated in buffer A. The column was washed with 50 ml buffer A containing 40 mM imidazole and eluted with 25 ml buffer A containing 250 mM imidazole. The sample was further purified by anion-exchange chromatography on a Mono Q column 10/100 GL (GE Healthcare, Inc.; 160 ml linear gradient of 300–500 mM NaCl in 10 mM Tris-HCl, pH 7.9, 0.1 mM EDTA, 5 mM dithiothreitol, and 5% glycerol; flow rate = 1 ml/min). Fractions containing σA were pooled, were concentrated to ~15 mg/ml using 30 kDa MWCO Amicon Ultra-15 centrifugal ultrafilters (Millipore, Inc.) and stored at −80°C. Yields were ~10 mg/L, and purities were >95%.
Mtb σA was prepared analogously, using plasmid pET30a-Mtb-σA(ΔR1.1), encoding N-terminally hexahistidine-tagged Mtb σA(225–528) under control of the bacteriophage T7 gene 10 promoter [constructed by replacing the EcoRI-NotI segment of plasmid pET30a (EMD Millipore, Inc.) by the EcoRI-NotI DNA segment of a DNA fragment carrying TTAGAATTC, followed by codons 225–528 of Mtb sigA, followed by TAAGCGGCCGCTAA, generated by PCR with plasmid pET30a-Mtb-σA as template].
M. tuberculosis β′MtbSI
E. coli strain BL21 (DE3) (Invitrogen, Inc.) was transformed with plasmid pET28a-β′MtbSI, encoding N-hexahistidine-tagged β′MtbSI u nder control of the bacteriophage T7 gene 10 promoter [constructed by replacing the NdeI-EcoRI segment of plasmid pET28a (EMD Millipore, Inc.) with the NdeI-EcoRI DNA segment of a DNA fragment carrying TTACATATG, followed by codons 141–229 of Mtb rpoC, followed by TAAGAATTCTAA, generated by PCR with plasmid pCOLADuet-rpoB-rpoC (Banerjee et al., 2014) as template]. Single colonies of the resulting transformants were used to inoculate 50 ml LB broth containing 50 μg/ml kanamycin, and cultures were incubated 16 h at 37°C with shaking. Aliquots (10 ml) were used to inoculate 1 L LB broth containing 50 μg/ml kanamycin, cultures were incubated at 37°C with shaking until OD600 = 0.8, cultures were induced by addition of IPTG to 1 mM, and cultures were incubated overnight at 16°C. Cells were harvested by centrifugation (4,000 × g; 15 min at 4°C), re-suspended in 20 ml buffer A (10 mM Tris-HCl, pH 7.9, 0.2 M NaCl, 5% glycerol), and lysed using an EmulsiFlex-C5 cell disrupter (Avestin, Inc.). The lysate was centrifuged (20,000 × g; 30 min at 4°C), and the supernatant was loaded onto a 5 ml column of Ni-NTA-agarose (Qiagen, Inc.) equilibrated in buffer A. The column was washed with 50 ml buffer A containing 40 mM imidazole and eluted with 25 ml buffer A containing 250 mM imidazole. The sample was further purified using by gel filtration on a HiLoad 16/60 Superdex 200 prep grade column (GE Healthcare, Inc) in 20 mM Tris-HCl, pH 8.0, 75 mM NaCl, 5 mM MgCl2, and was concentrated to ~10 mg/L in the same buffer using 10 kDa MWCO Amicon Ultra-15 centrifugal ultrafilters (Millipore, Inc.) and stored at −80°C. Yields were ~20 mg/L, and purities were >95%.
Selenomethionine-substituted β′MtbSI protein was produced using plasmid pET28a-β′MtbSI and the procedures of Stols et al, 2004 and was purified as for native β′MtbSI.
M. tuberculosis RNAP core enzyme
Mtb RNAP core enzyme and RNAP core enzyme derivatives were prepared from cultures of E. coli strain BL21 (DE3) (Invitrogen, Inc.) co-transformed with plasmids pACYC-rpoA, pCOLADuet-rpoB-rpoC, and pCDF-rpoZ (Banerjee et al., 2014), or derivatives thereof constructed using site-directed mutagenesis (QuikChange Kit; Agilent Technologies, Inc.), using procedures as in Banerjee et al., 2014.
M. tuberculosis RNAP σA holoenzyme
Mtb RNAP σA holoenzyme and RNAP σA holoenzyme derivatives were prepared from cultures of E. coli strain BL21 (DE3) (Invitrogen, Inc.) co-transformed with plasmids pACYC-rpoA-sigA, pETDuet-rpoB-rpoC and pCDF-rpoZ (Banerjee et al., 2014), or derivatives thereof constructed using site-directed mutagenesis (QuikChange Kit; Agilent Technologies, Inc.), using procedures as in Banerjee et al., 2014.
Oligonucleotides
Oligodeoxyribonucleotides (Integrated DNA Technologies, Inc.) and oligoribonucleotides (GpA, GpGpA, and UpCpGpA; Trilink, Inc.) were dissolved in nuclease-free water (Ambion, Inc.) to 3 mM and stored at −80°C.
Nucleic-acid scaffolds
Nucleic-acid scaffolds RPo, RPitc3, and RPitc4 (sequences in Fig. 1A) were prepared as follows: Nontemplate-strand oligodeoxyribonucleotide (0.5 mM), template-strand oligodeoxyribonucleotide (0.55 mM), and, where indicated, 3 nt or 4 nt oligoribonucleotide (1 mM) in 40 μl 5 mM Tris-HCl, pH 7.7, 0.2 M NaCl, and 10 mM MgCl2 were heated 5 min at 95°C, cooled to 25°C in 2°C steps with 1 min per step using a thermal cycler (Applied Biosystems, Inc.), and stored at −80°C.
RNAP-DNA interaction assays
Stabilities of Mtb RPo were assessed using fluorescence polarization assays (Heyduk et al., 1996) in a 96-well microplate format. Reaction mixtures contained (100 μl): 0–320 μM Mtb RNAP σA holoenzyme or derivative, 10 nM Cy3-labelled nucleic-acid scaffold RPo (sequence in Fig. 1A; Cy3 incorporated at 5′ end of nontemplate strand), 20 mM Tris-HCl, pH 8.0, 250 mM NaCl, 5 mM MgCl2, and 5 mM dithiothreitol. Reaction mixtures were incubated 10 min at 25°C, and fluorescence emission intensities were measured using a microplate reader equipped with polarizers (GENios Pro; TECAN, Inc; excitation wavelength = 550 nm; emission wavelength = 570 nm). Fluorescence polarization was calculated using:
| (1) |
where IVV and IVH are fluorescence intensities with the excitation polarizer at the vertical position and the emission polarizer at, respectively, the vertical position and the horizontal position.
Equilibrium dissociation constants, KD, were extracted by non-linear regression using:
| (2) |
where P is fluorescence polarization at RNAP concentration R, Po is fluorescence polarization in the absence of RNAP, and Pb is the fluorescence polarization in the presence of a saturating RNAP concentration.
RNAP-inhibitory activities
Fluorescence-detected RNAP-inhibition assays were performed using the profluorescent substrate γ-[2′-(2-benzothiazoyl)-60-hydroxybenzothiazole]-ATP [BBT-ATP; Jena Bioscience; procedures as in Feng et al., 2015, using 150 nM Mtb RNAP core enzyme plus 600 nM Mtb σA, 75 nM Eco RNAP σ70 holoenzyme (prepared as in Zhang et al., 2014), or 75 nM S. aureus RNAP core enzyme and 300 nM S. aureus σA (prepared as in Srivastava et al., 2011) and 20 nM DNA fragment containing bacteriophage T5 N25 promoter (prepared as in Zhang et al., 2014)].
Radiochemical assays with human RNAP I/II/III were performed as in Degen et al., 2014. Half-maximal inhibitory concentrations (IC50s) were calculated by non-linear regression in SigmaPlot (SPSS, Chicago, IL).
Growth-inhibitory activities
Minimal inhibitory concentrations (MICs) for Mtb H37Rv and M. avium ATCC 25291 were quantified in microplate Alamar Blue assays (procedures as in Collins and Franzblau, 1997).
MICs for M. smegmatis mc2 155, M. smegmatis ATCC 19420, and derivatives thereof were quantified in broth microdilution assays [procedures essentially as in CLSI/NCCLS, 2009, using 7H9 broth (BD Biosciences, Inc.) supplemented with 0.5% glycerol, and 0.05 % Tween-80, and using a starting cell density of 2–5×10⁵ cfu/ml, and incubation 72 h at 37°C.
MICs for Staphylococcus aureus ATCC 12600, Escherichia coli D21f2tolC, and mammalian cells (Vero E6) were determined as in Degen et al., 2014.
Resistance and cross-resistance assays
M. smegmatis mc2 155 (rpoB′637′A), a derivative of M. smegmatis mc2 155 having a chromosomal rpoB gene that encodes a derivative of RNAP β subunit having a substitution corresponding to Eco β R637A, was constructed using recombineering with targeting oligonucleotide 5′-GGCGGAGACGAACTCGACCTCGCCGCCCTTCTTGGCGACCATGACGCGGTCCTCGGTGAAGC GGCCGTTCTC-3′ [procedures as in Murphy et al,., 2015; selected on Seven H11 agar (BD Biosciences, Inc.) containing Middlebrook ADC enrichment (BD Biosciences, Inc.), 0.5% glycerol, and 30 μg/ml D-AAP1; confirmed by PCR amplification and sequencing or rpoB and rpoC].
M. smegmatis ATCC 19420 (rpoB′526′Y) and ATCC 19420 (rpoB′531′L), ATCC 19420 derivatives having chromosomal rpoB genes that encode RNAP β subunits having substitutions that correspond to Eco β H526Y and Eco β S5331L, were obtained as spontaneous Rif-resistant mutants (selected on Seven H11 agar containing Middlebrook ADC enrichment, 0.5% glycerol, and 50 μg/ml Rif; confirmed by PCR amplification and sequencing of rpoB and rpoC].
Resistance and cross-resistance levels were determined in broth microdilution assays (see above, “Growth-inhibitory activities”), using final concentrations of 0.0015–50 μg/ml D-AAP or Rif.
Checkerboard interaction assays
To assess antibacterial activities of combinations of D-AAP1 and Rif, broth-microdilution assays with M. smegmatis ATCC 19420 (see above, “Growth inhibitory activities”) were performed in a checkerboard format (Horrevorts et al., 1987; White et al., 1996; Meletiadis et al., 2010), analyzing in quintuplicate, all pairwise combinations of D-AAP1 at 4.00×, 3.50×, 3.00×, 2.67×, 2.63×, 2.50×, 2.33×, 2.25×, 2.00×, 1.88×, 1.75×, 1.67×, 1.50×, 1.33×, 1.25×, 1.13×, 1.00×, 0.750×, 0.667×, 0.500×, 0.375×, 0.333×, and 0.250 MIC (MICD-AAP1 = 0.20 μg/ml) with Rif at 1.33×, 1.17×, 1.00×, 0.875×, 0.833×, 0.750×, 0.667×, 0.656×, 0.625×, 0.500×, 0.469×, 0.375×, 0.333×, 0.281×, 0.250×, 0.188×, 0.167×, 0.125×, and 0.094× MIC (MICRif = 3.13 μg/ml). Minimum and maximum fractional inhibitory concentrations indices (FICImax and FICImin) were calculated as in White et al., 1996. FICImin ≤ 0.5 was deemed indicative of super-additivity (synergism), FICImin > 0.5 and FICImax ≤ 4.0 was deemed indicative of additivity, and FICImax > 4.0 was deemed indicative of sub-additivity (antagonism) (White et al., 1996; Meletiadis et al., 2010).
Resistance-rate assays
Resistance rates were determined using fluctuation assays essentially as in Srivastava et al., 2012. Defined numbers of cells of M. smegmatis ATCC 19420 (~109 cfu/plate) were plated on Seven H11 agar containing Middlebrook ADC enrichment, 0.5% glycerol, and either 1.56 μg/ml D-AAP1, 50 μg/ml Rif, or both 1.56 μg/ml D-AAP1 and 50 μg/ml Rif; and numbers of colonies were counted after 72 h at 37°C (at least 4 determinations for each concentration of each test compound). Resistance rates were calculated using the Ma-Sandri-Sarkar Maximum Likelihood Estimator (Ma et al., 1992; Sarkar et al., 1992) as implemented on the Fluctuation Analysis Calculator (FALCOR; www.keshavsingh.org/protocols/FALCOR.html; Hall et al., 2009). Sampling correction was performed as in Stewart et al., 1990.
Structure determination: assembly of transcription initiation complexes
For Mtb RPo, RPitc3, and RPitc4, complexes for crystallization were prepared by mixing 16 μl 50 μM Mtb RNAP σA holoenzyme (in 20 mM Tris-HCl, pH 8.0, 75 mM NaCl, 5 mM MgCl2, and 5 mM dithiothreitol) and 4 μl 0.4 mM of nucleic-acid scaffold RPo, RPitc3, or RPitc4 (in 5 mM Tris-HCl, pH 7.7, 0.2 M NaCl, and 10 mM MgCl2) and incubating 1 h at 25°C. For Mtb RPitc2, the complex for crystallization was prepared by mixing 16 μl 50 μM Mtb RNAP holoenzyme (in 20 mM Tris-HCl, pH 8.0, 75 mM NaCl, 5 mM dithiothreitol, 5 mM MgCl2), 4 μl 0.4 mM of nucleic-acid scaffold RPo (in 5 mM Tris-HCl, pH 7.7, 0.2 M NaCl, and 10 mM MgCl2), and 1 μl 25 mM GpA (in water), and incubating 1 h at 25°C. For Mtb RPo, RPitc3, and RPitc4 in complex with Rif, complexes for crystallization were prepared by incubating 16 μl 50 μM Mtb RNAP σA holoenzyme (in 20 mM Tris-HCl, pH 8.0, 75 mM NaCl, 5 mM MgCl2, and 5 mM dithiothreitol,) and 0.5 μl 8 mM Rif (Sigma-Aldrich, Inc.), 0.5 h at 25°C, and then adding 4 μl 0.4 mM of nucleic-acid scaffold RPo, RPitc3, or RPitc4 (in 5 mM Tris-HCl, pH 7.7, 0.2 M NaCl, and 10 mM MgCl2), and incubating 1 h at 25°C. For Mtb RPitc,2 in complex with Rif, the complex for crystallization was prepared by incubating 16 μl 50 μM Mtb RNAP σA holoenzyme (in 20 mM Tris-HCl, pH 8.0, 75 mM NaCl, 5 mM MgCl2, and 5 mM dithiothreitol) and 0.5 μl 8 mM Rif, 0.5 h at 25°C, and then adding 4 μl 0.4 mM of nucleic-acid scaffold RPo (in 5 mM Tris-HCl, pH 7.7, 0.2 M NaCl, and 10 mM MgCl2) and 1 μl 25 mM GpA (in water) and incubating 1 h at 25°C.
Structure determination: crystallization, cryo-cooling, and crystal soaking
Robotic crystallization trials were performed for Mtb RPo and β′MtbSI using a Gryphon liquid handling system (Art Robbins Instruments, Inc.), commercial screening solutions (Emerald Biosystems, Inc.; Hampton Research, Inc.; and Qiagen, Inc.), and the sitting-drop vapor diffusion technique [drop: 0.2 μl transcription initiation complex (previous section) or 0.2 μl 500 μM β′MtbSI (in 20 mM Tris-HCl, pH 8.0, 75 mM NaCl, 5 mM MgCl2, and 5 mM dithiothreitol) plus 0.2 μl screening solution; reservoir: 60 μl screening solution; 22°C]. 900 conditions were screened. Under several conditions, Mtb RPo crystals appeared within two week, and β′MtbSI crystals appeared within one week. Conditions were optimized using the hanging-drop vapor-diffusion technique at 22°C. The optimized conditions for Mtb RPo (drop: 1 μl RPo in 20 mM Tris-HCl, pH 8.0, 75 mM NaCl, 5 mM MgCl2, and 5 mM dithiothreitol plus 1 μl 50 mM Tris-HCl, pH 8.2, 200 mM KCl, 50 mM MgCl2, and 10% PEG3350 plus 0.2 μl 80.0 mM CHAPSO; reservoir: 400 μl 50 mM Tris-HCl, pH 8.2, 200 mM KCl, 50 mM MgCl2, and 10% PEG3350; 22°C) yielded high-quality, rod-like crystals with dimensions of 0.4 mm × 0.1 mm × 0.1 mm in two weeks (Fig. 1A). The optimized conditions for β′MtbSI (drop: 1 μl β′MtbSI in 20 mM Tris-HCl, pH 8.0, 75 mM NaCl, 5 mM MgCl2 and 5 mM dithiothreitol plus 1 μl 100 mM sodium citrate tribasic dihydrate, pH 5.5, and 22% PEG1000; reservoir: 400 μl 100 mM sodium citrate tribasic dihydrate, pH 5.5, and 22% PEG1000; 22°C). Mtb RPo and β′MtbSI crystals were transferred to reservoir solution containing 18% (v/v) (2R,3R)-(−)-2,3-butanediol (Sigma-Aldrich, Inc.) and flash-cooled with liquid nitrogen. Analogous procedures were used for Mtb RPitc2, RPitc3, RPitc4, and complexes with Rif.
For Mtb RPo in complex with D-AAP1 or D-IX336, Mtb RPo crystals were soaked by adding 0.2 μl 20 mM D-AAP1 or D-IX336 in (2R,3R)-(−)-2, 3-butanediol directly into the drop for 2 h, transferring to reservoir solution containing 18% (v/v) (2R,3R)-(−)-2,3-butanediol, and flash-cooling with liquid nitrogen. For Mtb RPo in complex with both Rif and D-AAP1, pre-formed crystals of Mtb RPo-Rif were soaked by adding 0.2 μl 20 mM of D-AAP1 in (2R,3R)-(−)-2,3-butanediol directly into the drop for 2 h, transferring to reservoir solution containing 18% (v/v) (2R,3R)-(−)-2,3-butanediol, and flash-cooling with liquid nitrogen.
Structure determination: data collection and reduction
Diffraction data and selenium single-wavelength anomalous dispersion data were collected from cryo-cooled crystals at Argonne National Laboratory beamline 19ID-D. Data were processed using HKL2000 (Otwinowski et al., 1997). The resolution cut-off criteria were I/σ > 1.3 and Rmerge < 1.
Structure determination: structure solution and refinement
The structure of Mtb RPo was solved by molecular replacement with Molrep (Collaborative Computational Project, 1994) using the structure of T. thermophilus RPo (PDB 4G7H; Zhang et al., 2012) as the search model. One RNAP molecule was present in the asymmetric unit. Early-stage refinement included rigid-body refinement of RNAP, followed by rigid-body refinement of RNAP subunits, followed by rigid-body refinement of 44 RNAP domains (methods as in Zhang et al., 2012). Electron density for nucleic acids was unambiguous, but was not included in models in early-stage refinement. Cycles of iterative model building with Coot (Emsley et al., 2010) and refinement with Phenix (Adams et al., 2010) were performed. Improvement of the coordinate model resulted in improvement of phasing, and electron density maps for nucleic acids, which were not included in models at this stage of model building and refinement, improved over successive cycles. Nucleic acids then were built into the model and refined in stepwise fashion. The final model was generated by XYZ-coordinate refinement with secondary-structure restraints, followed by group B-factor and individual B-factor refinement. The final model, refined to Rwork and Rfree of 0.22 and 0.27, respectively, was deposited in the PDB with accession code 5UHA (Table 1). Analogous procedures were used to solve and refine structures of Mtb RPitc2, RPitc3, and RPitc4 (Table 1). Analogous procedures were used to solve and preliminarily refine structures of complexes with inhibitors; models of inhibitors then were built into mFo-DFc difference maps, and additional cycles of refinement and model building were performed, (Tables 1).
The structure of β′MtbSI was solved by the single-wavelength anomalous dispersion method, using Autosol as implemented in Phenix (Adams et al., 2010). The structure model was built using the program Coot (Emsley et al., 2010), and structure refinement was carried out using Phenix (Adams et al., 2010). The final model was refined to 2.2 Å resolution (Table 1).
QUANTITATION AND STATISTCAL ANALYSIS
Data for RNAP-DNA-interaction assays are means and SEMs for at least three replicates. Data for RNAP-inhibitory activities, growth-inhibitory activities, resistance, and cross-resistance are means of at least two determinations. Data for checkerboard interaction assays and resistance-rate assays are means and 95% confidence intervals for at least five and at least four replicates, respectively.
Supplementary Material
Acknowledgments
This work was supported by National Institutes of Health grants GM041376 and AI109713-8681 and Global Alliance for TB Drug Development contracts to R.H. Ebright. We thank the Argonne National Laboratory for beamline access; S. Rodrigue, J. Mukhopadhyay, and C. Sassetti for plasmids; and S. Diamond, E. Lucumi, G. Waters, Z. Ma, K. Taneko, C. Cooper, K. Mdluli, and N. Fotouhi for discussion. Soma Mandal, Y. Ebright, S. Li, and R.H. Ebright have patent filings on AAPs.
Footnotes
Publisher's Disclaimer: This is a PDF file of an unedited manuscript that has been accepted for publication. As a service to our customers we are providing this early version of the manuscript. The manuscript will undergo copyediting, typesetting, and review of the resulting proof before it is published in its final form. Please note that during the production process errors may be discovered which could affect the content, and all legal disclaimers that apply to the journal pertain.
Other authors have no conflicts.
AUTHOR CONTRIBUTIONS
Sukhendu Mandal, Y. Jiang, and S. Liu developed co-expression systems and purification procedures for preparation of Mtb RNAP. W. Lin, Y. Liu, and Y. Zhang purified Mtb RNAP, crystallized Mtb RNAP, and determined structures. W. Lin, Y. Feng, K. Das, and E. Arnold refined structures. Soma Mandal, D. Degen, M. Gigliotti, M. Talaue, and N. Connell performed biochemical and microbiological assays. R.H. Ebright designed studies, analyzed data, and wrote manuscript.
References
- Adams P, Afonine P, Bunkóczi G, Chen V, Davis I, Echols N, Headd J, Hung L, Kapral G, Grosse-Kunstleve R, McCoy A, Moriarty N, Oeffner R, Read R, Richardson D, Richardson J, Terwilliger T, Zwart P. PHENIX: a comprehensive Python-based system for macromolecular structure solution. Acta Cryst, D. 2010;66:213. doi: 10.1107/S0907444909052925. [DOI] [PMC free article] [PubMed] [Google Scholar]
- Aristoff P, Garcia GA, Kirchoff P, Showalter H. Rifamycins–obstacles and opportunities. Tuberculosis. 2010;90:94–118. doi: 10.1016/j.tube.2010.02.001. [DOI] [PubMed] [Google Scholar]
- Artsimovitch I, Chu C, Lynch A, Landick R. A new class of bacterial RNA polymerase inhibitor affects nucleotide addition. Science. 2003;302:650–654. doi: 10.1126/science.1087526. [DOI] [PubMed] [Google Scholar]
- Artsimovitch I, Vassylyeva M, Svetlov D, Svetlov V, Perederina A, Igarashi N, Matsugaki N, Wakatsuki S, Tahirov T, Vassylyev D. Allosteric modulation of the RNA polymerase catalytic reaction is an essential component of transcription control by rifamycins. Cell. 2005;122:351–363. doi: 10.1016/j.cell.2005.07.014. [DOI] [PubMed] [Google Scholar]
- Bae B, Davis E, Brown D, Campbell E, Wigneshweraraj S, Darst SA. Phage T7 Gp2 inhibition of Escherichia coli RNA polymerase involves misappropriation of σ70 domain 1.1. Proc Natl Acad Sci USA. 2013;110:19772–19777. doi: 10.1073/pnas.1314576110. [DOI] [PMC free article] [PubMed] [Google Scholar]
- Bae B, Nayak D, Ray A, Mustaev A, Landick R, Darst S. CBR antimicrobials inhibit RNA polymerase via at least two bridge-helix cap-mediated effects on nucleotide addition. Proc Natl Acad Sci USA. 2015;112:E4178–E4187. doi: 10.1073/pnas.1502368112. [DOI] [PMC free article] [PubMed] [Google Scholar]
- Banerjee R, Rudra P, Prajapati R, Sengupta S, Mukhopadhyay J. Optimization of recombinant Mycobacterium tuberculosis RNA polymerase expression and purification. Tuberculosis. 2014;94:397–404. doi: 10.1016/j.tube.2014.03.008. [DOI] [PubMed] [Google Scholar]
- Campbell E, Korzheva N, Mustaev A, Murakami K, Nair S, Goldfarb A, Darst S. Structural mechanism for rifampicin inhibition of bacterial RNA polymerase. Cell. 2001;104:901–912. doi: 10.1016/s0092-8674(01)00286-0. [DOI] [PubMed] [Google Scholar]
- Clinical and Laboratory Standards Institute (CLSI/NCCLS) CLIS Document M07-A8. Wayne, PA: CLSI/NCCLS; 2009. Methods for Dilution Antimicrobial Susceptibility Tests for Bacteria that Grow Aerobically; Approved Standard, Eighth Edition. [Google Scholar]
- Collaborative Computational Project Number. The CCP4 suite: programs for protein crystallography. Acta Cryst. 1994;4D54:760–763. doi: 10.1107/S0907444994003112. [DOI] [PubMed] [Google Scholar]
- Collins L, Franzblau S. Microplate Alamar Blue assay versus BACTEC 460 system for high-throughput screening of compounds against Mycobacterium tuberculosis and Mycobacterium avium, Antimicrob. Agents Chemother. 1997;41:1004–1009. doi: 10.1128/aac.41.5.1004. [DOI] [PMC free article] [PubMed] [Google Scholar]
- Davis E, Chen J, Leon K, Darst S, Campbell E. Mycobacterial RNA polymerase forms unstable open promoter complexes that are stabilized by CarD. Nucl Acids Res. 2015;43:433–45. doi: 10.1093/nar/gku1231. [DOI] [PMC free article] [PubMed] [Google Scholar]
- Degen D, Feng Y, Zhang Y, Ebright K, Ebright Y, Gigliotti M, Vahedian-Movahed H, Mandal S, Talaue M, Connell N, Arnold E, Fenical W, Ebright RH. Transcription inhibition by the depsipeptide antibiotic salinamide A. eLife. 2014;3:e02451. doi: 10.7554/eLife.02451. [DOI] [PMC free article] [PubMed] [Google Scholar]
- Emsley P, Lohkamp B, Scott WG, Cowtan K. Features and development of Coot. Acta Cryst, D. 2010;66:486. doi: 10.1107/S0907444910007493. [DOI] [PMC free article] [PubMed] [Google Scholar]
- Feklistov A, Mekler V, Jiang Q, Westblade L, Irschik H, Jansen R, Mustaev A, Darst S, Ebright RH. Rifamycins do not function by allosteric modulation of binding of Mg2+ to the RNA polymerase active center, Proc. Natl Acad Sci USA. 2008;105:14820–14825. doi: 10.1073/pnas.0802822105. [DOI] [PMC free article] [PubMed] [Google Scholar]
- Feng Y, Degen D, Wang X, Gigliotti M, Liu S, Zhang Y, Das D, Michalchuk T, Ebright Y, Talaue M, Connell N, Ebright RH. Structural basis of transcription inhibition by CBR hydroxamidines and CBR pyrazoles. Structure. 2015;23:1470–1481. doi: 10.1016/j.str.2015.06.009. [DOI] [PMC free article] [PubMed] [Google Scholar]
- Hall B, Ma C, Liang P, Singh K. Fluctuation Analysis CalculatOR: a web tool for the determination of mutation rate using Luria-Delbrück fluctuation analysis. Bioinformatics. 2009;25:1564–1565. doi: 10.1093/bioinformatics/btp253. [DOI] [PMC free article] [PubMed] [Google Scholar]
- Hein P, Landick R. The bridge helix coordinates movements of modules in RNA polymerase. BMC Biol. 2010;8:141. doi: 10.1186/1741-7007-8-141. [DOI] [PMC free article] [PubMed] [Google Scholar]
- Heyduk T, Ma Y, Tang H, Ebright RH. Fluorescence anisotropy: rapid, quantitative assay for protein-DNA and protein-protein interaction. Meths Enzymol. 1996;274:492–502. doi: 10.1016/s0076-6879(96)74039-9. [DOI] [PubMed] [Google Scholar]
- Horrevorts A, Michel M, Kerrebijn K. Antibiotic interaction: interpretation of fractional inhibitory and fractional bactericidal concentration indices. Eur J Clin Microbiol. 1987;6:502–503. doi: 10.1007/BF02013128. [DOI] [PubMed] [Google Scholar]
- Hubin E, Fay A, Xu C, Bean J, Saecker R, Glickman M, Darst S, Campbell E. Structure and function of the mycobacterial transcription initiation complex with the essential regulator RbpA. eLife. 2017;6:e22520. doi: 10.7554/eLife.22520. [DOI] [PMC free article] [PubMed] [Google Scholar]
- Jacques J, Rodrigue S, Brzezinski R, Gaudreau L. A recombinant Mycobacterium tuberculosis in vitro transcription system, FEMS Microbiol. Lett. 2006;255:140–147. doi: 10.1111/j.1574-6968.2005.00071.x. [DOI] [PubMed] [Google Scholar]
- Jokerst R, Weeks J, Zehring W, Greenleaf A. Analysis of the gene encoding the largest subunit of RNA polymerase II in Drosophila. Mol Gen Genet. 1989;215:266–275. doi: 10.1007/BF00339727. [DOI] [PubMed] [Google Scholar]
- Lane W, Darst S. Molecular evolution of multisubunit RNA polymerases: sequence analysis. J Mol Biol. 2010;395:671–685. doi: 10.1016/j.jmb.2009.10.062. [DOI] [PMC free article] [PubMed] [Google Scholar]
- Lee J, Borukhov S. Bacterial RNA polymerase-DNA interaction–the driving force of gene expression and the target for drug action. Front Mol Biosci. 2016;3:73. doi: 10.3389/fmolb.2016.00073. [DOI] [PMC free article] [PubMed] [Google Scholar]
- Ma W, Sandri G, Sarkar S. Analysis of the Luria-Delbrück distribution using discrete convolution powers. J Appl Probab. 1992;29:255–267. [Google Scholar]
- Mekler V, Kortkhonjia E, Mukhopadhyay J, Knight J, Revyakin A, Kapanidis A, Niu W, Ebright Y, Levy R, Ebright RH. Structural organization of bacterial RNA polymerase holoenzyme and the RNA polymerase-promoter open complex. Cell. 2002;108:599–614. doi: 10.1016/s0092-8674(02)00667-0. [DOI] [PubMed] [Google Scholar]
- Meletiadis J, Pournaras S, Roilides E, Walsh TJ. Defining fractional inhibitory concentration index cutoffs for additive interactions based on self-drug additive combinations, Monte Carlo simulation analysis, and in vitro-in vivo correlation data for antifungal drug combinations against Aspergillus fumigatus, Antimicrob. Agents Chemother. 2010;54:602–609. doi: 10.1128/AAC.00999-09. [DOI] [PMC free article] [PubMed] [Google Scholar]
- Molodtsov V, Nawarathne I, Scharf N, Kirchhoff P, Showalter H, Garcia G, Murakami K. X-ray crystal structures of the Escherichia coli RNA polymerase in complex with benzoxazinorifamycins. J Med Chem. 2013;56:4758–4763. doi: 10.1021/jm4004889. [DOI] [PMC free article] [PubMed] [Google Scholar]
- Murakami K. Structural biology of bacterial RNA polymerase. Biomolecules. 2015;5:848–864. doi: 10.3390/biom5020848. [DOI] [PMC free article] [PubMed] [Google Scholar]
- Murphy K, Papavinasasundaram K, Sassetti C. Mycobacterial recombineering. Meths Mol Biol. 2015;1285:177–199. doi: 10.1007/978-1-4939-2450-9_10. [DOI] [PubMed] [Google Scholar]
- Mustaev A, Zaychikov E, Severinov K, Kashlev M, Polyakov A, Nikiforov V, Goldfarb A. Topology of the RNA polymerase active center probed by chimeric rifampicin-nucleotide compounds. Proc Natl Acad Sci USA. 1994;91:12036–12040. doi: 10.1073/pnas.91.25.12036. [DOI] [PMC free article] [PubMed] [Google Scholar]
- Otwinowski Z, Minor W. Processing of X-ray diffraction data collected in oscillation mode. Meths Enzymol. 1997;276:307–326. doi: 10.1016/S0076-6879(97)76066-X. [DOI] [PubMed] [Google Scholar]
- Rothstein D. Rifamycins, alone and in combination. Cold Spring Harb Perspect Med. 2016;6 doi: 10.1101/cshperspect.a027011. [DOI] [PMC free article] [PubMed] [Google Scholar]
- Sarkar S, Ma W, Sandri G. On fluctuation analysis: a new, simple and efficient method for computing the expected number of mutants. Genetica. 1992;85:173–179. doi: 10.1007/BF00120324. [DOI] [PubMed] [Google Scholar]
- Srivastava A, Talaue M, Liu S, Degen D, Ebright RY, Sineva E, Chakraborty A, Druzhinin S, Chatterjee S, Mukhopadhyay J, Ebright Y, Zozula A, Shen J, Sengupta S, Niedfeldt R, Xin C, Kaneko T, Irschik H, Jansen R, Donadio S, Connell N, Ebright RH. New target for inhibition of bacterial RNA polymerase: “switch region”. Curr Opin Microbiol. 2011;14:532–543. doi: 10.1016/j.mib.2011.07.030. [DOI] [PMC free article] [PubMed] [Google Scholar]
- Srivastava A, Degen D, Ebright Y, Ebright RH. Frequency, spectrum, and nonzero fitness costs of resistance to myxopyronin in Staphylococcus aureus. Antimicrob Agents Chemother. 2012;56:6250–6255. doi: 10.1128/AAC.01060-12. [DOI] [PMC free article] [PubMed] [Google Scholar]
- Stewart F, Gordon D, Levin B. Fluctuation analysis: The probability distribution of the number of mutants under different conditions. Genetics. 1990;124:175–185. doi: 10.1093/genetics/124.1.175. [DOI] [PMC free article] [PubMed] [Google Scholar]
- Stols L, Millard C, Dementieva I, Donnelly M. Production of selenomethionine-labeled proteins in two-liter plastic bottles for structure determination. J Struct Funct Genomics. 2004;5:95–102. doi: 10.1023/B:JSFG.0000029196.87615.6e. [DOI] [PubMed] [Google Scholar]
- Sweetser D, Nonet M, Young R. Prokaryotic and eukaryotic RNA polymerases have homologous core subunits. Proc Natl Acad Sci USA. 1987;84:1192–1196. doi: 10.1073/pnas.84.5.1192. [DOI] [PMC free article] [PubMed] [Google Scholar]
- Vuthoori S, Bowers C, McCracken A, Dombroski A, Hinton D. Domain 1.1 of the sigma(70) subunit of Escherichia coli RNA polymerase modulates the formation of stable polymerase/promoter complexes. J Mol Biol. 2001;309:561–572. doi: 10.1006/jmbi.2001.4690. [DOI] [PubMed] [Google Scholar]
- Weinzierl R. The nucleotide addition cycle of RNA polymerase is controlled by two molecular hinges in the Bridge Helix domain. BMC Biol. 2010;8:134. doi: 10.1186/1741-7007-8-134. [DOI] [PMC free article] [PubMed] [Google Scholar]
- White R, Burgess D, Manduru M, Bosso J. Comparison of three different in vitro methods of detecting synergy: time-kill, checkerboard, and E test. Antimicrob Agents Chemother. 1996;40:1914–1918. doi: 10.1128/aac.40.8.1914. [DOI] [PMC free article] [PubMed] [Google Scholar]
- World Health Organization. Global Tuberculosis Report 2016 (Geneva) 2016 [Google Scholar]
- Zhang Y, Degen D, Ho M, Sineva E, Ebright K, Ebright Y, Mekler V, Vahedian-Movahed H, Feng Y, Yin R, Tuske S, Irschik H, Jansen R, Maffioli S, Donadio S, Arnold E, Ebright RH. GE23077 binds to the RNA polymerase ‘I’ and ‘i+1’ sites and prevents the binding of initiating nucleotides. eLife. 2014;3:e02450. doi: 10.7554/eLife.02450. [DOI] [PMC free article] [PubMed] [Google Scholar]
- Zhang Y, Feng Y, Chatterjee S, Tuske S, Ho M, Arnold E, Ebright RH. Structural basis of transcription initiation. Science. 2012;338:1076–1080. doi: 10.1126/science.1227786. [DOI] [PMC free article] [PubMed] [Google Scholar]
Associated Data
This section collects any data citations, data availability statements, or supplementary materials included in this article.