Abstract
Stromatolitic iron-rich structures have been reported from many ancient environments and are often described as Frutexites, a cryptic microfossil. Although microbial formation of such structures is likely, a clear relation to a microbial precursor is lacking so far. Here we report recent iron oxidizing biofilms which resemble the ancient Frutexites structures. The living Frutexites-like biofilms were sampled at 160 m depth in the Äspö Hard Rock Laboratory in Sweden. Investigations using microscopy, 454 pyrosequencing, FISH, Raman spectroscopy, biomarker and trace element analysis allowed a detailed view of the structural components of the mineralized biofilm. The most abundant bacterial groups were involved in nitrogen and iron cycling. Furthermore, Archaea are widely distributed in the Frutexites-like biofilm, even though their functional role remains unclear. Biomarker analysis revealed abundant sterols in the biofilm most likely from algal and fungal origins. Our results indicate that the Frutexites-like biofilm was built up by a complex microbial community. The functional role of each community member in the formation of the dendritic structures, as well as their potential relation to fossil Frutexites remains under investigation.
Introduction
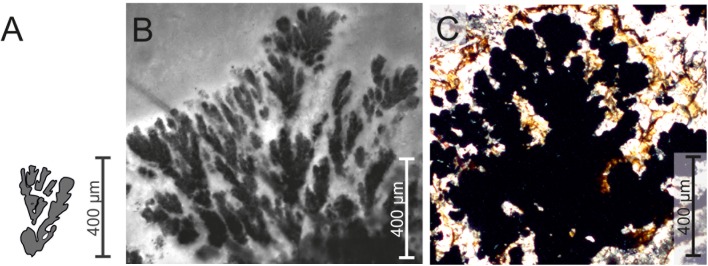
Laminations and dendrites are common morphological features that allow us to correlate to Precambrian stromatolites to recent analogues formed by calcifying mineralizing microbes [e.g. 1, 2, 3, 4, 5, 6]. Other biomorphs observed in the geological record show similar characteristic shapes, but their formation processes are currently unclear. In numerous paleo-environmental studies, Fe-and Mn-rich stromatolitic and dendritic structures have often been described as Frutexites. In the fossil record, Frutexites occur in rock samples from different environments such as marine stromatolites, microbial limestones, hardgrounds, cavities, cracks, veins, and Neptunian dikes [e.g. 7, 8, 9, 10, 11, 12, 13, 14, 15, 16]. Major occurrences are described from rock cavities and fractures, mainly growing upward, but also radially to the nucleating surface [17].The genus Frutexites with five different species was first described by Maslow [18]. The identification and description of the fossil Frutexites in the literature is always based on the following character: dendritic structures mainly composed of iron and/or manganese oxides; several tens to hundreds of micrometres in height (Fig 1A; see [14] for an overview). However, clear evidence for the microbial biomineralization of Frutexites structures is lacking to date. With a recent analogue it should be possible to determine if and how microorganisms contribute to the formation of Frutexites.
Fig 1.
Comparison of the dendritic Frutexites structures modified after Maslov (18; A); recent forms from the Äspö HRL described in this paper (B) and fossil Frutexites from mineralized fractures of the “sole dolomite” at the base of the Naukluft Nappe Complex in southern Namibia [14].
Dendritic structures were observed in living iron oxide precipitating biofilms growing on rock surfaces in the Äspö Hard Rock Laboratory (HRL). The dendrites of the iron oxide biofilm strongly resemble the dendritic pattern of fossil Frutexites structures (Fig 1). In this study, we present a detailed, high resolution visualization of the morphological structures in the Frutexites-like biofilm. Furthermore, we aimed to identify the microbial community in the biofilm and their potential contribution to the dendrite formation. Biomarker and trace element analysis complement the data set and offer a link for biosignature investigations in fossil Frutexites.
Material & methods
Sampling site
Samples for this study were taken from site NASA 1127B in the Äspö Hard Rock Laboratory (HRL) north of Oskarshamn, Sweden. The Äspö HRL is a tunnel excavated beneath the island of Äspö and is operated by SKB (Svensk Kärnbränsle Hantering AB which is the Swedish Nuclear Fuel and Waste Management Company) as a testing site for the long-term deposition of high-level radioactive nuclear waste. Access to the sampling site within the Äspö HRL was provided by SKB. The host rock of the Äspö HRL mainly consists of 1.8-Ga-old granitic to quartz-monzodioritic rocks belonging to the Precambrian Transscandinavian Igneous Belt [19].
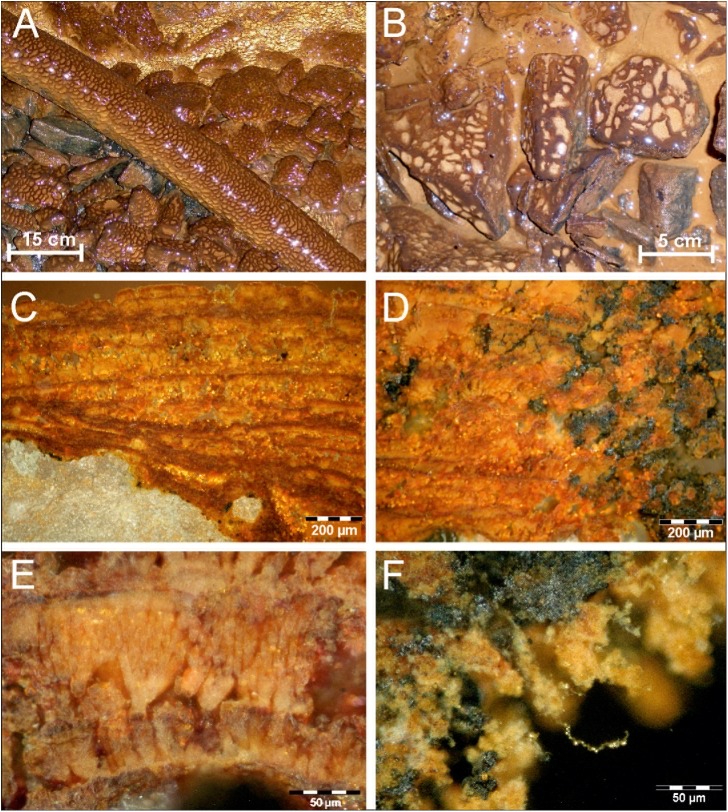
The Frutexites-like biofilms form wherever iron-rich brackish water is dripping from the ceiling or trickling down the tunnel walls (Fig 2A and 2B). Most intense growth of the biofilms is observed at depths around 150 to 180 m below the surface. In this section of the tunnel, the groundwater originates from a brackish aquifer, which is influenced by Baltic Sea water [20, 21, 22].
Fig 2.
Iron oxidizing biofilms cover rocks and artificial tubes at sites NASA 1265A (A) and NASA 1127B (B) in the Äspö Hard Rock Laboratory at ca. 160 m depth. Cross sections of these Frutexites-like biofilms show an alternating dendritic and laminar growth, with varying contents of brown-red or blackish mineral phases (C; D). Enlarged dendritic mineralized structures within the laminae (E) and at the rim (F) of the biofilm.
Histological methods
For TEM (transmission electron microscopy) and DOPE-FISH (double labeling of oligonucleotide probes for fluorescence in situ hybridization), samples were embedded in Technovit 7100 (GAM Kit: glycol methacrylate monomer, hardner I & II, Thermo Fisher Scientific, Braunschweig, Germany) as described in [23], serially sectioned into 2–3 μm thick slices by a rotary microtome and stored at 4°C until further processing. DOPE-FISH analyses on histological thin sections provide evidence of the distribution of prokaryotic cells close to the surface of the biofilm.
For FE-SEM (field emission scanning electron microscopy), samples were fixed in 2% glutaraldehyde immediately after sampling and stored at 4°C until analysis. Prior to measurement, the samples were dehydrated in ethanol dehydration series (concentration 15% to 99%). Final dehydration was performed by critical point drying (EM CPD030, Leica Microsystems, Heerbrugg, Switzerland) as well as chemically drying via HMDS (hexamethyldisilazane). Sample proportions were mounted on SEM sample holders and sputtered with Au-Pb (7.3 nm for 120 s). Samples were analysed using a field emission SEM (FE-SEM; LEO 1530 Gemini) combined with an INCA X-act EDX (Oxford Instruments).
For different microscopic investigations, samples were embedded in LR-White (for the preparation of hard part sections). For TEM the samples were embedded in methylacrylate and cut with an ultramicrotome using glass and diamond knives to gain 3 μm ultrathin sections. Technovit 7100 embedding was performed for cutting hard part thin sections stained with Alcian blue (0298-50G; VWR) to visualize acidic polysaccharides of membranes and extracellular polymeric substances (EPS).
454 pyrosequencing
DNA was extracted from 2 samples as described in [24]. The samples were sequenced using 454 pyrosequencing for bacterial diversity using the 28F and 519R primers [25]. Pyrosequencing was done by MrDNA laboratories (Shallowater, TX, USA) using a Roche 454 GS Titanium FLXC Genome Sequencer system. Briefly, Tag-encoded FLX amplicon pyrosequencing (bTEFAP) was carried out as previously described [26]. A 20 ng (1 ml) aliquot of each DNA sample was used for a 25 ml PCR reaction. A 30 cycle PCR using HotStarTaq Plus Master Mix Kit (Qiagen, USA) were used under the following conditions: 94°C for 3 min, followed by 30 cycles of 94°C for 30 sec; 55°C for 40 sec and 72°C for 1 min; and a final elongation step at 72°C for 5 min. Following PCR, all amplicon products from different samples were mixed in equal volumes and purified using Agencourt Ampure beads (Agencourt Bioscience Corporation, USA). A total of 17,598 sequences were obtained (in duplicate samples) and were processed as described in [27] using the SILVA NGS pipeline (https://www.arb-silva.de/ngs/). Briefly, the sequences were checked for quality (length, homopolymers and ambiguous bases) and aligned against the SILVA ref database [28]. Sequences with no alignment were removed while the rest were dereplicated and clustered (per sample) into operational taxonomic units (OTUs) using the CD-HIT EST software [29] at a similarity value of 100% and 98%, respectively. Reference sequences of each OTU ware assigned a taxonomic value using BLAST against the SILVA ref database (Version 111; [28]). Full OTU mapping of the sample was done by clustering the reference sequences of each OTU at 99% similarity.
The sequences were deposited at the Sequences Read Archive (SRA) under study accession number PRJEB4914 (http://www.ebi.ac.uk/ena/data/view/PRJEB4914).
Biomarker analysis
The lyophilized biofilm (500 mg) was extracted with 20 mL of pre-distilled dichloromethane in Teflon-capped glass bottles (ultrasonication, 35 min, 40°C). The supernatant was decanted after centrifuging. Extraction was repeated three times. After evaporation of the combined extracts and re-dissolution in pure dichloromethane, the solvents were dried with N2. The total organic extract (TOE) was re-dissolved with n-hexane. An aliquot (25%) of the TOC was derivatized by adding 100 μL BSTFA/pyridine (40°C, 1.5 h). The collected supernatant was dried with N2, and then mobilized with 300μl n-hexane with deuterated eicosane (C20D42; 4 mg/l) as internal standard. 1 μL of the sample extract was analysed via on-column injection into a Varian CP-3800 GC/1200-quadrupole MS (70keV) equipped with a fused silica column (Phenomenex ZB-5; 30 m length, 0.32 μm inner diameter.; 0.25 μm film thickness). The GC oven was programmed from 80°C (held 3 min) to 325°C (held 40 min) at 6°C/min. He was used as carrier gas at 1.4 ml/min. Compounds were assigned by comparison with published mass spectral data.
ICP-OES and ICP-MS analysis
Major cations and rare earth elements (REE-Y) were analyzed in two Frutexites-like biofilms. 4 ml of H2O2 (Carl Roth; 35%) and 2 ml of concentrated, distilled HNO3 (Merck, triple distilled in the GZG geochemistry lab) were added to 500 mg of the lyophilized sample. The resulting solutions of the mineral precipitates were diluted in 50 ml of deionized water (final concentration 4% HNO3). These solutions, two aquifer samples, and a reference sample (matrix matched calibration solution) containing all chemicals used, were spiked with internal Ge, Rh, In and Re standards and analyzed by ICP-OES (optical emission spectroscopy; Perkin Elmer Optima 3300 DV) and ICP-MS (inductive coupled plasma—mass spectrometry; Perkin Elmer SCIEX Elan DRCII). The values are mean values of triplicate measurements. Furthermore, laser ablation-ICP-MS (LA-ICP-MS) was conducted on several different spots on cross sections of two different Frutexites-like biofilms to better detect chemical variations in iron oxides that cannot be observed in the bulk extract. For a potential comparison with ancient analogs REE-Y data from each sample (LA-ICP-MS 1–5; aquifer and the dissolved biofilm) are normalized to PAAS (Post-Archaean average Australian sedimentary rock; [30]).
Carbon-phase analyses and carbon, nitrogen and sulfur (CNS) measurements
Inorganic carbon (Cinorg) and organic carbon (Corg) were analyzed with a Leco RC 412 multiphase carbon analyzer. Carbon (Ctot), total nitrogen (Ntot) and sulfur (Stot) were analyzed using a CNS Elemental Analyzer (HEKAtech Euro EA). Duplicate measurements were performed routinely, and appropriate internal standards were used for the Cinorg (Leco 502–030), Corg (Leco 501–034), and CNS (2,5-Bis(5-tert-butyl-2-benzoxazolyl)thiophene, SA990752; atropine sulfate SA990753; IVA Analysentechnik) analyses.
Raman spectroscopy
Raman spectra were recorded using a confocal Horiba Jobin-Yvon LabRam-HR 800 UV Raman spectrometer with attached Olympus BX41 microscope and an argon ion laser (Melles Griot IMA 106020B0S; 488nm) with a laser power of 20 mW at the laser exit (ca. 3–4 mW at the sample). The focal length of the spectrometer of 800 mm and the use of a 600 l/mm grating and a CCD detector with 1024 x 256 pixels yielded a spectral dispersion of ≤2 cm-1 per pixel. Using an Olympus MPlane 100x objective with a numerical aperture of 0.9 and closing the confocal hole to 100 μm resulted in a lateral resolution of ca. 1 μm and a depth resolution of ca. 5 μm. The acquisition time varied between 10 and 30 s for a spectral range of 100–4000 cm-1. For calibration of the spectrometer a silicon standard with a major band at 520.4 cm-1 was used. All spectra were recorded and processed using LabSpecTM version 5.19.17 (Horiba Jobin-Yvon, Villeneuve d’Ascq, France). The minerals were identified on the basis of the Horiba Jobin-Yvon database for minerals and reference spectra collected from mineral specimens of the Geoscience Museum of the Georg-August University Göttingen.
Results
Structure of the mineralized biofilm
The mineralized biofilms have a brown color, and show a net-like distribution with dark brown ridges and bright depressions on rocks or other surfaces (Fig 2A and 2B). Cross-sections of biofilms show a distinctive stromatolitic character in the mm to cm range, consisting of red-brown laminae with internal dendritic structures (Fig 2C) and, in places, intertwined black mineral aggregates (Fig 2D). A higher resolution shows the dendritic columns (Fig 2E) and different mineral aggregates also attached to organic filaments (Fig 2F). Such filamentous or net-like structures are mainly composed of extracellular polymeric substances (EPS; see below). Field emission scanning electron microscopy (FE-SEM) reveals brighter areas of higher mineral density within the laminated structure in cross section of the biofilms (Fig 3A). Dendritic iron oxides seem to grow almost radially from a nucleating core (Fig 3B).
Fig 3.
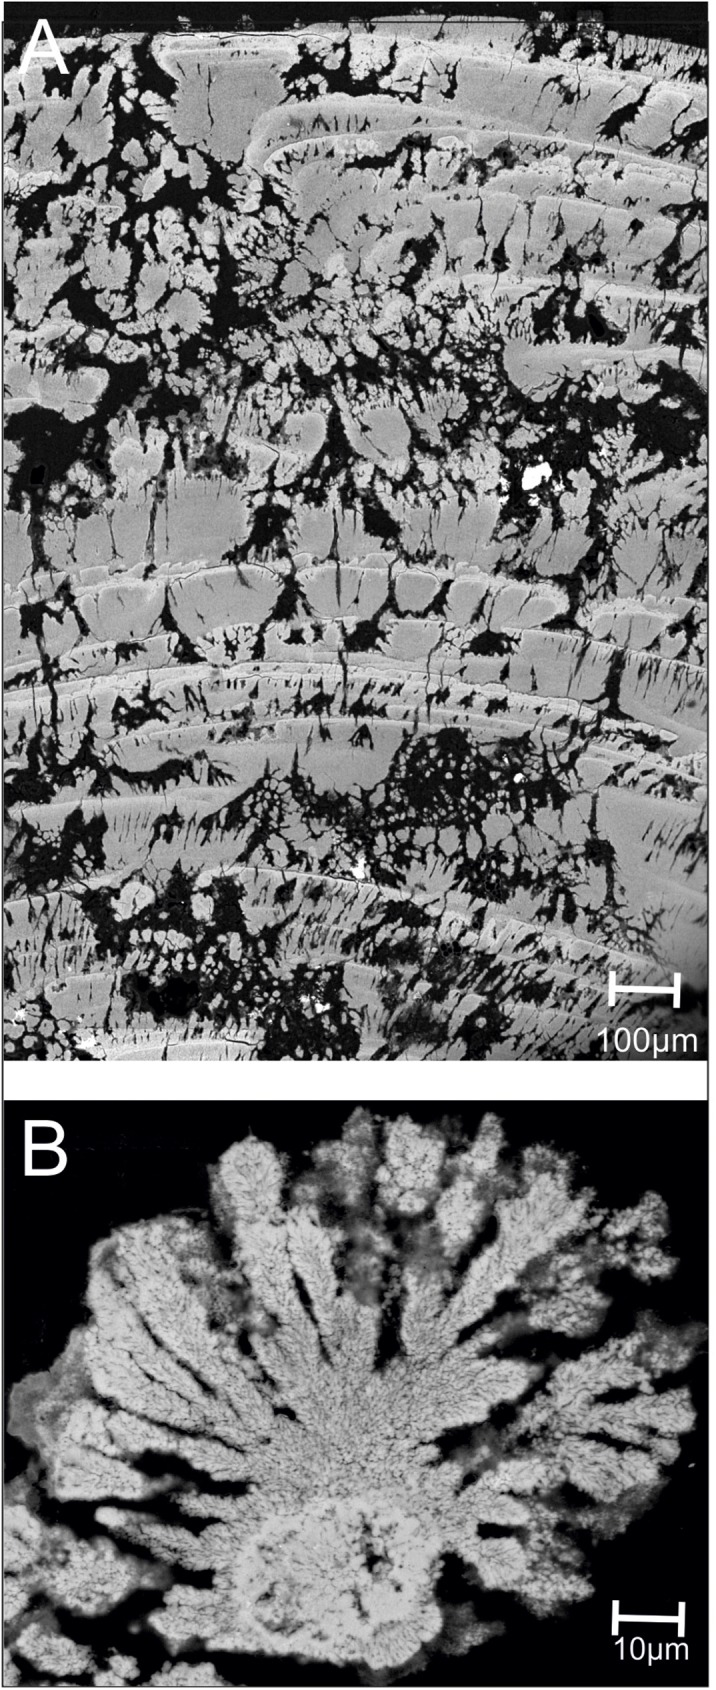
FE-SEM images showing cross sections of the iron oxidizing Frutexites-like biofilms (A; B). Brighter areas belong to dense mineral phases (A). Dendrites grow radially, mainly upwards from a nucleus.
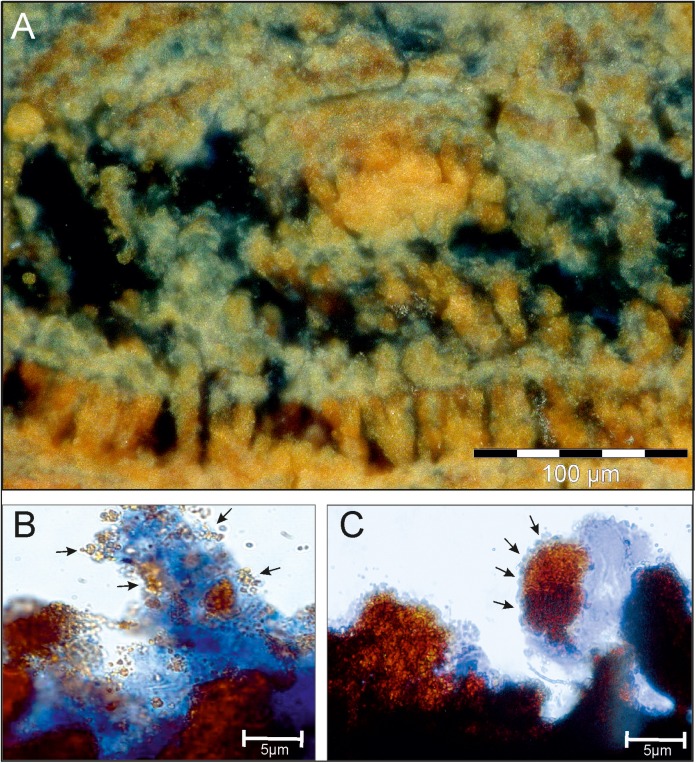
Microscopical investigations of Alcian blue stained sections show the EPS around and within the mineral aggregates (Fig 4A). Almost every dendrite is covered in, or appears to be composed of permineralized EPS. Close-up-views show mineral particles of different sizes entrapped and accumulated within the EPS matrix (Fig 4B and 4C arrows).
Fig 4. LR White embedded section stained with Alcian blue shows the EPS matrix in the mineralized biofilm.
The EPS is distributed on the surface as well as in greater depths of the biofilm, surrounding the iron oxide layers and tips of the dendrites (A). Within the blue stained EPS matrix, mineral particles are entrapped (B) and form larger mineral aggregates (C), building up the characteristic dendrites.
Microbial consortia and EPS structure
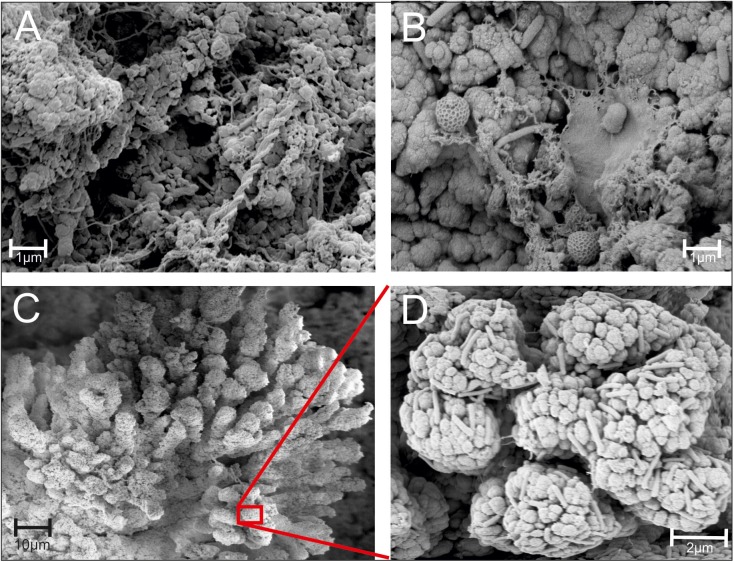
FEM investigations enable the visualization of the complex EPS fabrics and different cell morphologies within and on top of the mineral aggregates (Fig 5). Network-forming filaments, twisted stalks and agglomerates appear to be particularly abundant within cavities or depressions of the mineralized biofilm. A variety of morphologically distinct microbial structures were localized within the biofilm, including coccoid-, rod-shaped and filamentous microbes (Fig 5B). The mineralized dendrites are composed of roundish or seed like mineral grains and appear to be inhabited by abundant rod shaped microbes (Fig 5C and 5D).
Fig 5. FEM images of a Frutexites-like biofilm.
Various microbial EPS structures (A) and prokaryotic cells (B) are visible between the mineral precipitates. The dendrites (C) are covered with numerous rod-shaped microbial cells (D).
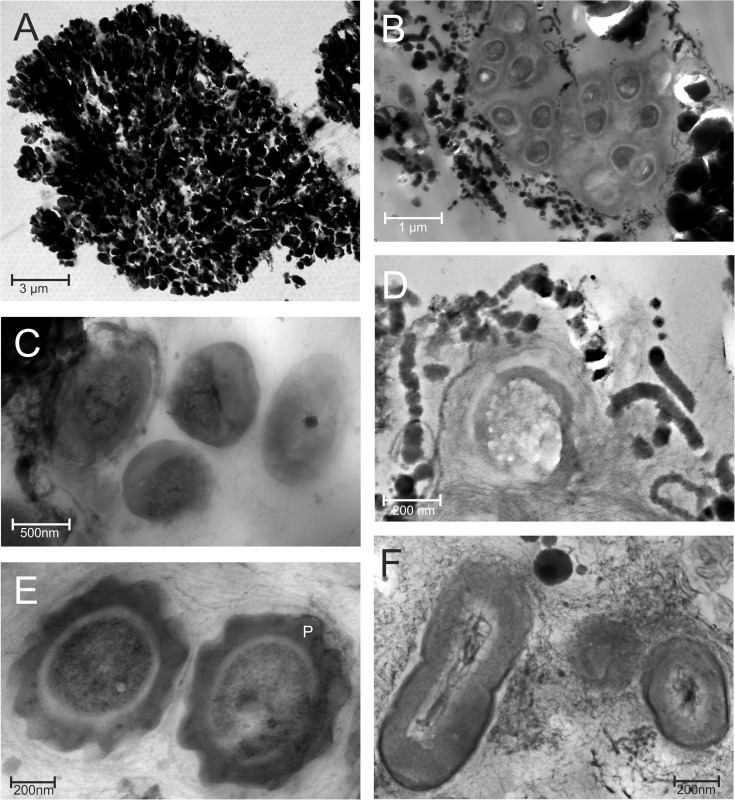
Ultrathin sections from the central area of a biofilm revealed that these dendrites are built up from up to 1 μm sized mineral particles (Fig 6A). Microbial cells occur in densely packed EPS aggregates, surrounded by mineral particles and in close vicinity to dendrites (Fig 6B). In some microbial cells small dark cubic mineral particles were detected (Fig 6C). The shape of these particles, their occurrence and accumulation within the prokaryotic cell are characteristic traits of magnetotactic bacteria. The presence of magnetotactic bacteria (Magnetospirillum magneticum) was confirmed by sequencing analysis (see below). Chain-like mineral aggregates were detected around some bacterial cells (Fig 6D).
Fig 6. TEM micrographs of microbes detected in the Frutexites-like biofilm.
The cross section of a dendritic structure shows a dense accumulation of mineral particles (A). In areas with less dense particles various microbial cells are observed (B-F). Most of the microbes are surrounded by a matrix composed of EPS and mineral particles, of either net-like (B, C, F) or laminated (D, E) structure. The dark, ca 50 nm wide square was interpreted as a magnetite produced within a magnetotactic bacterium (C). Nitrotoga cells were identified according to their characteristic shape and wide irregular periplasmic space (marked with P) (E). Dividing cells surrounded by a thick EPS matrix with a net like distribution of mineral particles (F).
Furthermore, Nitrotoga bacterial cells with their characteristic irregular periplasmic space [31] were identified in the EPS matrix (Fig 6E) as well as in the DNA sequences (see below). Nearly all prokaryotic cells in the biofilm appear to be embedded in thin foliated EPS layers (Fig 6C; 6D and 6F). Although abundant mineral precipitates in the EPS matrix surround the microbial cells, they do not appear to hamper microbial growth and cell division (Fig 6F).
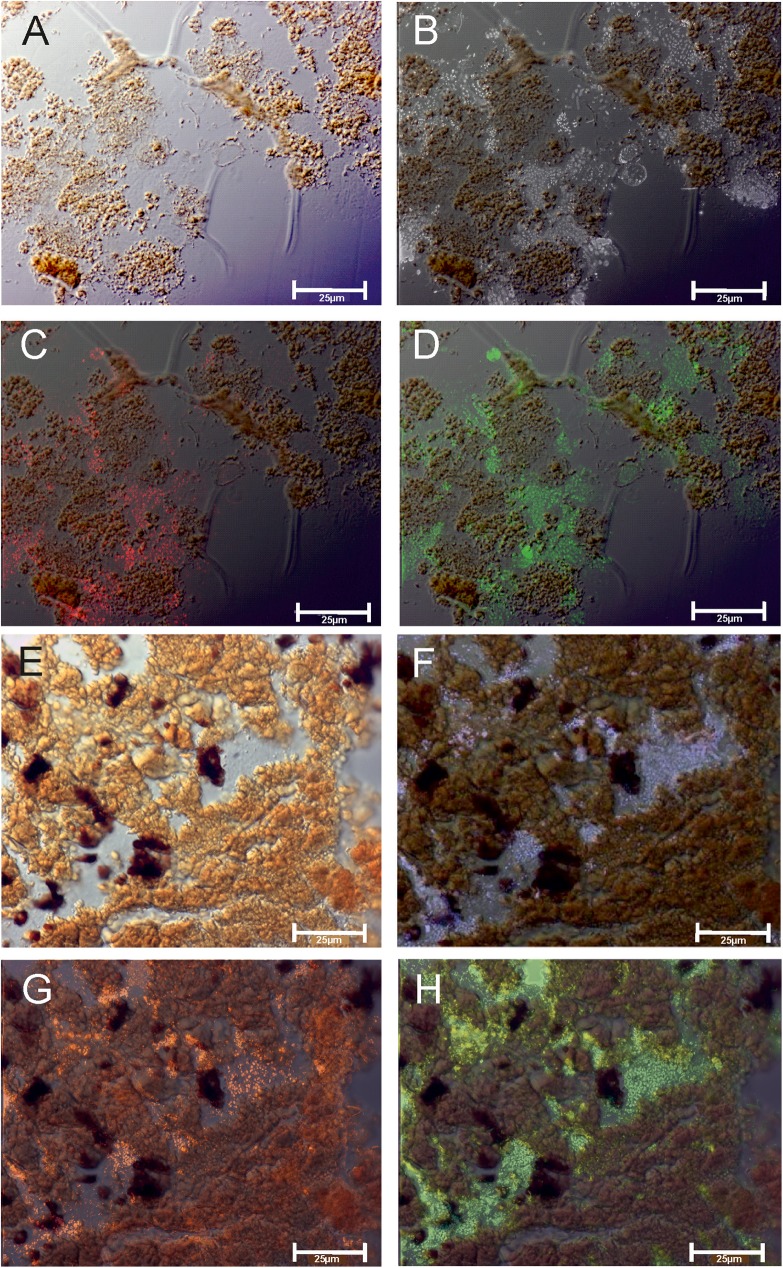
DOPE-FISH analyses revealed that bacteria are concentrated in distinct areas of the biofilm (Fig 7C and 7G red), whereas the Archaea are evenly abundant in the upper layers as well as in the deeper parts of the biofilm (Fig 7D and 7H; green).
Fig 7.
Transmitted light microscopy of an embedded Frutexites section at the top (A) and in the center of the biofilm (E). Epifluorescence microscopy on the DAPI stained section exhibits the distribution of prokaryotic cells (B, F). DOPE-FISH further distinguishes bacterial aggregates by probe EUB I-III-cy3 (C, G) and Archaea via probe Arch915-oregon green (D, H).
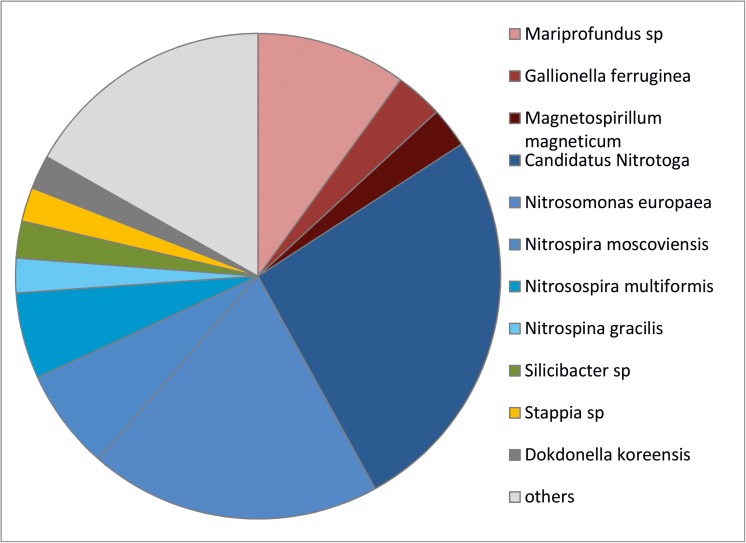
The bacterial community within the stromatolitic biofilm was elucidated by 454 pyro sequencing. Within the biofilm, almost 40% of the sequences determined were associated with bacteria involved in the nitrogen cycle (Fig 8). Ammonia- oxidizing bacteria (AOB) consisted of two different Nitrosomonas species, and nitrite oxidizing bacteria (NOB) comprised Candiatus Nitrotoga, Nitrospira, and Nitrospina. The second major group of organisms were iron oxidizing bacteria (FeOB), represented by Mariprofundus sp., and Gallionella ferruginea. The facultative anaerobic iron reducer Magnetospirillum magneticum, a magnetotactic bacterium is also present. This community composition indicates a close coupling between the iron and the nitrogen cycle.
Fig 8. Sequence-based bacterial diversity of the Frutexites-like biofilm.
The biofilm is dominated by nitrite and ammonia oxidizing bacteria (blue colors) and iron metabolizing bacteria (red colors). Both biofilms investigated show the same diversity pattern.
Lipid composition
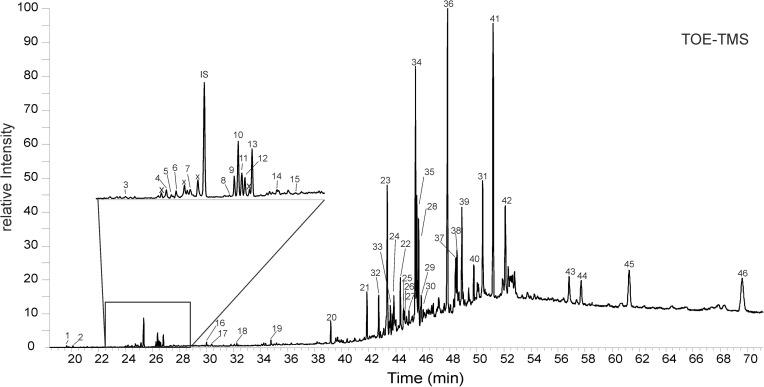
Compounds detected with GC/MS are shown in the chromatogram in Fig 9 and listed in Table 1. The total organic extract (TOE) of the Frutexites-like biofilm contains numerous organic compounds, mainly fatty acids (FA; 10%), sterols (21%) and hopanoids (69%). Fatty acids, range from C14 to C20, mainly with even carbon numbers. Among the FA C16 and C18 compounds are most abundant. Four different unsaturated C16:1 FA were observed and one C18:1 FA. The branched FAs, C15 iso (i) and anteiso (ai), C16i¸ 10methyl-C16 and C17i were detected. In the triterpenoid range, cholesterol (cholest-5-en-3β-ol), ergosta-5,22-dienol (24-methylcholesta-5,22-dien-3-β-ol), ergosta-5,7-dienol (24-methylcholesta-5,7-dien-3-β-ol), campesterol (24-methylcholest-5-en-3β-ol), sitosterol (24-ethylcholest-5-en-3β-ol) and sitostanol (24-ethylcholestan-3β-ol) were detected. Furthermore, partly functionalized hopanoids range from C30 to C35 were present, including diploptene (~9%), diplopterol (~11%), 17ß(H),21ß(H)-bishomohopanoic acid (~5%) 17ß(H),21ß(H)-bishomohopanone (~13%), 17ß(H),21ß(H)-bishomohopanol (C32-hopanol; ~5%), 17ß(H),21ß(H)-bacteriohopanetetrol (~6%). All compounds detected are given in Table 1.
Fig 9. GC-MS chromatogram of the derivatized total organic extract from the Frutexites-like biofilm.
The peak assignments are given in Table 1. Peaks labeled with “x” are non-derivatized fatty acids. IS = internal standard. See text for further details.
Table 1. Biomarkers detected in the total organic extract of the Frutexites-like biofilm from Äspö tunnel.
| Compound class | RT | Peak No. | MW | Formula | Compound | % |
|---|---|---|---|---|---|---|
| 19.62 | 1 | 168 | C16H30O | Hexadecenal | 0.05 | |
| 20.1 | 2 | Unknown compound | 0.06 | |||
| Fatty acids | 22.92 | 3 | 300 | C17H36O2Si | C14:0 TMS | 0.03 |
| 24.18 | 4 | 314 | C18H38O2Si | C15:0 i TMS | 0.09 | |
| 24.34 | 5 | 314 | C18H38O2Si | C15:0 ai TMS | 0.04 | |
| 24.47 | 6 | 312 | C18H36O2Si | C15:1 TMS | 0.10 | |
| 24.91 | 7 | 314 | C18H38O2Si | C15:0 TMS | 0.08 | |
| 26.09 | 8 | 328 | C19H40O2Si | C16:0 i TMS | 0.02 | |
| 26.25 | 9 | 326 | C19H38O2Si | C16:1 TMS | 0.15 | |
| 26.37 | 10 | 326 | C19H38O2Si | C16:1 TMS | 0.43 | |
| 26.48 | 11 | 326 | C19H38O2Si | C16:1 TMS | 0.19 | |
| 26.58 | 12 | 326 | C19H38O2Si | C16:1 TMS | 0.16 | |
| 26.8 | 13 | 328 | C19H40O2Si | C16:0 | 0.39 | |
| 27.61 | 14 | 342 | C20H42O2Si | 10MeC16:0 TMS | 0.07 | |
| 27.95 | 15 | 342 | C20H42O2Si | C17:0 i TMS | 0.04 | |
| 29.99 | 16 | 354 | C21H42O2Si | C18:1 TMS | 0.16 | |
| 30.36 | 17 | 356 | C21H44O2Si | C18:0 TMS | 0.08 | |
| 32.21 | 18 | 370 | C22H46O2Si | C19:0 TMS | 0.14 | |
| 34.71 | 19 | 384 | C23H48O2Si | C20:0 TMS | 0.21 | |
| 39.18 | 20 | 410 | Squalene | 0.86 | ||
| 41.85 | 21 | Unknown compound | 1.87 | |||
| 44.34 | 22 | Unknown compound | 1.99 | |||
| Sterols | 43.36 | 23 | 458 | C30H54OSi | Cholest-5-en-3β-ol TMS (cholesterol) | 5.59 |
| 43.86 | 24 | 470 | C31H54OSi | 24-Methylcholesta-5,22-dien-3-β-ol TMS (ergostan5,22-dienol) | 1.88 | |
| 44.57 | 25 | 470 | C31H54OSi | 24-Methylcholesta-5,7-dien-3-β-ol TMS (ergostan5,7-dienol) | 1.19 | |
| 44.65 | 26 | 472 | C33H54OSi | 24-Methylcholest-5-en-3β-ol TMS (campesterol) | 1.04 | |
| 44.98 | 27 | 484 | C32H56OSi | 24-Ethylcholest-5, 22-en-3β-ol TMS (sitostadienol) | 0.59 | |
| 45.69 | 28 | 486 | C32H58OSi | 24-Ethylcholest-5-en-3β-ol TMS (sitosterol) | 4.01 | |
| 45.83 | 29 | 488 | C32H60OSi | 24-Ethylcholestan-3β-ol TMS (sitostanol) | 0.61 | |
| 45.88 | 30 | 484 | C32H56OSi | 24-Ethylcholest-5-en-3β-ol TMS (sitosterol) | 1.29 | |
| 50.42 | 31 | 504 | Unknown steroid | 5.22 | ||
| Hopanoids | 42.73 | 32 | 410 | C30H50 | Hop17(21)-ene | 1.57 |
| 43.72 | 33 | 384 | C28H48 | 17β(H),18α(H),21β(H)-Bisnorhopane | 1.02 | |
| 45.44 | 34 | 410 | C30H50 | Hop22(29)-ene (Diploptene) | 9.34 | |
| 45.55 | 35 | 410 | C30H50 | Hop21(22)-ene | 4.35 | |
| 47.82 | 36 | 428 | C30H52O | Diplopterol | 11.35 | |
| 48.44 | 37 | Unknown hopanoid | 2.38 | |||
| 48.52 | 38 | Unknown compound | 2.12 | |||
| 48.89 | 39 | Unknown hopanoid | 3.57 | |||
| 49.77 | 40 | 440 | C32H56 | 17ß(H),21ß(H)-Bishomohopane | 1.89 | |
| 51.19 | 41 | 454 | C32H54O | 17ß(H),21ß(H)-Bishomohopanone | 13.25 | |
| 52.09 | 42 | 528 | C34H60O2Si | 17ß(H),21ß(H)-Homohopanoic acid-TMS | 5.14 | |
| 56.83 | 43 | Unknown hopanoid | 2.15 | |||
| 57.71 | 44 | Unknown hopanoid | 2.12 | |||
| 61.27 | 45 | 616 | C38H72O2Si2 | 17ß(H),21ß(H)-Bishomohopandienol TMS | 4.97 | |
| 69.65 | 46 | 834 | C47H94O4Si4 | 17ß(H),21ß(H)-Bacteriohopanetetrol TMS | 6.16 | |
| Sum | 100.00 |
Mineralogy and chemical composition
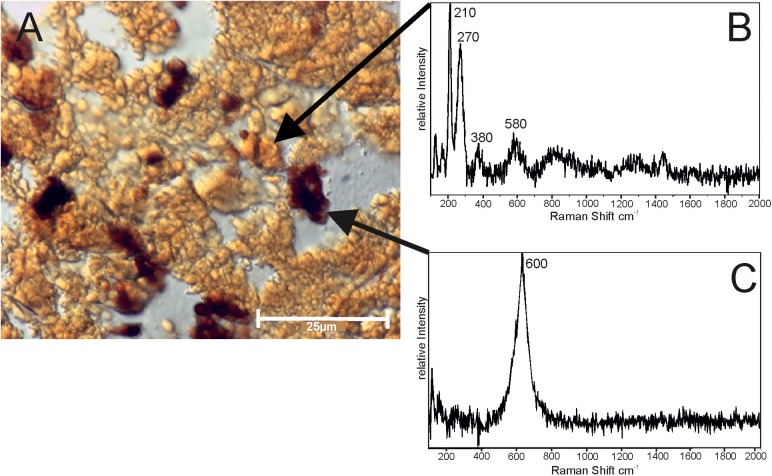
Preliminary microscopic investigations indicated that the Frutexites-like biofilm consists of iron hydroxides and iron oxides. X-ray diffraction measurements confirmed that most of mineral precipitates are 2-line ferrihydrite (data not shown). High resolution analyses with Raman spectroscopy clearly revealed two different mineral phases, a red-brown and a dark phase (Fig 10A). The former has main bands at 210 cm-1 and 270 cm-1, with several smaller bands at around 380 cm-1, 580 cm-1 and 1290 cm-1 (Fig 10B). The latter has a main band at 635 cm-1 with a shoulder at around 600 cm-1 (Fig 10C). In some cases additional smaller bands appear at 215 cm-1, 270 cm-1 and 350 cm-1. For both mineral phases additional bands in the higher wavenumber region occur that are assignable to C-C, C-H and O-H stretching vibrations.
Fig 10.
Raman spectra of two distinct areas, applied to a cross section of dendrites located in the central area of the Frutexites-like biofilm (A; see also 6E), exhibiting most likely hematite (B) within the red-brown, and magnetite (C) within dark aggregates. Both peaks are shifted to lower wave numbers, in close relation to organic matter peaks (O-H, C-H and C-C stretching).
The band positions for both mineral phases are not clearly assignable to a single iron mineral phase, but rather indicate a mixing between several mineral phases. In the case of the red-brown mineral phase the main bands (210 cm-1 and 270 cm-1) indicate a hematite structure (α-Fe2O3), but are considerably shifted to lower wavenumbers. Normally, these bands are expected to appear around 225 cm-1 and 293 cm-1 [32, 33]. This band shifting can be explained by the influence of the laser power on the sample. This kind of laser-induced band shifting accompanied by a broadening of the band was already described by [33]. The bands of the spectra described here are even more shifted but also are much broader. Similar shifted band positions were reported by [34] for ferrihydrite which was transformed into hematite due to thermal influence of the laser excitation. During our experiments, it is likely that the laser power caused a transformation from ferrihydrite into hematite. Another explanation for these shifted band positions could be a proportion of either FeOOH (goethite) and/or FeO (wüstite) in the sample. A comparison of our spectrum with that of iron borate vonsenite (Fe2FeO2 (BO3; RRUFF database (RRUFF ID: R050221; [35]) shows that the bands can be related to mixed mineral phases of Fe2O3 (hematite) and FeO. The existence of the smaller broad band around 380 cm-1 supports the influence of FeOOH in the spectrum.
The main bands of the dark mineral phase are possibly assignable to Fe3O4 (magnetite), but are also shifted to lower wavenumbers. It is also possible that in this case a proportion of FeO (wüstite) is responsible. In the literature bands for magnetite and wüstite were reported to be the same [32], but in wüstite, the main band is shifted to lower wavenumbers, due to non-equivalent sites in the wüstite structure [33].
The elemental analysis revealed that the iron content is quite high and comprises up to 40% (406 mg/g) of the lyophilized Frutexites-like biofilm (Table 2). Small amounts of Ca, Si and Mn occur along with iron oxides. The organic carbon (Corg) is rather low (4.5%). Trace amounts of inorganic carbon (Cinorg), nitrogen (Ntotal) and sulfur (Stotal) were also detected (Table 2). Carbon phase analyses indicate that the inorganic carbon is present as siderite (FeCO3), verified by comparison with a siderite standard.
Table 2. Major elemental composition of the Frutexites-like biofilm.
The amounts are given in mg/g or respectively % dry weight.
| Fe | Ca | Si | Na | Mn | Mg | Sr | Ba | K | |
| mg/g | 406.3 | 29.74 | 28.45 | 5.50 | 14.79 | 4.57 | 0.570 | 0.715 | 0.469 |
| Ctotal | Corg | Cinorg | Ntotal | Stotal | |||||
| % | 5.12 | 4.54 | 0.59 | 0.371 | 0.255 |
All in all, the Frutexites-like biofilm largely consists of ferrihydrite. Minor phases of Fe(III) containing minerals are present, such as hematite and goethite (and magnetite). Small amounts of Fe(II) containing phases such as siderite and magnetite (together with wüstite) were also detected.
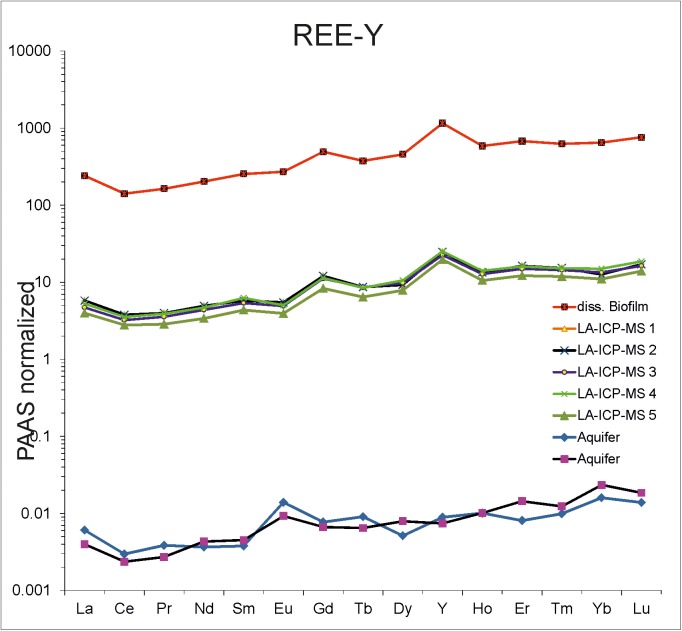
REE-Y were analyzed to compare the REE-Y concentrations in the feeding aquifer and the dissolved biofilm (Fig 11; Table 3). The REE-Y fractionation pattern of the aquifer shows a preferential enrichment of heavy REE-Y over light REE-Y and a minor positive europium (Eu) anomaly. The REE-Y pattern of the biofilm (La-ICP-MS and dissolved biofilm) mirrors the fractionation pattern of the aquifer, except for a little positive Y anomaly. The biofilm shows an up to 105-fold enrichment of REE-Y compared to the aquifer.
Fig 11. REE data from the Frutexites-like biofilm and the corresponding aquifer.
Note that the REE-Y pattern in the biofilms follows completely the same trend as the REE-Y pattern of the aquifer.
Table 3. Rare earth element and yttrium (REE-Y) concentrations of the aquifer and the Frutexites-like biofilm (LA-ICP-MS measurements and dissolved biofilm).
The amounts are given in ng/g.
| Aquifer | Aquifer | LA-ICP-MS 1 | LA-ICP-MS 2 | LA-ICP-MS 3 | LA-ICP-MS 4 | LA-ICP-MS 5 | diss. Biofilm | |
|---|---|---|---|---|---|---|---|---|
| La | 0.232 | 0.152 | 114.0 | 221.0 | 179.4 | 200.7 | 151.5 | 9171 |
| Ce | 0.236 | 0.188 | 177.0 | 301.0 | 256.0 | 282.3 | 220.7 | 11213 |
| Pr | 0.034 | 0.024 | 15.5 | 35.0 | 31.4 | 34.4 | 25.2 | 1441 |
| Nd | 0.124 | 0.146 | 76.0 | 167.0 | 148.3 | 158.8 | 114.7 | 6868 |
| Sm | 0.021 | 0.025 | 17.0 | 32.0 | 29.8 | 34.7 | 24.2 | 1407 |
| Eu | 0.015 | 0.010 | 3.4 | 5.9 | 5.3 | 5.4 | 4.3 | 293 |
| Gd | 0.036 | 0.031 | 29.6 | 56.1 | 52.0 | 52.9 | 38.7 | 2299 |
| Tb | 0.007 | 0.005 | 1.8 | 6.7 | 6.7 | 6.5 | 5.0 | 290 |
| Dy | 0.024 | 0.037 | 14.5 | 43.2 | 45.7 | 49.5 | 36.8 | 2133 |
| Y | 0.241 | 0.200 | 343.0 | 667.0 | 607.0 | 679.0 | 532.0 | 31209 |
| Ho | 0.010 | 0.010 | 4.7 | 13.3 | 12.6 | 13.9 | 10.4 | 580 |
| Er | 0.023 | 0.041 | 23.5 | 46.5 | 42.5 | 45.7 | 34.7 | 1928 |
| Tm | 0.004 | 0.005 | 2.9 | 6.2 | 5.8 | 6.2 | 4.8 | 253 |
| Yb | 0.045 | 0.066 | 15.4 | 35.5 | 37.7 | 42.2 | 31.0 | 1828 |
| Lu | 0.006 | 0.008 | 3.1 | 7.4 | 7.1 | 8.0 | 6.0 | 329 |
Discussion
Stromatolitic Fe-oxide precipitating biofilms growing on rock surfaces at 160 m depth in the Äspö HRL were investigated. Microscopic investigations revealed that these biofilms exhibit laminar and dendritic patterns that strongly resemble those of fossil Frutexites structures, and are quite similar in size and shape to those originally described by Maslow [18]. A comprehensive geomicrobiological approach including FISH, 454 pyrosequencing, Raman spectroscopy, biomarker and elemental analyses allowed further elucidation of the architecture of these microbial systems.
Microbial community
The Frutexites-like biofilm harbors bacteria closely associated with the known iron oxidizers Mariprofundus ferrooxydans and Gallionella ferruginea, and the iron reducer Magnetospirillum magneticum, which are directly involved in the iron cycle. The presence of these organisms in the Äspö HRL is well known, they have been found and analysed already in detail [24, 36, 37].
The dominant microorganisms within the recent Frutexites structures are relatives of ammonia oxidizing bacteria (AOB, ammonia oxidation to nitrite) and nitrite oxidizing bacteria (NOB, nitrite oxidation to nitrate). This is unexpected because nitrification provides very little energy and accordingly AOB and NOB rarely dominate microbial communities. While recent publications have identified members of the genus Nitrospira that are capable of performing ammonia and nitrite oxidation in conjunction, and thereby gaining more energy [38, 39], the presence of NOB suggests that this is not the case in the Frutexites-like structures. This is further supported by the high abundance Candidatus Nitrotoga, an important and efficient nitrite oxidizer, which is capable of nitrite-dependent autotrophic carbon fixation. This organism requires much lower nitrite concentrations compared to needs of Nitrospira and Nitrobacter [40]. In general, the predominance of NOB within microbial communities is often the result of a low C/N ratio [41]. This is in agreement with the C/N ratio of 12/1 for the Frutexites-like biofilm.
Mineral formation within the biofilm
The iron oxidizing bacteria Mariprofundus sp. and G. ferruginea are known to produce massive amounts of twisted stalks made of EPS and ferrihydrite. These stalks are known to form huge amounts of microbial mats at groundwater outflows in the Äspö HRL and accumulate high amounts of trace elements [e.g. 37, 42]. In the Frutexites biofilms, however, stalks occur only occasionally (Fig 4A), so they are not responsible for the main structures within the biofilm. Furthermore, the presence of dominant nitrifying bacteria affects ferrous iron (Fe(II)) availability for iron oxidizing bacteria that require Fe(II) for their metabolism. Ferrous iron has long been known to accelerate the oxidation of ammonia and nitrite [43]. In contrast, microbial ferric iron (Fe(III)) reduction inhibits the reduction of nitrate or nitrite [44]. It is likely that Fe(III) formation results from indirect (i.e. not enzymatically mediated) microbial oxidation of Fe(II) by nitrite produced via bacterial respiration of nitrate [45]. Another significant aspect which influences mineralization processes are reactive organic interfaces like cell surfaces and EPS which may act as mineralizing templates [46, 47]. Functional groups on cell surfaces and in the EPS may easily connect to free cations, thereby forming complexes, which often lead to mineral nucleation. EPS in biofilms is composed of polysaccharides, proteins, lipids and humic substances, and also free nucleic acids [48, 49]. The Alcian blue stained sections (Fig 3) and the TEM sections (Fig 5) exhibit a significant amount of EPS, particularly accumulated around the cells and the tips of the dendritic structures where the mineral nucleation takes place. In general, FE-SEM, TEM and FISH analysis show a tight association of biotic and mineral structures. It has been considered that a portion of the Fe-minerals may derive from physico-chemical precipitation; however an exact differentiation of abiotic and biotic mineralization processes within recent Frutexites is not possible. Recent studies on biotic vs abiotic Fe mineralization in microbial mats came to a similar conclusion [50].
REE-Y
The PAAS normalized REE-Y pattern of the aquifer is quite typical for marine waters. This is plausible, as the aquifer is highly influenced by Baltic Sea water which has the same fractionation pattern [e.g. 21, 22]. It has been shown that iron oxides, regardless of their origin (biologic or abiotic) tend to mirror the REE-Y pattern of the respective fluid [37] Therefore, the REE-Y pattern of the Frutexites-like biofilm only indicates the marine origin of the fluid source. This is in common with other fossil iron oxide depositions like banded iron formation [e.g. 51, 52]. An element fractionation pattern related to iron oxidizing microbial activity has not been observed so far.
Lipid biomarkers
The most abundant saturated fatty acids (FA) C16 and C18 are unspecific, as they are common in most bacteria and eukaryotes. Although the number and position of double bonds in unsaturated fatty acids may be indicative for certain groups of recent organisms, their preservation potential is rather low. Therefore, the focus of the discussion is placed on compounds which are suitable biomarkers for the long term fossil record, like i.e. fatty acids with methyl branches, steroids or hopanoids.
Iso- and anteiso branched FA like i- and ai-C15; i-C16, 10Me-C16 and i-C17 are commonly produced by gram-positive bacteria and some anaerobic bacteria [53, 54, 55, 56, 57]. When occurring in higher amounts, iso- and anteiso branched C15 and C17 FA are often associated with sulphate reducing bacteria [e.g. 58, 59, 60, 61, 62]. The relatively low abundance of branched FA in the TOE is in a similar range as it has been described for different NOB [31].
The organic compounds diploptene, diplopterol were reported to be highly abundant in Nitrosomonas europaea [63]. This organism also produces high concentration of aminohopanetriol, but this compound was not observed. Other hopanepolyols were detected in considerable amounts, but they are common in many bacteria. The branched hydoxy fatty acid trihydroxy-i-C11, and trihydroxy-i-C17 which are abundant in Mariprofundus sp. [64] were not detected. Notably, the Frutexites-like biofilm contained numerous sterols, indicating a significant eukaryotic contribution to the biofilm. Cholesterol, sitosterol, ergosta-5,22-dienol and ergosta-5,7-dienol have been found in several micro algae [65, 66, 67, 68]. Even though the most typical fungal sterol (ergosterol) is lacking, most of the sterols observed in the Frutexites-like biofilm could also derive from fungi [e.g. 69]. As both algae and fungi can form net-like structures and dendritic patterns; their contribution to the “typical Frutexites structure” is plausible. A symbiotic relationship of bacteria and fungi leading to the formation of Frutexites has recently been hypothesized [70].
Despite the observation of archaea with FISH (Fig 7D and 7H), characteristic isoprenoid biomarkers like pentamethylicosane, archaeol and or hydroxyarchaeol have not been detected. Archaeal tetraether lipids may be present, but have not been analyzed. This initial chemical investigation of the Frutexites-like biofilm implies that the diversity of this biofilm is quite complex and requires more in-depth studies to determine the interaction of the different prokaryotes and eukaryotes that form these structures.
Conclusion
Our results make a strong case for the contributions of prokaryotic and eukaryotic organisms to the formation of Frutexites-like structures. The recent Frutexites-like biofilm contained numerous archaeal and bacterial microorganisms. Lipid biomarker analysis indicated the presence of eukaryotes, namely algae and fungi. The identification and functional role of algae and/or fungi and their contribution to the dendritic structure of Frutexites need to be investigated further. Furthermore, the detected biomarkers are suitable for comparable biomarker studies in ancient Frutexites in the future. Side-by-side occurrences of Fe(II) and Fe(III) mineral phases can be used as an indicator for biologically governed microenvironments. The association of such mineral phases may also be a “signature” to look for in fossil environments.
Acknowledgments
We acknowledge with gratitude the detailed and constructive comments provided by the reviewers. We are grateful to SKB and its team for technical and logistic support at the Äspö Hard Rock Laboratory. Special thanks go to our technicians Wolfgang Dröse and Dorothea Hause-Reitner for optimizing embedding and sectioning procedures for samples and carrying out FEM imaging. Volker Thiel is greatly acknowledged for his constructive comments on the original manuscript. The manuscript was significantly improved by Leyla Seyfullah’s linguistic advice. We acknowledge the financial support by the German Research Foundation (DFG) and the Open Access Publication Funds of the Göttingen University.
Data Availability
All relevant data are included in the revised manuscript. Sequences data were deposited at the Sequences Read Archive (SRA) under study accession number PRJEB4914 (http://www.ebi.ac.uk/ena/data/view/PRJEB4914).
Funding Statement
This work was supported by German Research Foundation-funded Research Unit FOR 571 ‘Geobiology of Organo- and Biofilms’; Open Access Publication Funds of the Göttingen University.
References
- 1.Reid RP, Visscher PT, Decho AW, Stolz JF, Bebout BM, Dupraz C, et al. The role of microbes in accretion, lamination and early lithification of modern marine stromatolites. Nature 2000; 406: 989–992. doi: 10.1038/35023158 [DOI] [PubMed] [Google Scholar]
- 2.Arp G, Reimer A, Reitner J. Photosynthesis-induced biofilm calcification and calcium concentrations in Phanerozoic Oceans. Science 2001; 292: 1701–1704. doi: 10.1126/science.1057204 [DOI] [PubMed] [Google Scholar]
- 3.Kazmierczak J, Kempe S. Genuine modern analogues of Precambrian stromatolites from caldera lakes of Niuafo’ou Island, Tonga. Naturwiss. 2006; 93: 119–126. doi: 10.1007/s00114-005-0066-x [DOI] [PubMed] [Google Scholar]
- 4.Shiraishi F, Bissett A, de Beer D, Reimer A, Arp G. Photosynthesis, Respiration and Exopolymer Calcium-Binding in Biofilm Calcification (Westerhöfer and Deinschwanger Creek, Germany). Geomicrobiol J. 2008; 25: 83–94. [Google Scholar]
- 5.Dupraz C, Reid RP, Braissant O, Decho AW, Norman RS, Visscher PT. Processes of carbonate precipitation in modern microbial mats. Earth Sci Rev. 2009; 96: 141–162. [Google Scholar]
- 6.Reitner J. Langsford N., Kruse P. An unusual ferruginous-calcitic Frutexites microbialite community from the lower Cambrian of the Flinders Ranges, South Australia. PalZ. 2017; (in press). [Google Scholar]
- 7.Myrow PM, Coniglio M. Origin and diagenesis of cryptobiontic Frutexites in the Chapel island Formation (Vendian to Early Cambrian) of Southeast Newfoundland, Canada. Palaios 1991; 6: 572–585. [Google Scholar]
- 8.Böhm F, Brachert TC. Deep-water stromatolites and Frutexites Maslov from the Early and Middle Jurassic of S-Germany and Austria. Facies 1993; 28: 145–168. [Google Scholar]
- 9.Reitner J. Modern cryptic microbialite/metazoan facies from Lizard Island (Great Barrier Reef Australia): formation and concepts. Facies 1993; 29: 3–40. [Google Scholar]
- 10.Gischler E. Late Devonian-Early Carboniferous deep-water coral assemblages and sedimentation on a Devonian seamount: Iberg Reef, Harz Mts., Germany. Palaeo 3 1996; 123: 297–322. [Google Scholar]
- 11.Cavalazzi B, Barbieri R, Ori G. Chemosynthetic microbialites in the Devonian carbonate mounds of Hamar Laghdad (Anti-Atlas, Morocco). Sedimentary Geol. 2007; 200: 73–88. [Google Scholar]
- 12.Woods AD, Baud A. Anachronistic facies from a drowned Lower Triassic carbonate platform: Lower member of the Alwa Formation (Ba'id Exotic), Oman Mountains. Sedimentary Geol. 2008; 209: 1–14. [Google Scholar]
- 13.Andrews JE, Kendal AC, Hall A. Microbial crust with Frutexites(?) and iron staining in chalks: Albian–Cenomanian boundary, Hunstanton, UK. Geol Mag. 2014; 152: 1–11. [Google Scholar]
- 14.Rodriguez-Martinez M, Heim C, Quéric NV, Reitner J. Frutexites In: Reitner J, Thiel V (eds) Encyclopedia of Geobiology, Springer; 2011; pp 396–400. [Google Scholar]
- 15.Guido A, Rosso A, Sanfilippo R, Russo F, Mastandrea A. Frutexites from microbial/metazoan bioconstructions of recent and Pleistocene marine caves (Sicily, Italy). Palaeo 3. 2016; [Google Scholar]
- 16.Reitner J, Wilmsen M, Neuweiler F. Cenomanian/Turonian sponge microbialite deep-water hardground community (Liencres, Northern Spain). Facies. 1995; 32: 203–212. [Google Scholar]
- 17.Andres MS, Reid PR. Growth morphologies of modern marine stromatolites: A case study from Highborne Cay, Bahamas. Sedimentary Geol. 2006; 185: 319–328. [Google Scholar]
- 18.Maslow VP. Stromatolites. Trudy Instituta geologicheskikh nauk Akademiya nauk SSR; 1960; 41: 188 pp. [Google Scholar]
- 19.Wahlgren C-H, Hermanson J, Forssberg O, Curtis P, Triumf C-A, Drake H, et al.Geological description of rock domains and deformation zones in the Simpevarp and Laxemar subareas. Preliminary site description Laxemar subarea—version 1.2. Svensk Kärnbränslehanteriang AB. 2006; R-05-69, 265p.
- 20.Laaksoharju M, Tullborg EL, Wikberg P, Wallin B, Smellie J. Hydrogeochemical conditions and evolution at the Äspö HRL, Sweden. Appl Geochem. 1999; 14: 835–859. [Google Scholar]
- 21.Rönnback P, Åström M, Gustafsson JP. Comparison of the behaviour of rare earth elements in surface waters, overburden groundwaters and bedrock groundwaters in two granitoidic settings, Eastern Sweden. Applied Geochem. 2008; 23: 1862–1880. [Google Scholar]
- 22.Hengsuwan M, Heim C, Simon K, Hansen BT. Long-term investigation of Sr- isotope and Rare Earth Element fractionation processes within three major aquifers in the Äspö Hard Rock Laboratory (Sweden). Geomicrobiol J. 2015; 32: 243–254. [Google Scholar]
- 23.Manz W, Arp G, Schumann-Kindel G, Szewzyk U, Reitner J. Widefield deconvolution epifluorescence microscopy combined with fluorescence in situ hybridization reveals the spatial arrangement of bacteria in sponge tissue. J. Microbiol. Methods. 2000; 40: 125–134. [DOI] [PubMed] [Google Scholar]
- 24.Ionescu D, Heim C, Polerecky L, Ramette A, Haeusler S, Bizic-Ionescu M, et al. Diversity of iron oxidizing and reducing bacteria in flow reactors in the Äspö Hard Rock Laboratory. Geomicrobiol J. 2015; 32: 207–220. [Google Scholar]
- 25.Lane DJ. 16S/23S rRNA sequencing p. In: Stackebrandt E, Goodfellow M, editors. Nucleic acid techniques in bacterial systematics. Chichester, UK: John Wiley & Sons; P. 1991; 115–175. [Google Scholar]
- 26.Dowd SE, Sun Y, Wolcott RD, Domingo A, Carroll JA. Bacterial tag-encoded FLX amplicon pyrosequencing (bTEFAP) for microbiome studies: bacterial diversity in the ileum of newly weaned Salmonella-infected pigs. Foodborne Pathog Dis. 2008; 5: 459–472. doi: 10.1089/fpd.2008.0107 [DOI] [PubMed] [Google Scholar]
- 27.Ionescu D, Siebert C, Polerecky L, Munwes YY, Lott C, Häusler S, et al. Microbial and chemical characterization of underwater fresh water springs in the Dead Sea. PLoS One. 2012; 7:e38319 doi: 10.1371/journal.pone.0038319 [DOI] [PMC free article] [PubMed] [Google Scholar]
- 28.Quast C, Pruesse E, Yilmaz P, Gerken J, Schweer T, Yarza P, et al. The SILVA ribosomal RNA gene database project: improved data processing and web-based tools. Nucl Acids Res. 2013; 41, D590–596. doi: 10.1093/nar/gks1219 [DOI] [PMC free article] [PubMed] [Google Scholar]
- 29.Fu L, Niu B, Zhu Z, Wu S, Li W. CD-HIT: accelerated for clustering the next-generation sequencing data. Bioinformatics. 2012; 28: 3150–3152. doi: 10.1093/bioinformatics/bts565 [DOI] [PMC free article] [PubMed] [Google Scholar]
- 30.McLennan S.M. Rare earth elements in sedimentary rocks: influence of provenance and sedimentary processes. In Lipin BR, McKay GA (eds), Geochemistry and mineralogy of rare earth elements. Rev Mineral. 1989; 21: 169–200.
- 31.Alawi M, Lipski A, Sanders T, Pfeiffer E- M, Spieck E. Cultivation of a novel cold-adapted nitrite oxidizing betaproteobacterium from the Siberian Arctic. ISME J. 2007; 1: 256–264. [DOI] [PubMed] [Google Scholar]
- 32.Thibeau RJ, Brown CW, Heidersbach RH. Raman Spectra of possible corrosion products of iron. Appl Spectrosc. 1978; 32: 532–535. [Google Scholar]
- 33.de Faria DLA, Venâncio Silva S, de Oliviera MT. Raman Microspectroscopy of some iron oxides and oxyhydroxides. J Raman Spectrosc. 1997; 28: 873–878. [Google Scholar]
- 34.Mazzetti L, Thistlethwaite PJ. Raman spectra and thermal transformations of ferrihydrite and schwertmannite. J Raman Spectrosc. 2002; 33: 104–111. [Google Scholar]
- 35.Lafuente B, Downs R T, Yang H, Stone N. The power of databases: the RRUFF project In: Highlights in Mineralogical Crystallography, Armbruster T and Danisi R M, eds. Berlin, Germany, W. De Gruyter; 2015; pp 1–30. [Google Scholar]
- 36.Pedersen K. Microbial life in deep granitic rock. FEMS Microbiol. Rev. 1997. 20,399–414. [Google Scholar]
- 37.Heim C, Simon K, Ionescu D, De Beer D, Quéric N- V, Reitner J, et al. Assessing the utility of trace and rare earth elements as biosignatures in microbial iron oxyhydroxides. Front Earth Sci. 2015 [Google Scholar]
- 38.van Kessel MAHJ Speth DR, Albertsen M, Nielsen PH, Op den Camp HJM, et al. "Complete nitrification by a single microorganism." Nature. 2015; [DOI] [PMC free article] [PubMed] [Google Scholar]
- 39.Daims H, Lebedeva EV, Pjevac P, Han P, Herbold C, Albertsen M, et al. Complete nitrification by Nitrospira bacteria. Nature. 2016; [DOI] [PMC free article] [PubMed] [Google Scholar]
- 40.Lücker S, Schwarz J, Gruber-Dorninger C, Spieck E, Wagner M, Daims H. Nitrotoga-like bacteria are previously unrecognized key nitrite oxidizers in full-scale wastewater treatment plants. ISME J. 2015; 9: 708–720. doi: 10.1038/ismej.2014.158 [DOI] [PMC free article] [PubMed] [Google Scholar]
- 41.Kowalchuk GA, Stephen JR. Ammonia-oxidzing bacteria. A model for molecular microbial ecology. Annu Rev Microbiol. 2001; 55: 485–529. doi: 10.1146/annurev.micro.55.1.485 [DOI] [PubMed] [Google Scholar]
- 42.Anderson CR, Pedersen K. In situ growth of Gallionella biofilms and partitioning of lanthanides and actinides between biological material and ferric oxyhydroxides. Geobiology. 2003; 1: 169–178. [Google Scholar]
- 43.Meiklejohn J. Iron and the Nitrifying Bacteria. J gen Microbiol. 1953; 8: 58–65. doi: 10.1099/00221287-8-1-58 [DOI] [PubMed] [Google Scholar]
- 44.Coby AJ, Picardal FW. Inhibition of NO3- and NO2- reduction by microbial Fe(III) reduction: evidence of a reaction between NO2- and cell surface-bound Fe2+. Appl Environ Microbiol. 2005; 71: 5267–5274. doi: 10.1128/AEM.71.9.5267-5274.2005 [DOI] [PMC free article] [PubMed] [Google Scholar]
- 45.Cooper DC, Picardal FW, Schimmelmann A, Coby AJ. Chemical and biological interactions during nitrate and goethite reduction by Shewanella putrefaciens 200. Appl Environ Microbiol. 2003; 69: 3517–3525. doi: 10.1128/AEM.69.6.3517-3525.2003 [DOI] [PMC free article] [PubMed] [Google Scholar]
- 46.Konhauser K. Introduction to geomicrobiology. Blackwell Publishing, Oxford: 2007: 425p. [Google Scholar]
- 47.Westall F. Morphological Biosignatures in early terrestrial and extraterrestrial materials. Space Sci Rev. 2008; 135: 95–114. [Google Scholar]
- 48.Nielsen PH, Jahn A, Palmgren R. Conceptual model for production and composition of exopolymers in biofilms. Water Sci Technol. 1997; 36: 11–19. [Google Scholar]
- 49.Wingender J, Neu TR, Flemming H-C. What are bacterial extracellular polymeric substances? In: Wingender J, Neu TR, Flemming H-C, (Eds) Microbial Extracellular Polymeric Substances. Springer, Berlin; 1999; 1–15. [Google Scholar]
- 50.Ionescu D, Heim C, Polerecky L, Thiel V, De Beer D. Biotic and abiotic oxidation and reduction of iron at circumneutral pH are inseparable processes under natural conditions. Geomicrobiol J. 2015; 32: 221–230. [Google Scholar]
- 51.Bau M, Dulski P. Distribution of yttrium and rare-earth elements in the Penge and Kuruman iron-formations, Transvaal Supergroup, South Africa. Precambrian Res. 1996; 79: 37–55. [Google Scholar]
- 52.Frei R, Dahl PS, Duke EF, Frei KM, Hansen TR, Fransson MM, et al. Trace element and isotopic characterisation of Neoarchean and Paleoproterozoic formations in the Black Hills (South Dakota, USA): assessment of chemical change during 2.9–1.9 Ga deposition bracketing the 2.4–2.2 Ga first rise of atmospheric oxygen. Precambrian Res. 2008; 162: 441–474. [Google Scholar]
- 53.Edlund A, Nichols PD, Roffey R, White DC. Extractable and lipopolysaccharide fatty acid and hydroxy acid profiles from Desulfovibrio species. J Lipid Res 1985; 26, 982–988. [PubMed] [Google Scholar]
- 54.Goossens H, Rijpstra WIC, Düren RR, De Leeuw JW, Schenck PA, Bacterial contribution to sedimentary organic matter; a comparative study of lipid moieties in bacteria and Recent sediments. Org Geochem 1986; 10: 683–696. [Google Scholar]
- 55.Lechevalier H, Lechevalier MP, Chemotaxonomic use of lipids—An overview In: Ratledge C., Wilkinson S.G. (Eds.), Microbial Lipids. London, UK: Academic Press; 1988. [Google Scholar]
- 56.Kaneda T. Iso- and anteiso-fatty acids in bacteria: biosynthesis, function, and taxonomic significance. Microbiol Rev. 1991; 55: 288–302. [DOI] [PMC free article] [PubMed] [Google Scholar]
- 57.Romano I, Finore I, Nicolaus G, Huertas FJ, Lama L, Nicolaus B, et al. Halobacillus alkaliphilussp nov., a halophilic bacterium isolated from a salt lake in Fuente de Piedra, southern Spain. International J Syst and Evol Microbiol. 2008; 58: 886–890. [DOI] [PubMed] [Google Scholar]
- 58.Taylor J, Parkes RJ. The cellular fatty acids of the sulfate-reducing bacteria Desulfobactersp., Desulfobulbussp. and Desulfovibrio desulfuricans. J Genetic Microbiol. 1985; 129: 3303–3309. [Google Scholar]
- 59.Dowling NJE, Widdel F, White DC, Phospholipid ester-linked fatty acid biomarkers of acetate-oxidizing sulphate-reducers and other sulphide-forming bacteria. J Gen Microbiol. 1986; 132: 1815–1825. [Google Scholar]
- 60.Vainshtein M, Hippe H, Kroppenstedt RM, Cellular fatty acid composition of Desulfovibrio species and its use in classification of sulphate-reducing bacteria. Sys Appl Microbiol. 1992; 15: 554–566. [Google Scholar]
- 61.Elvert M, Boetius A, Knittel K, Jorgensen BB. Characterization of specific membrane fatty acids as chemotaxonomic markers for sulfate-reducing bacteria involved in anaerobic oxidation of methane. Geomicrobiol J. 2003; 20: 403–419. [Google Scholar]
- 62.Ziegenbalg SB, Birgel D, Hoffmann-Sell L, Pierre C, Roche JM, Peckmann J. Anaerobic oxidation of methane in hypersaline Messinian environments revealed by 13C-depleted molecular fossils. Chem Geol. 2012; 292–293:140–148. [Google Scholar]
- 63.Seemann M, Bisseret P, Tritz J-P, Hooper AB, Rhomer M. Novel Bacterial Triterpenoids of the Hopane Series from Nitrosomonas europaea and their significance for the formation of the C35 bacteriohopane skeleton. Tetrahedron L. 1999; 40: 1681–1684. [Google Scholar]
- 64.Emerson D, Rentz JA, Lilburn TG, Davis RE, Aldrich H, Chan C, et al. A novel lineage of proteobacteria involved information of marine Fe-oxidizing microbial mat communities. PLoSONE 2007:e667. [DOI] [PMC free article] [PubMed] [Google Scholar]
- 65.Volkman JK, Barett SM, Blackburn SI, Mansour MP, Sikes E, Gelin F. Microalgal biomarkers: A review of recent research developments. Org Geochem. 1998; 5–7: 1163–1179. [Google Scholar]
- 66.Marshall JA, Nichols PD, Hallegraeff GM. Chemotaxonomic survey of sterols and fatty acids in six marine raphidophyte algae. J Appl Phycol. 2002; 14: 255–265. [Google Scholar]
- 67.Giner J- L, Zhao H, Tomas C. Sterols and fatty acids of three harmful algae previously assigned as Chattonella. Phytochemistry. 2008; 69: 2167–2171. doi: 10.1016/j.phytochem.2008.05.013 [DOI] [PubMed] [Google Scholar]
- 68.Leblond JD, Timofte HI, Roche SA, Porter NM. Sterols of Glaucocystophytes. Phycoll Res. 2011; 59: 129–134. [Google Scholar]
- 69.Weety JD, Abril M, Blackwell M. Phylogenetic distribution of fungal sterols. PLoS ONE. 2010; 5(5): e10899 doi: 10.1371/journal.pone.0010899 [DOI] [PMC free article] [PubMed] [Google Scholar]
- 70.Ivarsson M, Bengtson S, Neubeck A. The igneous oceanic crust–Earth’s largest fungal habitat? Fungal Ecol. 2016; 20: 249–255. [Google Scholar]
Associated Data
This section collects any data citations, data availability statements, or supplementary materials included in this article.
Data Availability Statement
All relevant data are included in the revised manuscript. Sequences data were deposited at the Sequences Read Archive (SRA) under study accession number PRJEB4914 (http://www.ebi.ac.uk/ena/data/view/PRJEB4914).


